GreenBIKE Project - Best NMT Project 2010
•
3 gefällt mir•1,264 views

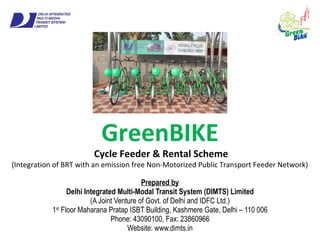
GreenBIKE is a cycle feeder and rental scheme integrated with Delhi's Bus Rapid Transit (BRT) system to provide a sustainable transportation option. It includes 5 bicycle stations located near BRT stations, with 50 bicycles available for rental. Surveys found most users were male, aged 20-30, and rented bicycles to commute faster than other modes for distances of 1-5 km. Since launching in 2009, GreenBIKE has gained popularity among commuters, with an average of 50-60 daily users and a 99% customer satisfaction rate. It helps reduce emissions and traffic by providing a low-cost alternative to short car or motorcycle trips within the BRT corridor.

Empfohlen
Empfohlen
Weitere ähnliche Inhalte
Was ist angesagt?
Was ist angesagt? (20)
Ähnlich wie GreenBIKE Project - Best NMT Project 2010
Ähnlich wie GreenBIKE Project - Best NMT Project 2010 (20)
Mehr von Jaspal Singh
Mehr von Jaspal Singh (20)
Kürzlich hochgeladen
Kürzlich hochgeladen (20)
GreenBIKE Project - Best NMT Project 2010
- 1. GreenBIKE Cycle Feeder & Rental Scheme (Integration of BRT with an emission free Non-Motorized Public Transport Feeder Network) Prepared by Delhi Integrated Multi-Modal Transit System (DIMTS) Limited (A Joint Venture of Govt. of Delhi and IDFC Ltd.) 1st Floor Maharana Pratap ISBT Building, Kashmere Gate, Delhi – 110 006 Phone: 43090100, Fax: 23860966 Website: www.dimts.in
- 2. Structure of the Presentation • Introduction……………………………………………………………………..Slide 03 • Delhi Bus Rapid Transit Corridor………………………………………. Slide 07 • GreenBIKE – BEST NMT Project…………………………………………Slide 11 • Outreach Program – Marketing & Promotion……………………Slide 16 • Users Surveys……………………………………………………………………Slide 17 • Effectiveness of the project……………………………………………… Slide 19 • Pick-up and Drop-offs by Location…………………………………….Slide 21 • Financial Details………………………………………………………………..Slide 25 • Media Coverage………………………………………………………………..Slide 26 2
- 3. About Delhi • Delhi is emerging as one of the largest cities of the world and is India’s second biggest city after Mumbai in terms of its population • According to the Census of India 2001, the population of Delhi was 13.8 million. • As per the current estimates (Census of India, Projected Population 2008), it has a population of around 17.0 million, which includes 4-5% migratory population 3
- 4. Traffic Condition in Delhi 4
- 5. Modal Split in Delhi 10.3% 17.2% 3.1% 59.8% 0.0% 0.7% 5.3% 3.6% 13.9% 21.5% 3.6% 41.5% 4.1% 0.7% 6.8% 7.9% Car/Taxi Two Wheelers Auto Rickshaw Bus Metro Train (IR) Bicycle CycleRickshaws Modal Split - % of Person Trips in Delhi* (Figures in Percent) 2000-01 2007-08 14.4 million person trips(without Walk trip) are made in a day. 5
- 6. Sustainable Public Transportation System Decision Makers of the World are debating over finding the most Sustainable Public Transportation system. Metro Rail, Sky Bus, Light Rails are the latest buzz words in the realm of Public Transport. “Sustainable Transport” is about meeting or helping the mobility needs of the present without compromising the ability of future generations to meet their needs. There is a need to look effective solutions like Bus Rapid Transit. 6
- 7. Delhi Bus Rapid Transit Corridor • Delhi BRT Corridor is 14.5 kms long and covers the stretch from Dr. Ambedkar Nagar to Delhi Gate. – The first part of the corridor stretch from Dr. Ambedkar Nagar to Moolchand (5.8 kms) is operational since April 2008. – The second part of the stretch from Moolchand to Delhi Gate (8.7 kms) became operational in January 2010. • Delhi Bus Rapid Transit (BRT) Corridor joins the South part of city to the North side, is considered to be the main arterial road of Delhi. 7 BRT Corridor (Dr. Ambedkar Nagar to Delhi Gate) and Key Landmark
- 8. OperationalOperational Corridor Detail Total Length 14.5 Kms Road Right of Way 28 – 55 Meters Number of Road Junctions 17 Number of Bus Stations 29 Bus Lanes 2 X 3.3 M MV Lanes 2 X 6.75 M NMV Lanes 2 X 2.5 M Footpath 2 X 1.5 M 8 Delhi First BRT Corridor
- 9. Need of Feeder System along BRT Corridor • According to Socio Economic Study of BRT Corridor Report (2006), the average distance for which households commuters along the BRT corridor commute is 8.6 Kms, though most of them are commuting between1-5 Kms (47.7%) or 6-10 Kms (33.5%). • This data clearly predict that with better cycling infrastructure and Cycle Share initiatives, DIMTS can target 50% households’ commuters. 9 > 20 Kms 3% 1-5 Kms 47% 6-10 Kms 33% 11-15 Kms 9% 16-20 Kms 7% <1 Kms 1% Households - Distance of Destination from Home (100% = 2,035 Commuters) A lot of trips using private modes can be reduced by creating a city-wide cycling infrastructure and integrating them with public modes of transport like Metro, BRT and bus infrastructure. Source: Socio Economic Study of BRT Corridor Report 2006
- 10. Need of Feeder System along BRT Corridor 10 1-5 Kms 54.1% <1 Kms 38.6% 6-10 Kms 4.5% >20 Kms 0.5% 16-20 Kms 0.0% 11-15 Kms 2.3% Households– Distance of the Destination from the Bus Stop (100% = 749 Commuters) Source: Socio Economic Study of BRT Corridor Report 2006 • Similiary, the average distance of commuters to reach the place of destination from bus stop at the BRT Corridor is 2.2 kms. Around 54% of commuters have to travel a distance of 1- 5 kms to reach the place of destination from bus stop and 39% have to travel less than 1 km. • DIMTS can target 93% households’ commuters to use bicycle to reach to their destination using bicycle. Cycles can be efficient and cost-effective means of transport to access the BRT system in Delhi. It will help reduce carbon emissions and if implemented with proper planning, could help the public transport system become carbon-neutral.
- 11. GreenBIKE Initiatives • GreenBIKE is first of its kind initiatives in Delhi (even in the country), which integrate Bus-based Transport system with cycling. • In order to develop, an eco-friendly environment near BRT Corridor in Delhi by discouraging petrol/diesel driven vehicles on roads and encouraging use of cycles amongst commuters. • DIMTS has constructed five (5) cycle stations along the BRT Corridor on Build-Own-Transfer (BOT) model. 11 GreenBIKE aims to improve the Cycle Transportation System in the city. Besides hard infrastructure like dedicated cycle tracks and path, there is always a need of institutional backing to promote cycling as a mode of transport. GreenBIKE addresses both the issues of providing sustainable feeder network and supporting hard infrastructure.
- 12. GreenBIKE – First Cycle Share Scheme in India GreenBIKE service was commenced on October 11, 2009 and a cycle rally was organized in collaboration with Delhi Cycling Club (DCC) on the inaugural day to enhance the awareness about the ‘Cycle Feeder and Rental Scheme’ along the BRT corridor. 12
- 13. Key Details 13 No. of Bicycles 50 (10 Cycles at each Station) No. of GreenBIKE Stations 5 Stations Public Parking Facilities Available for 5 Bicycles No. of Registered Members 80 No. of daily customers (average) 50-60 No. of employees involoved 15 (5 DIMTS + 10 Concessionarire) Average duration of trip (estimated) 2-3 hours Average bicycle occupancy / day 1.23 Average Number of trips in a week 700-750 Working Hours 5:00 AM to 10:30 AM Fare Structure -First 4 hours -Each extra hour Rs. 10 Rs. 5
- 14. The Bike Sharing System Three simple steps are necessary to ensure the user care-free and individual transport: REGISTER – GreenBIKE offers various methods of registration to meet the needs of the user and city. A user card is made available upon registration. RIDE – at the GreenBIKE stations, customers can get a bicycle by showing registration card or identification card to the security personnel. RETURN – GreenBIKE’s users can return their bike to any station on the corridor. The bike is automatically locked and ready for the next user 14 • The feeder and rental scheme is currently introduced at 5 locations - Dr. Ambedkar Nagar, Shiekh Sarai, Chirag Delhi, Siri Fort and Andrew Ganj as these are the main junctions and near to bus stops. • DIMTS is planning to setup 5 more GreenBIKE stations between Moolchand to Delhi Gate stretch.
- 15. Type of Innovation 15 • Product Innovation - introducing new modern bicycles • Process Innovation - introducing new cycle sharing concept in India • Positioning Innovation - repositioning cycling as a sustainable mode of transport then a poor man’s vehicle • Paradigm Innovation - introducing cycling as a key feeder service than viewing it as an object of congestion.
- 16. Public Awareness - Information Availability 16 DIMTS uses various channels to create awareness about GreenBIKE Cycle Rally (Climate Ride) – December 2009 Cycle Rally (Earth Hour) – March 2010 • DIMTS organizes cycle rallies frequently in collaboration with different groups on the BRT Stretch to motivate people to use cycle. • Social Media tools are being used to reach to large number of people to disseminate information about the project. Flash Mobs – September 2010
- 17. Users Profile 17 User Profile – Male & Female User Profile – Age Group User Profile – Education User Profile – Vehicle Ownership Male 86% 20-30 years 63% 12th Grade 54% No Vehicle 38% Two- wheeler or Car 50% In February 2010, GTZ in co-operation with DIMTS, began to survey, GreenBIKE, the cycle feeder and rental scheme on the BRT corridor with a view to understand user needs, profiles and ways in which the scheme could be developed further. The user profile is as follows: Source: GTZ Survey, February 2010
- 18. Key Survey Findings 18 • Each station had a daily average of 11 customers. • 49.6% of all respondents rented a bicycle at least once a week. • The average rental time was 174 minutes, which was a very high figure compared to most other rental schemes in the world. • With a bicycle occupancy rate of 1.1, the average number of trips per day worked out to be only 55 along the BRT corridor stations. • The user evaluation that the scheme received was very positive, with almost 99.0% respondents saying they would use the system regularly. • 49.6% of all respondents rent a bicycle at least once a week. Source: GTZ Survey, February 2010
- 19. Impact of GreenBIKE • Although cycling is also attractive for health and environment reasons, the majority of users hire cycles for practical reasons. • Commuters observe that cycling is faster than any other mode of transport’ for completing their trip. • It is interesting to know that half of users are ‘regular’, sharing a cycle more than once a week. Customer satisfaction rates topped 99% with this proportion of customers saying they would rent again. 19 No 24% Yes 76% By Renting a Bicycle Your Trip was Faster Than with any Other Mode of Transport What was the Purpose of Your Trip with the Rented Cycle Shopping & Services (Bank, Post etc.) 38% Leisure 12% Visiting Relatives 12% Other 8% Commuting to work/college 30% Source: GTZ Survey, February 2010
- 20. Impact of GreenBIKE 20 What was the Reason for you to Chose a Rental Bicycle Source: GTZ Survey, February 2010
- 21. Pick-up and drop-offs by Location • Users pay Rs. 10 per for the approx. usage of 3 hrs. 21 Dr. Ambedkar Nagar Shiekh Sarai Chirag Delhi Siri Fort Andrew Ganj Total Dr. Ambedkar Nagar 82 35 18 4 3 142 Shiekh Sarai 25 71 22 9 4 131 Chirag Delhi 19 29 89 12 0 149 Siri Fort 2 3 37 65 17 124 Andrew Ganj 1 4 7 47 92 151 Total 129 142 173 137 116 697 DROP - OFFS PICK - UP Detail of Pick - up and Drop - offs - From 25th October – 02nd November, 2010
- 22. Co-benefits of the Scheme • Fuel Saving: Currently around 50-60 people are using the GreenBIKE service, out of which 50% own two-wheeler and four-wheeler. 22 • Wheelchair Facility: All GreenBIKE stations are near the bus stops at BRT Corridor. This enables to station Wheelchairs for disabled and sick persons at these stations.
- 23. Comparison of Bike Rental Scheme in India • GTZ has conducted a study to study Public Cycle Schemes in all developing cities to find out the status of cycle sharing scheme around the world. • GTZ also compared Cycle Sharing scheme launched in India – Delhi and Thane. 23Source: Public Cycle Schemes: Applying the Concept in Developing Cities, GTZ, August 2010
- 24. Comparison of Bike Rental Scheme in India 24 GreenBIKE is the largest and the oldest Cycle Sharing Project in India. Source: Public Cycle Schemes: Applying the Concept in Developing Cities, GTZ, August 2010
- 25. Financial Details 25 Particulars DIMTS Limited The Concessionaire 2010 2011 2012 2010 2011 2012 Revenue (Inflows) – In Rupees - Advertising Revenue1 12,00,600 13,20,200 14,53,600 35,99,960 39,56,000 43,47,000 - Membership Fees2 -- -- -- 20,700 39,100 59,800 - Hire Charges3 -- -- -- 27,60,000 27,60,000 27,60,000 Total Revenue – In Rupees 12,00,600 13,20,200 14,53,600 63,80,660 67,55,100 71,66,800 Expenditure (Outflows) - In Rupees - Initial Investment4 -- -- -- 36,80,000 7,30,020 7,30,020 - Operation & Maintenance -- -- -- 17,39,996 19,14,014 21,05,420 - Manpower Cost -- -- -- 6,72,014 7,39,220 8,13,142 - Misc. Expenditures 2,41,178 2,65,328 2,91,870 - Payment to DIMTS NA NA NA 12,00,600 13,20,200 14,53,600 Total Expenditure – In Rupees -- -- -- 75,03,796 49,68,736 53,93,960 Net Profit / Gain – In Rupees 12,00,600 13,20,200 14,53,600 -11,23,136 17,86,364 17,72,840
- 27. 27 Thank You!!