1. Investigating sustainable energy production opportunities in
Norway using system dynamics
Per Ivar Karstad, NTNU
Abstract
This paper investigates the use of system dynamics to evaluate sustainable energy production
opportunities in Norway to supply the European energy market. Sustainable energy
production been studied by development and use of a system dynamic model named CE2
(Climate-Energy-Economy). The model investigates the global energy system in a
regionalised model, where the impact of regional energy resources, climate change and
climate and energy policies can be studied. The energy system is currently characterised by
path dependence where positive feedback loops reinforces and lock-in to fossil based energy
supplies. To change path, the system would have to be locked in to a new renewable positive
feedback loop. The paper finds that there are significant value creation opportunities in such a
path shift for Norway related to development of offshore wind for the European market.
System dynamics as a tool has proved to be efficient in evaluation of these feedback loops in
the energy system.
Introduction
There is currently a strong focus on climate change globally. There is also a growing concern
about energy security in many energy-importing nations. This contributes to increased
demand for clean and secure energy supplies. Norwegian petroleum production has peaked,
and is now approaching a decline phase (NPD 2005), which eventually will create a need for
new business development and value creation in Norway to maintain the current welfare
level.
At the same time as the petroleum revenues decrease in Norway, the costs of the welfare
system in Norway will continue to increase as the share of the elderly population increase,
leaving an increasing economic burden on the working population (Sand, Schiefloe et al.
2005; Stortingsmelding 2009). Norway has to develop new industries capable of replacing the
petroleum revenues to secure the capacity to maintain the public welfare system in Norway
beyond the petroleum era.
The value of environmentally sustainable energy production is influenced by two main
elements; contribution of energy supplies to economic development and reduced cost of
climate change. Understanding the risk and uncertainty of energy supply interruptions and
climate change are important in order to estimate the potential threat to the future welfare.
This paper aims to identify options to close the future Norwegian value creation gap through
industrial development within sustainable energy production to secure European energy
supplies.
Energy resources and climate change
The Earthscan report, “Limits to Growth – the 30 year update” (2005) claims that the global
system is currently in an unsustainable situation, and that there are limits to growth on the
planet – limits on resources, food, environment, and to the population the Earth can support
1 Investigating sustainable energy production opportunities in Norway using system dynamics
Per Ivar Karstad
2. over time (Meadows, Randers et al. 2005). Meadows et al. (2005) concluded that the people
of the world have to act soon to establish a sustainable world. Without actions to create
sustainability, the global population will face enormous challenges in providing sufficient
goods, energy and food to a growing population (Meadows, Randers et al. 2005).
The energy markets in the last decade has been characterised by a substantial increase in
global energy demand, especially in China and India, caused by the strong economic growth
in these countries. At the same time it is observed that the capacity to deliver fossil energy
may be limited due to limited production capacity and lack of infrastructure development,
such as pipelines, refining and terminal capacities (Ruth 2005). Substantial investments in
production capacity and infrastructure are needed in many countries to secure necessary
access to energy (IEA 2004; IEA 2008b).
The Intergovernmental Panel of Climate Change (IPCC 2007a) has concluded that emission
of carbon dioxide to the atmosphere will change the future climate on earth and estimates the
atmospheric temperature to increase by 2o to 6o C by the year 2100, which is a tremendous
increase from the current average temperature of 17o C. The Stern review found that ignoring
climate change will damage economic growth, creating risks of major disruption of economic
and social activity later in this century and in the next, on a scale similar to those associated
with the great wars and the economic depression of the first half of the twentieth century
(2007). Stern recommends a mitigation investment strategy, where strong action is taken to
reduce emissions to avoid severe consequences in the future.
The energy market will probably face two major challenges in a 10–20 year perspective. The
oil and gas production will reach a point where it cannot meet demand. Secondly the concern
about climate damages caused by fossil fuel consumption may lead to incentives to promote
the use of renewable energy. The need for policies to reduce carbon dioxide emission
combined with the probability that oil and gas resources within a few decades cannot meet
energy demand, represent an opportunity for renewable energy production.
Defining sustainable energy production
Sustainable development is defined by the World Commission on Environment and
Development as “Development that meets the needs of the present without compromising the
ability of future generations to meet their needs” (Brundtland 1987).
Daly (1996) argues that economists and society should recognise that the economy is not
exempt from natural laws and that economy cannot be explained by natural laws either. Daly
views the economy as a subsystem of the ecosystem. Economic growth can be anti-economic
because the marginal physical throughput may cause environmental costs to increase faster
than production benefits, thereby making society poorer, not richer (Daly 1996). Sustainable
development would, according to Daly (1996), mean a change in the current economic norm
of economic growth towards qualitative improvement or development as the path of future
progress. This would mean a shift towards a steady-state economy where the aggregate
throughput of matter/energy is constant.
The thermodynamic law of entropy states that the energy and matter in the universe move
towards a less useful state where matter and energy become less useful. One example is fossil
fuels – when fossil fuels are burned to produce energy, the energy itself is not lost, but it is
very often turned from useful work to useless heat. The same is true for economies, which are
2 Investigating sustainable energy production opportunities in Norway using system dynamics
Per Ivar Karstad
3. limited by the availability and throughput of matter and energy (Georgescu-Roegen 1971;
Reynolds 1999; Daly and Farley 2004). The expansion of population and physical capital will
gradually force humanity to use an increasing share of the production output to cope with
constraints on environment and natural resources (Meadows, Randers et al. 2005).
Sustainable economic development can be seen as one of two possible paradigms. The first
paradigm is often seen as the weak sustainability position and assumes that almost all kinds
of natural capital can be substituted by man-made capital. The second paradigm, known as
strong sustainability position, assumes that many of the most fundamental services provided
by nature cannot be replaced by services produced by humans or man-made systems. In this
view, certain essential natural resources will be lost forever with no substitutes once they are
consumed, and the economy will decline as the resource output declines (Tilton 1996;
Reynolds 1999; Daly 2005; Ayres 2006). Daly (2005) argues that a strong sustainability
position will require a shift from economic growth, which is not sustainable, towards steady
state economic development, which presumably is sustainable.
In its report, “World Energy Outlook” for 2006 and 2008, IEA concludes that the world is not
on course for a sustainable energy future. In the baseline scenario, IEA finds that CO2
emissions will be almost two and a half times the current level by 2050. Increasing transport
demand will continue to increase the demand for oil, and the carbon intensity of the world’s
economy is expected to increase due to greater reliance on coal for power generation and
production of liquid transport fuels in developing countries with domestic coal resources (IEA
2006a; IEA 2008b). The most abundant unused energy source, on a short time scale, appears
to be coal for many of the large energy- consuming countries. Countries without adequate
local energy resources are vulnerable in terms of the security of energy supplies (Ediger,
Hosgör et al. 2007).
Jaccard (2005) argues that a sustainable energy system must have good prospects for enduring
indefinitely in terms of the type and level of energy services it provides while the production
and consumption of energy must not exceed the rate at which it can be absorbed by the
ecosystem. Jaccard (2005) found that a sustainable energy system will require the
development of renewable energy sources, higher energy efficiency, and zero emission fossil
fuels combined with a shift in end-use applications towards electricity and hydrogen as energy
carriers. Innovations and deployment of these technologies will originate in the most
developed economies, and will be driven by emerging market conditions and markets created
by government policies (Jaccard 2005; Nuttall and Manz 2008). To establish a sustainable
global development, with growth in population and living standards, it will be necessary to
develop sustainable energy production and improved energy efficiency.
Modelling the European energy system
Economic growth is the main driver of energy demand and the main cause of environmental
pollution. Achieving sustainable economic development will require a stronger coupling
between economic theory, natural resources and the capacity of the environment to recycle
pollution. The system dynamic model described here – the CE2 model - is based on the
standard neoclassical model, and expanded to include energy supply and climate impact.
Economic growth theories are based on the work by Solow and Swan which was published in
1956 (Solow 2000). This neoclassical growth theory analysed the role of physical capital
accumulation and discovered the importance of technological progress as the ultimate driving
force behind sustained economic growth. Paul Romer (1986) and Robert Lucas (1988)
3 Investigating sustainable energy production opportunities in Norway using system dynamics
Per Ivar Karstad
4. developed endogenous growth theories to further explain how innovation and human capital
contributed to technological progress (Aghion and Howitt 1998; Jones 2002; Thirlwall 2006).
Several models are developed for the energy system for different purposes. Most of these
models are based on linear programming and economic equilibrium. Institutions such as IEA
and IPCC use MARKAL and TIMER as the basis for their analysis of the future energy
market (Gether 2004; ETSAP 2008) while MESSAGE (Schrattenholzer, Miketa et al. 2004)
was used by IIASA to model future energy scenarios. Nordhaus and Boyer (2000) developed
the DICE and RICE models, which are equilibrium models for global and regional economic
development given different policy options. The system dynamic thinking and modelling in
this work is mainly based on three models:
WORLD3 (Meadows, Randers et al. 2005)
FREE (Fiddaman 1997)
EICOMP (Gether 2004).
Energy supplies are essential for utilisation of the industrial capital. A vehicle, for example,
needs energy to operate, and without energy, the value of the vehicle as a production tool is in
principle zero. The same applies for industrial capital. Economic growth since the industrial
revolution has been driven by utilising machines powered by fossil fuels as a substitute for
human and animal labour (Ayres 2001; Ayres and Warr 2005). The physical capital requires a
certain amount of energy to perform normal operations, and if this energy is not supplied, the
productivity of the capital will diminish. This can be described and modelled by substituting
capital in the standard growth equation with operating capital (Fiddaman 1997).
Depreciation of capital in the CE2 model consists of two elements; the normal depreciation of
capital due to normal wear and tear, and depreciation caused by climate change. Depreciation
due to climate change describes the amount of destruction and repair/replacement of capital
that are required due to damage caused by a changing climate.
Since capital and energy are complements, short-term elasticity between capital and energy
has to be low. However, it cannot be zero, because this would imply that demand would be
independent of price, and that consumption of other goods would be reduced, in principle to
zero, to maintain energy consumption. In the modelling of the coupled energy-economy-
climate system in this paper, it is assumed that the short-term substitution elasticity between
energy sources is bound to the type of capital. Short term substitution elasticity will therefore
be close to zero. The long-term elasticity is controlled by the replacement of capital with new
capital with different energy characteritics, and will be higher than the short-term elasticity
(Fiddaman 1997).
Neoclassical economic theory assumes that technological progress creates growth and that
resource consumption is a consequence, not a cause, of growth. Economic history shows that
the reality is more complex, where it often has been higher-grade energy resources and
higher-grade structural resources that have created growth, not just technology alone. The
standard economic assumptions and mathematical characteristics of the Cobb-Douglas
function implies that energy flows do not contribute much to aggregate productivity and
growth (Reynolds 1999; Ayres 2001). Ayres found, however, that the observed economic
growth in the USA could be explained almost entirely by substituting technological progress
and labour by electric power consumption in the growth equation (Ayres 2001; Ayres and
Warr 2005).
4 Investigating sustainable energy production opportunities in Norway using system dynamics
Per Ivar Karstad
5. Energy requirement can be modelled as a function of capital multiplied by the average energy
efficiency which is a function of changes in energy prices and changes in energy-efficiency
standards, rather than being autonomous (2006).
Some variables and assumptions in the models are difficult to validate or estimate due to
limited public data and are subject to large uncertainties. Given the uncertainties related to
future social, economic, political, and institutional changes, it is impossible to provide
accurate forecasts (Nordhaus and Boyer 2000). However, even if the models cannot provide
accurate forecasts due to these uncertainties they force us to reveal our assumptions about the
real world (Toth 1995; Fiddaman 1997). “We use the computer for its primary purpose – not
to predict what will result from current policies, but to ask what could happen if we make
various changes” (Meadows, Randers et al. 2005).
The emphasis in this paper is the long term energy supply. It is assumed that there is long-
term substitutability between all energy sources and carriers, depending on the end-user
attractiveness and energy availability (Gether 2004). Historically, this has not been the case,
particularly in the transport sector, but this is likely to change soon as a consequence of new
battery technologies (IEA 2008a).
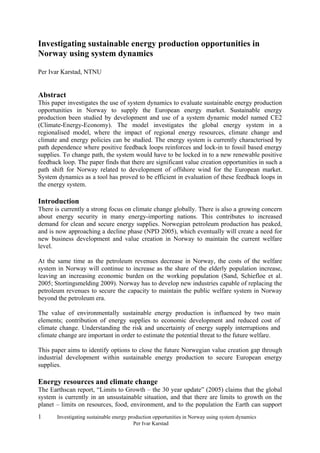
The subsystem diagram in figure 1 below illustrates the architecture of the CE2-model
developed and used in this paper. The CE2-model is divided into five regions; Norway, EU,
Asia-Pacific, North-America and Rest-of-world. Norway is small compared with the other
regions, and could be modelled as part of the European (EU) region, but has been treated as a
separate region due to the focus of this work. The modelled development in the European
energy market is the basis for the valuations in this work. It could be useful to split Rest-of-
world into several regions, with Russia, the Middle East and North Africa of particular
interest due to their energy resources and geopolitical position.
5 Investigating sustainable energy production opportunities in Norway using system dynamics
Per Ivar Karstad
6. Figure 1: Main architecture of the CE2 model
The effect of path dependence and lock-ins, caused by long lead times, is a major challenge
related to creating shifts in the energy system. This is mainly a consequence of previous
investments in production capital and infrastructure with a rather long lifetime, typically 25 to
50 years. These facilities represent sunk cost and are unlikely to be abandoned unless there
are dramatic changes in the world, such as war and catastrophic events that destroy the capital
and open the way for new types of energy capital. Path dependence is caused by dominating
positive feedback processes in the system working as growth engines, which creates lock-ins
to fossil fuels because it is difficult to break out of these positive feedback processes (Sterman
2000). The feedback structure of the model determines its dynamics, and efficient policies
would have to change the dominant feedback loops of the model, to shift from one dominant
feedback loop (R1) to another (R2) (Sterman 2000), such as from fossil to renewable energy
supplies as illustrated in figure 2 below.
6 Investigating sustainable energy production opportunities in Norway using system dynamics
Per Ivar Karstad
7. Decreasing
Renewable marginal cost
subsidies Renewable Energy R4 +
investments
Renewable Renewable Energy
Energy price production
R2 +
+ Energy Energy Production
price Demand Output
R3 R1
Increasing
Fossil
Energy
+ marginal cost
price Fossil Energy
-
- - B2 production
Fossil Energy
CO2 investments
price
- B1
Climate Change CO2 emissions
concern
Figure 2: Causal loop diagram
To simplify, it is assumed that an economy in principle produces two types of output; goods
and energy. The total output is equal to the sum of production output and energy output. The
inputs to production of both goods and energy are capital, labour and energy. The capital and
energy input have to be taken from the total output. The output of goods can be used for three
purposes; investment in capital for goods production, investment in capital for energy
production, and/or consumption.
Both Fiddaman (1997) and Gether (2004) modelled the demand for different energy sources
based on changes in capital stocks and associated demand for each energy carrier. Gether
(2004) modelled the demand side from households, transport and industry in detail to identify
change in demand for different energy carriers. Since the lifetime of the energy-consuming
goods is quite similar to the lifetime of the energy production and distribution infrastructure,
the change towards a sustainable energy system is likely to be equally limited by the energy
production capital replacement rate as by the end-user capital replacement rate. It is likely that
the energy infrastructure will be increasingly electrified, as will transportation, and in the long
run a high degree of substitution between energy sources and carriers is expected. Energy
demand is therefore linked to the production capital in the long run, which defines end-user
energy consumption.
The behaviour of the energy system is influenced by the evolution of technology, where
small, early decisions might have great impact due to positive feedbacks that create path
dependence and lock-ins (Fiddaman 1997). In the CE2-model, it is assumed that costs decline
as industries gain experience. These learning curves describe the technological progress as a
function of accumulated experience with the production and the use of a technology assuming
20 % productivity improvement for each doubling of cumulative investments (Löschel 2002).
7 Investigating sustainable energy production opportunities in Norway using system dynamics
Per Ivar Karstad
8. While technology improvements will have a cost-reducing effect on scale economies,
depletion and saturation will increase costs in the energy sector (Fiddaman 1997; Gether
2004). As energy resources become scarcer a significant cost increase will be experienced
because an increasing amount of capital and labour will be required to produce each unit of
energy supply.
The CE2-model includes four different renewable energy sources; hydro power, onshore
wind, offshore wind and solar power. The commercial potential of these energy sources will
depend on three major factors; energy price including CO2 tax, subsidies and learning curves.
The CE2-model is calibrated and initialised to year 2000 unit costs and production capacity.
Fossil-fuel production is in principle modelled the same way as renewable energy production,
where learning curves and capital accumulation represent the main factors that determine
production capacity. A more complete system dynamic model of the petroleum life cycle has
been developed by Davidsen et al (1990). Their model is capable of modelling the behaviour
of the US demand and supply of crude oil through the history of petroleum production and
represents a good basis for understanding how petroleum resources are brought to the market
through exploration, development and production. On the other hand, Tao and Li (2007) used
a very simple system dynamic model to investigate the future peak in China’s oil production,
and demonstrated how simple analysis of specific and important issues can be done by use of
system dynamics.
The CE2-model includes four different non-renewable fuels; oil, gas, coal and nuclear. In
addition to fuel production capacity, the model includes import and export capacity of fuels,
and a separate sub-model for transforming primary energy into end-user consumable energy
such as electricity. The fuels are delivered to the power generation facility, where capacity is
determined by capital and learning curves, to generate end- user energy, normally in the form
of electricity. Power generation has an energy loss of 50 % to 70 % which is removed from
the stream while the remaining energy flow is delivered to the consumer (Gether 2004).
Climate change leads to a modelled estimate of atmosphere and ocean temperature based on
the concentration of CO2 in the atmosphere. The climate change model used in the CE2-model
is based on IPCC (2007a) and include ocean temperature as modelled by Fiddaman (1997).
The intention is to be able to include the important flux of CO2 from ocean to atmosphere
caused by increasing ocean temperature in the carbon cycle. The rate of ocean warming can
be determined by the temperature difference and heat capacity of the atmosphere and the
ocean.
The main principle for climate impact used by Fiddaman (1997) has been used. This principle
assumes that the climate impact is a function of the difference between the actual temperature
and the temperature to which society has adapted (Fiddaman 1997). An adaptation time of
100 years has been assumed. This is probably too long, based on two arguments. First, in a
situation with severe climate change, there will be no options other than to adapt as soon as
possible, which would mean as soon as the society is capable of replacing damaged capital
goods and restoring productivity. Second, because all capital goods are replaced within a
certain timeframe, usually 40 to 50 years, it is in principle possible to adapt to all changes
within this timeframe.
8 Investigating sustainable energy production opportunities in Norway using system dynamics
Per Ivar Karstad
9. Developments in the future energy market
The uncertainty in energy supplies is mainly influenced by three factors; the fossil energy
resources available, the rate of energy investments and energy learning curves. The
uncertainty in remaining energy resources used here is as described in Table 1. The learning
curves are assumed to have an expected level of 20 % improvement for each doubling of
capacity with a low estimate of 10 % and a high estimate of 30 %.
Table 1: Remaining fossil energy resource estimates
Low Medium High
Oil (bill bbl) 1700 2600 3800
Gas (TCM) 185 240 305
Coal (bill Ton) 900 1100 1300
Uncertainty in the climate system is mainly related to three factors; the carbon cycle, climate
change due to increasing CO2 concentration and the impact of climate change. The uncertainty
in the carbon cycle is mainly related to the changes in the equilibrium between atmosphere
and ocean which potentially could slow down the net flux of CO2 to the ocean as the ocean
warms. The uncertainties related to climate change caused by increasing CO2 concentration
are based on IPCC (2007a) estimates. The impact of climate change is based on estimates
from IPCC (2007a) and Nordhaus and Boyer (2000).
Energy Related CO2 emissions
70
60
50
tC 2/year
40
G O
30
20
10
0
2000 2020 2040 2060 2080 2100
10 % 50 % 90 % IEA IPCC
Figure 3: Energy related CO2 emissions from IEA, IPCC and this work
This paper finds that the simulated energy-related CO2 emissions will increase in the next two
decades as illustrated in figure 3. Then it will gradually decrease as a consequence of limited
availability of fossil-fuel resources leading to a CO2 concentration between 600 and 750 ppm
in 2100, with a temperature at 2.8oC above pre-industrial temperature. The high and low
estimates are 3.8oC and 1.8oC respectively. The latest resource estimates from IEA (2008b)
would lead to slightly higher levels of emissions and climate change than those estimated here
9 Investigating sustainable energy production opportunities in Norway using system dynamics
Per Ivar Karstad
10. assuming that humankind will consume all available fossil fuels without applying CCS.
Reproducing the emissions scenario presented by IPCC (2007a) requires resource estimates
three times higher than those used in this paper.
The associated climate cost in Europe is estimated to be between 1 % and 11 % of GDP at the
end of the century with an average of 5.3 %, but still increasing as illustrated in figure 4. The
sea level is expected to rise by approximately 0.6 metres, but with an initiated increase
towards an equilibrium level of 6 to 7 metres. The atmospheric warming due to increased CO2
concentration will contribute to a substantial heating of the oceans, resulting in a major CO2
flux from the oceans to the atmosphere, which might cause more heating of the atmosphere in
the long term than anthropogenic CO2 emissions. It is likely that a temperature increase above
the P50 estimate will cause severe negative impact on food production in the next century
unless technological progress contributes to a major shift in productivity of food and water
security.
Climate Cost in Europe
12
10
8
%o G P
10%(Europe)
f D
6 50%(Europe)
90%(Europe)
4
2
0
2000 2020 2040 2060 2080 2100
Figure 4: European climate cost as a fraction of GDP
As in the FREE model by Fiddaman (1997), the CE2-model treats all generations equally
(Fiddaman 1997). Future generations are likely to become much richer than current
generations, and the impact of energy security and climate change on their welfare seems
relatively unimportant, except for the developing world and the Asia-Pacific region where
high energy import costs combined with low per capita purchasing power will reduce per
capita goods consumption substantially in the first couple of decades after peak petroleum.
For the developed world, the consequence is mainly a marginal reduction in per capita goods
consumption due to an increased cost of energy. However, the consequences of climate
change on the environment in general are likely to be challenging for many European citizens.
The peak in global oil production is as illustrated in figure 5 expected to occur between 2010
and 2025, and in global gas production between 2035 and 2045. The shift in energy prices
does not occur until gas production starts to decline, indicating an efficient substitution
between oil and gas as the peak in oil production occurs.
10 Investigating sustainable energy production opportunities in Norway using system dynamics
Per Ivar Karstad
11. World Energy Production
120000
100000
80000
TWh/year
60000
40000
20000
0
2000 2010 2020 2030 2040 2050 2060 2070 2080 2090 2100
10%(Oil Fuel) 10%(Gas Fuel) 10%(Coal Fuel)
50%(Oil Fuel) 50%(Gas Fuel) 50%(Coal Fuel)
90%(Oil Fuel) 90%(Gas Fuel) 90%(Coal Fuel)
10% (renewable) 50% (renewable) 90% (renewable)
Figure 5: World energy production from CE2 model
A climate policy as modelled in this paper will benefit most of the world in terms of reduced
climate costs and increased long-term energy security due to accelerated development of
renewable energy. The scenarios modelled show substantial growth in renewable energy
production and particularly offshore wind production in Europe. Nations with substantial coal
resources will, in the case of a CO2 tax, utilise these resources in combination with CCS,
while the remaining nations will expand their renewable capacity. The lift in CCS capacity in
Europe and Asia-Pacific is mainly caused by faster learning and technology transfer between
nations. The major growth in renewable energy production is basically as solar power in “Rest
of World” and Asia-Pacific and as offshore wind in Europe (figure 6).
TW h/yr
40,000
Global Renewable Delivery
30,000
Hydro Powe r
O nshore W ind
20,000
O ffshore W ind
Solar Po we r
10,000
0
01 Jan 2000 01 Jan 2020 01 Jan 2040 01 Ja n 2060 01 Jan 2080
Figure 6: Renewable energy supplies in the Global Cooperation scenario
The CE2-model shows that the most efficient way to reduce CO2 emissions is by use of a CO2
tax that is used to subsidise renewable energy and CCS. The CE2-model indicates that
reinvesting this tax can make CCS viable at a relatively low tax, while a higher CO2 tax will
realise energy efficiency measures and more renewable energy.
11 Investigating sustainable energy production opportunities in Norway using system dynamics
Per Ivar Karstad
12. Global CO2 reductions due to pure CO2 tax Global CO2 reductions due to recycled CO2 tax
1400 1400
1200 1200
1000 1000
Bill Ton
Bill Ton
800 800
600 600
400 400
200 200
0 0
0 100 200 300 400 0 100 200 300 400
CO2 tax ($/ton) CO2 tax ($/ton)
Total CO2 reductions CCS removal Total CO2 reductions CCS removal
Figure 7: Effect of global CO2 tax on CO2 reductions
The modelled development in energy prices in Europe indicate, for all scenarios, a steady
increase toward a price level of 0.4 $/KWh in the middle of the century. The increase is
caused by a tighter fossil fuel market due to resource limitations, until it stabilises as
renewable energy production becomes attractive substitutes to fossil energy sources. The
decline in the later part of the century is due to energy efficiency improvements and cost
improvements in renewable energy production.
European Energy Price
0.6
0.5
0.4
$/KWh
0.3
0.2
0.1
0
2000 2010 2020 2030 2040 2050 2060 2070 2080 2090 2100
Reference Case Europe Business as Usual Europe
Nationalisation Europe Global Cooperation Europe
Figure 8: Development in European energy prices in different scenarios
Climate policies lead to accelerated implementation of renewable energy, and deferral of coal
consumption. It is found that efficient climate policies or renewable energy policies will
reduce the economic shock of peak petroleum, and give a smoother transition towards a more
sustainable energy system.
12 Investigating sustainable energy production opportunities in Norway using system dynamics
Per Ivar Karstad
13. Overcoming path dependence and lock-ins in the energy system
The challenge for Norway seems to be that climate change policies will lead to reduced
Norwegian value creation from fossil based energy production. On the other hand, climate
policies and the European energy security situation create opportunities within renewable
energy production and CCS. Norway may increase value creation by finding ways to move
down the learning curve faster than its competitors in these industries. The market for
renewable energy will be growing in the world, in particular for solar energy and in Europe
for wind energy. However, carbon capture and storage is expected to be the dominant source
of emission reductions in the 21’Th century in nations with abundant coal resources such as
China and North America given efficient climate policies. The Norwegian challenge is to
improve Norwegian value creation in a climate mitigation policy scenario by a strategic effort
in renewable energy production i.e. going from causal loop R1 to R2.
1.5
Offshore Wind
2c ost
o CO
t due t
Cos t shif
Energy Price
Solar Gas Oil
Power
0
0% 10 % 20 % 30 % 40 % 50 % 60 %
Marginal Cost Curve With CO2 cost
Figure 9: Marginal cost of energy production
The Norwegian industry is recognised for its position in offshore technology for oil and gas
production and in particular subsea technologies, its ability to run large-scale projects, the
highly developed energy distribution infrastructure and offshore CO2 storage (Gotaas 2008).
In Norway there is strong government support for carbon capture and storage
(Stortingsmelding 2005), very limited support for new renewable energy production
(Stortingsmelding 2006) and limited reinvestment of CO2 tax (Randers, Arnstad et al. 2006).
The current situation in Norway may look as if the Norwegian oil industry, supported by the
government, is building defences against the threat of renewable energy through strong
support for the development of carbon capture and storage as the solution to the climate
problem.
Norway is in a unique position, with large oil, gas and offshore wind resources, a strong
financial position, high competence in offshore CO2 storage, offshore technology and
electricity distribution. On the other hand, Norway has challenges with respect to market
access and political priorities. On CO2 capture, Norwegian industry seems to have experience
in use of the technology but limited experience in construction and fabrication of the process
facilities.
13 Investigating sustainable energy production opportunities in Norway using system dynamics
Per Ivar Karstad
14. A large-scale development of offshore wind energy would benefit from utilisation of the
synergies by using Norwegian hydro power capacity as a swing producer to be able to deliver
electricity according to demand in the European market. This would require a strong
collaboration between several players in Norway to be able to coordinate the development of
offshore wind production capacity, hydro power output, and domestic electricity distribution
capacity and export capacity to the European market.
Carbon capture will have limited volume potential in Norway. The main markets seem to be
in the Asia-Pacific and North America. The market in Europe can be expected to grow to
approximately 500 million tons per year, requiring investments of approximately $ 2 billion
per year in capacity build-up. The Norwegian industry can potentially compete on more
specific parts of these facilities, and Norway may offer a storage solution in the Norwegian
North Sea basin. The simulations using the CE2-model indicate that the potential cash flow
related to European carbon dioxide storage could be up to $15–25 billion per year based on a
cost of $ 90 per ton of CO2.
Offshore wind energy in Norway has an enormous energy potential, ranging from 3000 to
14000 TWh per year with an additional potential on the UK continental shelf of 3200 TWh
per year (ENOVA 2007; Monbiot 2007). The current global electricity consumption is
approximately 15,000 TWh per year (IEA 2007), which should lead to the conclusion that
providing renewable energy supplies to Europe is not limited by the resource potential, but by
other factors. There are a lot of risk factors such as cost, capital availability and technological
maturity. However, based on the author’s observations of recent experiences related to an
initiative to launch a national project on offshore wind energy in Norway, the main obstacle
seems to be political willingness.
Dedicated financial support for offshore wind power in Norway will have a significant effect
on the learning curve, and move the technology from being less attractive than the onshore
renewable energies to being more attractive and cost efficient. In a scenario where the
Norwegian government invests in offshore wind power, Norway becomes a leader in the
market due to the high domestic resource potential and development. Government
investments in offshore wind power in Norway will accelerate learning and the
implementation of offshore wind power in Europe due to technology transfer, and further
enhancing the market for offshore wind power. Substantial export of energy from Norway to
Europe will have a significant impact on European energy prices and benefit both Norway
and Europe.
The Norwegian competitive position in these industries will depend on Norwegian policies to
develop a competitive industry, and cooperation with Europe to develop Norwegian energy
production as a reliable contributor to the European energy supply.
Due to the limited domestic market, CCS is not a technology where Norway can maintain a
leading position to create value in Norway, although Norwegian companies might become
leaders in the international CCS market. There is a large potential for value creation in
offshore wind power, if Norway succeeds in establishing competitive advantages within this
industry. To become a successful business, CCS depends on a carbon price being charged.
Renewable energy may become competitive either if a carbon price is introduced or if the
margins improve due to higher energy prices or lower costs. CCS might be an important
technology to allow for the continued use of fossil fuel without severe negative climate
14 Investigating sustainable energy production opportunities in Norway using system dynamics
Per Ivar Karstad
15. impact. It is difficult to see that CCS can play a significant role in future value creation for
Norway. Offshore wind power, however, has the potential to become a major industry in
Norway comparable to the current oil and gas industry.
The transition towards a sustainable energy system in Norway and in Europe is an opportunity
for industrial development to secure welfare for future generations in Norway. This
opportunity can potentially be developed as a major export industry aiming to supply the
European market, given the right incentives and support from the Norwegian government.
The energy future can be created but will require visions to guide the path to the future. The
society will only realise a sustainable energy future if it decide to get there (Hamel and
Prahalad 1994).
Conclusion
The use of system dynamic thinking and modelling has proved to be a useful tool to
understand and investigate path dependencies and lock-ins in the energy system. Developing
efficient policies to shift the energy system from lock-in to fossil fuelled energy supplies to
lock-in to renewable energy supplies require a dynamic view of the global energy system.
The threat of “peak petroleum” is significant and could lead to economic recession for several
decades unless the world prepares for a smooth transition to renewable energy. Norwegian oil
production has passed the peak. Norway needs to develop industries that can replace the value
creation from the oil and gas production within a few decades to maintain the current welfare
level. Offshore wind is one attractive option capable of generating such values. However, this
will require a path shift from locked in fossil fuel production toward a lock-in to renewable
energy production.
Increasing scarcity of natural resources such as oil, gas and water might lead to increasing
geopolitical tension and armed conflicts leading to difficulties in maintaining sufficient
investments in fossil based energy production and infrastructure in the energy-rich regions.
This will lead to increased energy prices and increasing value of renewable energy production
which may change the path of the energy system.
The potential value creation in offshore wind power on the Norwegian Continental Shelf is
significant, and can increase accumulated GDP by more than 10 % by the year 2100 given
that Norway acts early to create competitive advantages towards European industries. CCS
will at best be a zero-sum game for Norway, although it may be an important technology for
the world to allow for the continued use of fossil fuels without large impacts on climate. The
current situation, with limited fossil fuel resources, should call for increased focus on energy
saving and energy efficiency rather than wasting limited energy resources on carbon capture
and storage.
Norway can develop the offshore wind power industry into a business capable of replacing
the declining value creation from the Norwegian oil and gas industry. This will require stable
policies and instruments such as:
- Include the environmental costs of CO2 emissions in the cost of energy and products
through a carbon tax of $90/ton (Internalise externalities).
- Recycle carbon tax back to new renewable energy investments.
- Increased public spending on renewable R&D
15 Investigating sustainable energy production opportunities in Norway using system dynamics
Per Ivar Karstad
16. To develop a sustainable energy system, governments have to decide to leave a healthy
environment for future generations, and put words into action.
References
Aghion, P. and P. Howitt (1998). Endogenous Growth Theory, The MIT press.
Ayres, R. U. (2001). "The minimum complexity of endogenous growth models: the role of
physical resource flows " ENERGY 26: 817-838.
Ayres, R. U. (2006). "On the practical limits to substitution " ECOLOGICAL ECONOMICS
61: 115-128.
Ayres, R. U. and B. Warr (2005). "Accounting for growth: the role of physical work "
Structural Change and Economic Dynamics 16: 181-209.
Brundtland, G. H. (1987). Our Common Future. Oxford, Oxford University Press.
Daly, H. E. (1996). Beyond Growth. Boston, MA, Beacon Press.
Daly, H. E. (2005). "Economics in a full world." Scientific American: 78-85.
Daly, H. E. and J. Farley (2004). Ecological Economics. Washington DC, Island Press.
Davidsen, P. I., J. D. Sterman, et al. (1990). "A petroleum life cyckle model for the United
States with endogenous technology, exploration, recovery and demand." System
Dynamics Review 6(1): 66-93.
Ediger, V. S., E. Hosgör, et al. (2007). "Fossil fuel sustainability index: An application of
resource management." Energy Policy 35: 2969-2977.
ENOVA (2007). Potensialstudie av havenergi i Norge. Trondheim, ENOVA SF.
ETSAP. (2008). "Energy Technology Systems Analysis Programe." from www.etsap.org.
Fiddaman, T. S. (1997). Feedback Complexity in Integrated Climate-Economy Models.
Department of Operations Management and System Dynamics. Massachusets,
Massachusets Institute of Technology. PhD.
Georgescu-Roegen, N. (1971). The Entropy Law and the Economic Process. Cambridge, MA,
Harvard University Press.
Gether, K. (2004). Transition to large scale use of hydrogen and sustainable energy services.
Department of Energy and Process Engineering. Trondheim, Norwegian University of
Science and Technology. PhD.
Gotaas, S. (2008). Energi21 - en samlende FoU strategi for energisektoren.
Hamel, G. and C. K. Prahalad (1994). Competing for the future, Harvard Business School
Press.
IEA (2004). World Energy Outlook, International Energy Agency.
IEA (2006a). Energy Technology Perspectives - Scenarios & Strategies to 2050, International
Energy Agency.
IEA (2007). World Energy Outlook 2007, OECD/IEA.
IEA (2008a). Energy Technology Perspectives - Scenarios & Strategies to 2050, International
Energy Agency.
IEA (2008b). World Energy Outlook 2008. I. E. Agency.
IPCC (2007a). Climate Change 2007 - The Physical Science Basis. Cambridge, Cambridge
University Press for the Intergovernmental Panel Of Climate Change.
Jaccard, M. (2005). Sustainable Fossil Fuels. Cambridge, Cambridge University Press.
Jones, C. I. (2002). Economic Growth. London, W.W.Norton & Company Ltd.
Löschel, A. (2002). "Technological change in economic models of environmental policy: a
survey " Ecological Economics 43: 105-126.
16 Investigating sustainable energy production opportunities in Norway using system dynamics
Per Ivar Karstad
17. Meadows, D., J. Randers, et al. (2005). Limits to Growth - the 30 year update, Earthscan.
Monbiot, G. (2007). HEAT - How to stop the planet from burning. Cambridge, MA, South
End Press.
Newell, R. G., A. B. Jaffe, et al. (2006). "The effects of economic and policy incentives on
carbon mitigation technologies." Energy Economics 28: 563-578.
Nordhaus, W. D. and J. Boyer (2000). Warming the world – Economic models of Global
Warming, The MIT Press.
NPD (2005). Total Petroleum Production 1970-2030. Stavanger, NPD - Norwegian Petroleum
Directorate: Total Petroleum Production on the Norwegian Continental Shelf 1970-
2030.
Nuttall, W. J. and D. L. Manz (2008). "A new energy security paradigm for the twenty-first
century " Technological Forecasting and Social Change.
Randers, J., E. Arnstad, et al. (2006). Et Klimavennlig Norge.
Reynolds, D. B. (1999). "Entropy and diminishing elasticity of substitution " Resources
Policy
25: 51-58.
Ruth, S. (2005). A global sense of energy insecurity, CERA.
Sand, G., M. Schiefloe, et al. (2005). Norge 2020, Fagbokforlaget.
Schrattenholzer, L., A. Miketa, et al. (2004). Achieving a sustainable global energy system,
Edward Elgar Publishing, Inc.
Solow, R. M. (2000). Growth Theory - An Exposition. Oxford, Oxford university Press.
Sterman, J. D. (2000). Business Dynamics - Systems Thinking and Modeling for a Complex
World, The McGraw-Hill Companies Inc.
Stern, N. (2007). The economics of climate change: The Stern Review, Cambridge University
Press.
Stortingsmelding (2005). Stortingsmelding nr 21: Regjeringens Miljøvernpolitikk og rikets
miljøtilstand. N. M. o. Environment.
Stortingsmelding (2006). Stortingsmelding nr 11: Om støtteordningen for
elektrisitetsproduksjon fra fornybare energikilder. N. M. o. P. a. Energy.
Stortingsmelding (2009). Stortingsmelding nr 9: Perspektivmeldingen 2009. N. M. o. Finance.
Tao, Z. and M. Li (2007). "System dynamics model of Hubbert Peak for China's oil." Energy
Policy 35: 2281-2286.
Thirlwall, A. P. (2006). Growth & Development. New York, Palgrave MacMillan.
Tilton, J. E. (1996). "Exhaustible resources and sustainable deveJopment, two different
paradigms." Resources Policy 22: 91-97.
Toth, F. L. (1995). "Practice and progress in integrated assessments of climate change."
Energy Policy 23: 253-268.
17 Investigating sustainable energy production opportunities in Norway using system dynamics
Per Ivar Karstad