
Empfohlen
Empfohlen
Weitere ähnliche Inhalte
Was ist angesagt?
Was ist angesagt? (8)
Andere mochten auch
Ähnlich wie Gdp
Ähnlich wie Gdp (20)
Gdp
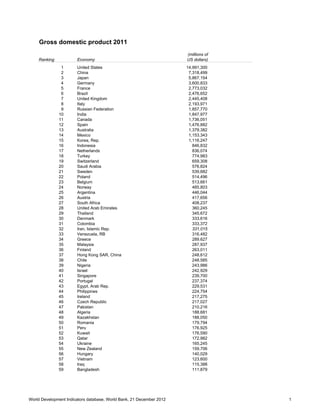
- 1. Gross domestic product 2011 (millions of Ranking Economy US dollars) 1 United States 14,991,300 2 China 7,318,499 3 Japan 5,867,154 4 Germany 3,600,833 5 France 2,773,032 6 Brazil 2,476,652 7 United Kingdom 2,445,408 8 Italy 2,193,971 9 Russian Federation 1,857,770 10 India 1,847,977 11 Canada 1,736,051 12 Spain 1,476,882 13 Australia 1,379,382 14 Mexico 1,153,343 15 Korea, Rep. 1,116,247 16 Indonesia 846,832 17 Netherlands 836,074 18 Turkey 774,983 19 Switzerland 659,308 20 Saudi Arabia 576,824 21 Sweden 539,682 22 Poland 514,496 23 Belgium 513,661 24 Norway 485,803 25 Argentina 446,044 26 Austria 417,656 27 South Africa 408,237 28 United Arab Emirates 360,245 29 Thailand 345,672 30 Denmark 333,616 31 Colombia 333,372 32 Iran, Islamic Rep. 331,015 33 Venezuela, RB 316,482 34 Greece 289,627 35 Malaysia 287,937 36 Finland 263,011 37 Hong Kong SAR, China 248,612 38 Chile 248,585 39 Nigeria 243,986 40 Israel 242,929 41 Singapore 239,700 42 Portugal 237,374 43 Egypt, Arab Rep. 229,531 44 Philippines 224,754 45 Ireland 217,275 46 Czech Republic 217,027 47 Pakistan 210,216 48 Algeria 188,681 49 Kazakhstan 188,050 50 Romania 179,794 51 Peru 176,925 52 Kuwait 176,590 53 Qatar 172,982 54 Ukraine 165,245 55 New Zealand 159,706 56 Hungary 140,029 57 Vietnam 123,600 58 Iraq 115,388 59 Bangladesh 111,879 World Development Indicators database, World Bank, 21 December 2012 1
- 2. Gross domestic product 2011 (millions of Ranking Economy US dollars) 60 Angola 104,332 61 Morocco 100,221 a 62 Puerto Rico 96,261 63 Slovak Republic 95,994 64 Oman 71,782 65 Ecuador 65,945 66 Sudan 64,053 b 67 Azerbaijan 63,404 68 Croatia 62,493 69 Libya 62,360 70 Luxembourg 59,201 71 Sri Lanka 59,172 72 Syrian Arab Republic 59,147 73 Dominican Republic 55,611 74 Belarus 55,132 75 Bulgaria 53,514 76 Slovenia 49,539 77 Guatemala 46,900 78 Uruguay 46,710 79 Tunisia 45,864 80 Serbia 45,820 81 Uzbekistan 45,359 82 Lithuania 42,725 83 Costa Rica 40,870 84 Lebanon 40,094 85 Ghana 39,200 86 Macao SAR, China 36,428 87 Yemen, Rep. 33,758 88 Kenya 33,621 89 Ethiopia 30,247 90 Jordan 28,840 91 Latvia 28,252 92 Turkmenistan 28,062 93 Panama 26,778 94 Cameroon 25,236 95 Cyprus 24,690 c 96 Côte d'Ivoire 24,074 97 Bolivia 23,949 98 Tanzania 23,874 d 99 Paraguay 23,837 100 El Salvador 23,054 101 Bahrain 22,945 102 Trinidad and Tobago 22,483 103 Estonia 22,155 104 Equatorial Guinea 19,790 105 Zambia 19,206 106 Afghanistan 19,177 107 South Sudan 19,172 108 Nepal 18,884 109 Bosnia and Herzegovina 18,088 110 Honduras 17,427 111 Botswana 17,328 112 Gabon 17,052 113 Uganda 16,810 114 Brunei Darussalam 16,360 115 Congo, Dem. Rep. 15,654 116 Jamaica 14,439 117 Congo, Rep. 14,426 118 Georgia 14,367 e World Development Indicators database, World Bank, 21 December 2012 2
- 3. Gross domestic product 2011 (millions of Ranking Economy US dollars) 119 Senegal 14,291 120 Iceland 14,026 121 Albania 12,960 122 Papua New Guinea 12,937 123 Cambodia 12,830 124 Mozambique 12,798 125 Namibia 12,301 126 Mauritius 11,260 127 Mali 10,590 128 Armenia 10,248 129 Burkina Faso 10,187 130 Macedonia, FYR 10,165 131 Madagascar 9,912 132 Zimbabwe 9,656 133 Chad 9,486 134 Nicaragua 9,317 135 Malta 8,887 136 Mongolia 8,761 137 Lao PDR 8,298 138 Bahamas, The 7,788 139 Haiti 7,346 140 Benin 7,295 141 Moldova 7,000 f 142 Tajikistan 6,522 143 Kosovo 6,453 144 Rwanda 6,375 145 Monaco 6,109 146 Niger 6,017 147 Kyrgyz Republic 5,919 148 Bermuda 5,765 149 Malawi 5,621 150 Guinea 5,089 151 Liechtenstein 4,826 152 Montenegro 4,496 153 Suriname 4,351 154 Mauritania 4,076 155 Swaziland 3,978 156 Fiji 3,818 157 Barbados 3,685 158 Togo 3,620 159 Eritrea 2,609 160 Guyana 2,577 161 Lesotho 2,426 162 Burundi 2,326 163 Sierra Leone 2,243 164 Faeroe Islands 2,198 165 Central African Republic 2,195 166 Maldives 2,050 167 Cape Verde 1,901 168 Bhutan 1,732 169 Liberia 1,545 170 Belize 1,448 171 Greenland 1,268 172 St. Lucia 1,259 173 Antigua and Barbuda 1,118 174 Timor-Leste 1,054 175 Djibouti 1,049 176 Seychelles 1,007 177 Guinea-Bissau 973 World Development Indicators database, World Bank, 21 December 2012 3
- 4. Gross domestic product 2011 (millions of Ranking Economy US dollars) 178 Gambia, The 898 179 Solomon Islands 838 180 Grenada 816 181 Vanuatu 760 182 St. Kitts and Nevis 697 183 St. Vincent and the Grenadines 688 184 Samoa 641 185 Comoros 610 186 Dominica 484 187 Tonga 434 188 Micronesia, Fed. Sts. 310 189 São Tomé and Principe 248 190 Marshall Islands 174 191 Kiribati 167 192 Palau 166 193 Tuvalu 36 American Samoa .. Andorra .. Aruba .. Cayman Islands .. Channel Islands .. Cuba .. Curaçao .. French Polynesia .. Guam .. Isle of Man .. Korea, Dem. Rep. .. Myanmar .. New Caledonia .. Northern Mariana Islands .. San Marino .. Sint Maarten (Dutch part) .. Somalia .. St. Martin (French part) .. Turks and Caicos Islands .. Virgin Islands (U.S.) .. West Bank and Gaza .. World 69,981,922 Low income 472,769 Middle income 23,004,815 Lower middle income 4,767,991 Upper middle income 18,235,067 Low & middle income 23,504,452 East Asia & Pacific 9,313,016 Europe & Central Asia 3,624,327 Latin America & Caribbean 5,646,122 Middle East & North Africa 1,201,718 South Asia 2,271,088 Sub-Saharan Africa 1,263,304 High income 46,606,101 Euro area 13,079,862 .. Not available. Note: Rankings include only those economies with confirmed GDP estimates. Figures in italics are for 2010 or 2009. a. Includes Former Spanish Sahara. b. Includes South Sudan. c. Data are for the area controlled by the government of the Republic of Cyprus. d. Covers mainland Tanzania only. e. Excludes Abkhazia and South Ossetia. f. Excludes Transnistria. World Development Indicators database, World Bank, 21 December 2012 4