SlideShare a Scribd company logo
1 of 26
119


Paper

F5
                   Answers to exAmPles


Chapter 1
Answer to Example 1
                                          $ p.u.
Material (3kg × $4)                           12
Labour (4hrs × $2)                             8
                                              14
Overheads ($700,000 ÷ 50,000)
                                            $34


Answer to Example 2
                                 $700,000
Total overheads
Total labour hours
   Desks (30,000 × 4hr)           120,000
                                   20,000
   Chairs (20,000 × 1 hr)
                                  140,000hrs

                                        $700,000
Overhead absorption rate:                              = $5 per hour
                                       140,000 hr
Costs cards:

                                  Desks                     Chairs
Materials (3kg × $4)                 12        (2kg × $4)        8
Labour (4hrs × $2)                    8        (1hr × $2)        2
                                     20                          5
Overheads (4kg × $5)                           (1hr × $5)
                                    $40                        $15


Answer to Example 3
                            Total   Assembly Finishing
Total overheads:
   Supervisors              100,000    60,000   40,000
   Other                    600,000   240,000  360,000
   (40:60)
                            $700,000      $300,000     $400,000

Total hours:
   Desks (30,000 × 3kg; 30,000 × 1 hr)                 90,000        30,000
                                                       10,000        10,000
   Chairs (20,000 × ½ hr; 20,000 × ½hr)
                                                      100,000 hrs    40,000 hrs
O.A.R                                                $3 per hr    $10 per hr
120 December 2008 examinations
     PaPer F2

    Cost cards:

                                             desk                               chair
       Materials                                 12                                     8
       Labour                                     8                                     2
       Overheads:                                                                      80
                      Assembly       9                              1.50
                                    10                              5.00
                      Finishing
                                                 19                                6.50
                                                $39                              $16.50


    Answer to Example 4
                                  Total      Processing        Packing         Canteen
    Factory rent                  20,000        12,500           6,250           1,250
    (cubic space)
    Factory Heat                   5,000            3,125           1,563              312
    (cubic space)
    Supervisors                   25,000        15,000          10,000                    –
    Depreciation                   7,000         3,000           3,000                1,000
    (NBV equipment)
    Canteen                       18,000                –               –            18,000
    Welfare                        5,000            2,500           2,000               500
    (No of employees)
                              $80,000          $36,125         $22,813           $21,062


    Answer to Example 5
                                   Processing        Packing        Canteen
    Already apportioned               36,125           22,813        21,062
    Recharge canteen                  11,701            9,361       (21,062)
    (no. of employees)
                                     $47,826          $32,174          –


    Answer to Example 6
    Repeated distribution method

                                            X            Y            Stores                Maintenance
    Already allocated                      70,000       30,000          20,000                    15,000
                                                                      (20,000)                     4,000
    Recharge stores                        10,000        6,000
                                                                             –                    19,000
                                                                                                 (19,000)
    Recharge maintenance                    8,550           7,600        2,850
                                                                                                        –
                                                                           (2,850)
    Recharge stores                         1,425            855                                     570
                                                                                 –
    Recharge maintenance                     257             228                85                  (570)
                                                                                                        –
                                                                             (85)
    Recharge stores                           43              25                                      17
                                                                               –
                                                                                                     (17)
    Recharge maintenance                       8                7               2
                                                                                                       –
                                               1             1                 (2)
    Recharge stores
                                         $90,284       $44,716                  –
    Algebraic method
    Stores:                  S = 20,000 + 0.15M                 (1)
    Maintenance             M = 15,000 + 0.20S (2)
Answers to examples 121


Replace M in (1):S = 20,000 + 2,250 + 0.03S
                        0.97S = 22,250
                                S = 22,250/0.97 = $22,938
Replace S in (2):M = 15,000 + 0.20 × 22,938
      M = $19,588

                                           X                 Y          Stores      Maintenance
Already allocated                         70,000            30,000       20,000           15,000
Recharge stores:
($22,938)                                 11,469             6,881      (22,938)             4,588
Recharge maintenance:
                                           8,815             7,835        2,938            (19,588)
($19,588)
                                         $90,284           $44,716            –                  –


Chapter 2
Answer to Example 1
(a)       Cost cards:

                                         $ p.u
          Materials (4kg × $3)              12
          Labour (4hrs × $2)                 8
          Var. overheads                     5
          Fixed overheads
                                                2
          ($20,000/10,000)
                                              $27p.u
          Selling price                       $35p.u
          Standard profit                      $8p.u


(b)       Profit Statements
                                                                        January                          February
                                                                         315,000           (11,500 × $35) 402,500
          Sales                                         (9,000 × $35)
          Cost of sales:
          Opening stock                                                        –             (2,000 × $27)      54,000
          Materials                                    (11,000 × $12)     13,200             (9,500 × $12)     114,000
          Labour                                        (11,000 × $8)     88,000              (9,500 × $8)      76,000
          Variable o/h                                  (11,000 × $5)     55,000              (9,500 × $5)      47,500
                                                                          22,000                                19,000
          Fixed o/h                                     (11,000 × $2)                         (9,500 × $2)
                                                                        297,000                                310,500
                                                                        (54,000)                                     –
          Less: Closing stock                           (2,000 × $27)
                                                                        243,000                                310,500
          Standard Gross Profit                         (9,000u × $8)                        (11,500 × $8)
                                                                          72,000                                92,000
          Adjustment for over/(under)
                                                                                                               [
                                          [
                                                                                     [
      [
          absorption of fixed overheads                                    2,000                               (1,000)
          Actual fixed o/h’s: 20,000                                                       Actual: 20,000
          Absorbed: 22,000                                                               Absorbed: 19,000
          Actual Gross Profit                                             74,000                                   91,000

          Less: selling costs
          Variable                                       (9,000 × $1)     (9,000)            (11,500 × $1)    (11,500)
                                                                          (2,000)                              (2,000)
          Fixed
          Actual Net Profit                                              $63,000                              $77,500
122 December 2008 examinations
     PaPer F2

    Answer to Example 2
                                          320, 000
                                                   =$4 per hour
          Overhead absorption rate =
    (a)
                                           80, 000

          Amount absorbed =78,000 × $4 = $312,000
    (b)
          Actual overheads = $315,500
          Amount under absorbed = 315,500 – 312,000 = $3,500


    Chapter 3
    Answer to Example 1
    (a)   Cost card

                                         $ p.u
          Materials (4kg × $3)              12
          Labour (4hrs × $2)                 8
                                             5
          Var. overheads
          Marginal cost                    $25 p.u

          Selling price                   $35 p.u
          Marginal cost                   (25)
                                           (1)
          Variable selling cost
          Standard profit                   $9 p.u
    (b)   Profit Statements

                                                                 January                    February
                                                                   315,000    (11,500 × $35) 402,500
          Sales                                (9,000 × $35)
          Less: Cost of sales:
             Opening stock                                                –    (2,000 × $25)     50,000
             Materials                       (11,000 × $12)        132,000     (9,500 × $12)   114,000
             Labour                           (11,000 × $8)          88,000     (9,500 × $8)     76,000
                                                                     55,000                      47,500
             Variable o/h                     (11,000 × $5)                     (9,500 × $5)
                                                                   275,000                     287,500
                                                                   (50,000)                           –
          Less: Closing stock                  (2,000 × $27)
                                                                   225,000                     287,500
                                                                     90,000                    115,000
                                                                    (9,000)                    (11,500)
          Less: Variable selling costs          (9,000 × $1)                   (11,500 × $1)
          Contribution                                               81,000                    103,500
          Less: Fixed costs
             Production                                            (20000)                     (20,000)
             Selling                                                (2,000)                     (2,000)

          Actual Net Profit                                        $59,000                     $81,500


    Answer to Example 2
                                            January      February
    Absorption costing                        63,000       77,500
                                              59,000       81,500
    Marginal costing
    Difference                                 4,000        (4,000)
    Fixed overheads in stock value:

    Opening Stock (2,000 × $2)                    –            (4,000)
                                              4,000                 –
    Closing stock (2,000 × $2)
                                              4,000            (4,000)
Answers to examples 123


Chapter 4
Answer to Example 1
(a)   Total overheads                           $190,000
      Total labour hours
                    A 20,000 × 2 =                40,000
                    B 25,000 × 1 =                25,000
                                                   2,000
                    C 2,000 × 1 =
                                                  67,000hours

                     190,000
      O.A.R. =               = $2.836 per hour
                     67,000
      Cost cards:

                                                   A                       B                C
      Materials                                          5                     10               10
      Labour                                           10                       5                5
                                                         5.68                   2.84             2.84
      Overheads (at $2.84 per hr)
                                                        20.68                  17.84            17.84
      Selling price                                    20                      20               20
                                                       $(0.68)                 $2.16            $2.16
      Profit / Loss

(b)                                                                Total               A         B          C
      Set-up costs
                           90, 000
                                   = 3, 600 )
      (Cost per set up =                                          90,000         36,000     46,800       7,200
                             25
      Receiving
                             30, 000
                                     = 1, 364 )
      (Cost per delivery =                                        30,000         13,636     13,636       2,728
                               22
      Despatch
                           15, 000
      (Cost per order =            = 250 )                        15,000          5,000      5,000       5.000
                             60
      Machining
                                 55, 000
      (Cost per machine hour:             = 0.585 )               55,000         23,404     29,256       2,340
                                 94 , 000
                                                                 190,000         78,040     94,692      17,268
      Number of units                                                            20,000     25,000       2,000
      Overheads p.u.                                                              $3.90      $3.79       $8.63
      Costings:

                                                        A                   B                 C
      Materials                                         5                  10              10
      Labour                                           10                   5               5
                                                        3.90                3.79             8.63
      Overheads
                                                       18.90               18.79            23.63
      Selling price                                    20                  20               20
      Profit / Loss                                    $1.10               $1.21           $(3.63)


Chapter 5
Answer to Example 1
Selling price = $20 p.u.
Target return = 40% of selling price
Target Cost = $12 p.u.
124 December 2008 examinations
     PaPer F2

    Answer to Example 2
    Target return = 30% × 5M = $1.5M p.u.
    Expected revenue = 40,000 × $67.50 = $2.7M
                    2.7M − 1.5
                               = £30 p.u.
    Target cost =
                      40, 000


    Chapter 6
    No Examples


    Chapter 7
    Answer to Example 1
                                                   Raw materials and W.I.P
                                                         $                                                   $
         b/f (150u × $14)                                2,100
         Raw materials                                  27,800 Transfer to finished goods (2,000u × $33)    66,000
         Labour and overheads                           39,000 Variance                                      1,500
                                                               c/f (100u × $14)                              1,400

                                                         $68,900                                           $68,900
                                                         Finished Goods
                                                           $                                                 $
         b/f (200u × $33)                                  6,600
         Transfer from WIP                                66,000 Cost of sales (2,100u × $33)               69,300
                                                                 c/f (100u × $33)                            3,300

                                                         $72,600                                           $72,600


    Chapter 8
    Answer to Example 1
                                                   A       B
    Selling price                                   25      28
    Materials                                        8      20
    Other variable                                  12       4
                                                    20      24
    Contribution p.u.                                5       4
    Machine hrs p.u.                                 2       1

    Contribution per hour                        $2.50      $4

    Production
                  units                hours
                                       10,000
    B:   10,000 × 1 hr =
    A:   19,000 × 2hrs =                38,000
                                                 hours
                                        48,000
Answers to examples 125


Profit
                                   $
                                 95,000
A:     19,000 × $5
B:     10,000 × $4               40,000
                                135,000
less   Fixed costs:
       [A: 20,000 × $3
       B: 10,000 × $2]            80,000
                          Profit $55,000

Answer to Example 2
                                               A     B
                                                25    28
Selling price
Materials                                        8    20
Throughput p.u.                                $17    $8
Machine hrs p.u.                                 2     1

Contribution per hour                      $8.50     $8


Production
                units            hours
                                 40,000
A:     20,000 × 2hrs =
B:     8,000 × 1hr =               8,000
                                           hours
                                  48,000

Profit
                                   $
                                340,000
A:     29,000 × $17
B:     8,000 × $8                 64,000
                                404,000
less   “fixed” costs:
       [A: 20,000 × $15
       B: 10,000 × $6]           360,000
                          Profit $44,000
                           360,000
                                     = $7.50
Cost per factory hour =
                          $48,000

Throughput accounting ratios:
         8.50
                = 1.13
A:
         7.50
          8
                = 1.07
B:
         7.50
126 December 2008 examinations
     PaPer F2


    Chapter 9
    Answer to Example 1
    Let  S = number of standard chairs produced per week
         E = number of executive chairs produced per week
    Constraints:
         Materials:        2S + 4E ≤ 80
              Labour:               5S + 6E ≤ 180
              Demand:               E ≤ 10
              Non-negativity:       S ≥ 0; E ≥ 0
    Objective:
    Maximise C = 6S + 9E
       S

          40
                                                     Feasible area:
                                                     A,B,C, D, 0


          30            B


                                C
          20


          10


                                D
            0                                 20                      40   E
                             10                           30

    Maximum contribution occurs at point B (using the objective function).
    At B,                   2S + 4E = 80       (1)
                            5S + 6E = 180 (2)
    (1) × 2.5:          5S + 10E = 200 (3)
    (3) – (2):                      4E = 20
                                     E=5
    In (1):                 2S + 20 = 80
                                    2S = 60
                                     S = 30
                                    C = 6S + 9E
                                      = 180 + 45
                                      = $225
    Produce 5 Executive chairs and 30 standard chairs per week.
    Maximum contribution is $225 per week.


    Answer to Example 2
    There is no spare material or labour
    The spare demand for executive chairs is 5 chairs (10 – 5)
Answers to examples 127


Answer to Example 3
(a)      If there was 1 more kg of material available, then the material constraint becomes:
                          2S + 4E ≤ 81
      Point B will still be the optimum solution, and therefore this will be when:
                   2S + 4E = 81           (1)
                   5S + 6E = 180          (2)
      (1) × 2.5 5S + 10E = 202.5          (3)
      (3) – (2)    4E          = 22.5
                             E = 5.625
      in (1)       2S + 22.5 = 81
                   2S          = 58.5
                             C = 6S +9E
                               = 175.5 + 50.625
                               = 226.125
      Shadow price of material = extra contribution
                                   = 226.125 – 225
                                   = $1.125 per kg

(b)      If there was 1 more hour of labour available, then the labour constraint becomes:
                         5S + 6E ≤ 181
      Point B will still be the optimum solution, and therefore this will be when:
                   2S + 4E        = 80     (1)
                   5S + 6E        = 181 (2)
      (1) × 2.5 5S + 10E          = 200 (3)
      (3) – (2)    4E             = 19
                                E = 4.75
      in (1)       2S + 19        = 80
                   2S             = 61
                                S = 30.5
                   C              = 6S +9E
                                  = 183 + 42.75
                                  = 225.75
      Shadow price of labour = 225.75 – 225
                                  = $0.75 per hour
      The shadow price of demand for executive chairs is $0, because there is already spare demand


Chapter 10
Answer to Example 1
(a)   Materials                                     10
      Labour                                         8
      Variable o/h                                   5
      Fixed o/h (50,000 ÷ 10,000)                    5
      Full cost                                     28
      Profit                                      5.60
      Selling price                             $33.60


(b)   Materials                                     10
      Labour                                         8
      Variable o/h                                   5
      Marginal cost                                 23
      Profit                                      9.20
      Selling price                             $32.20
128 December 2008 examinations
     PaPer F2

    Answer to Example 2
                                                           Total                              Marginal   Marginal
      S.P. p.u.            Demand          Cost p.u.                Total cost Total profit
                                                          Revenue                             Revenue      cost
          16                     100           14.0        1,600      1,400         200        1,600      1,400
          15.5                   200           13.9        3,100      2,780         320        1,500      1,380
          15                     300           13.8        4,500      4,140         360        1,400      1,360
          14.5                   400           13.7        5,800      5,480         320        1,300      1,340
          14                     500           13.6        7,000      6,800         200        1,200      1,320
          13.5                   600           13.5        8,100      8,100           -        1,100      1,300
          13                     700           13.4        9,100      9,380       (280)        1,000      1,280
    Optimum selling price is $15 per unit


    Answer to Example 3
    (a)                200 − 100
                         100     = 32
            PED =
                       15.5 − 16
                            16


    (b)                400 − 300
                         300     = 10
            PED =
                       14.5 − 15
                            15


    Answer to Example 4
    Minimum price is £12 + 16, 000 × £1 = £18.40
                            2, 500

                        1
    P = 18.40 −         Q
                 2, 500
    (or P = 18.40 − 0.0004 Q)


    Answer to Example 5
                  1
    P = 50 −                             P = 50 − 0.01Q
                 100
    R = PQ = 50Q − 0.01Q 2
                                 dR
                                       = 50 - 0.02Q
    Marginal revenue =
                                 dQ
                      dC
                           =20
    Total cost =
                      dQ

    For maximum profit, MR = MC
    50 – 0.02Q = 20
    Q = 1,500
    When Q = 1,500
    P = 50 – 0.01Q = $35 p.u.
Answers to examples 129


Chapter 11
Answer to Example 1
(a)   Contribution =                          150 – 120           = $30 p.u.
      Breakeven point =                        54,000             = 1,800 units
                                                 30
      Breakeven revenue =                  1,800 u × $150         = $270,000

                                                3,000 – 1,800
                                                                          × 100 % = 40%
(b)   Margin of safety =
                                                    3,000


New Contribution:                                                     $
                                   S.P. (150 × 1.1)                        165
                                   Var. cost (120 × 1.2)                  (144)
Contribution                                                               $21


Total contribution                           3,000 × 21=                  63,000
Fixed overhead                                                            54,000
                                                Profit                    $9,000


Answer to Example 2
(a)   Lost contribution from Rooks                         (15,000)
      Save fixed overheads                                    5,000
      Net loss from ceasing Rooks                            10,000
Therefore, should continue production of Rooks.


(b)   Lost contribution from Rooks                         (15,000)
      Save fixed overheads                                    5,000
      Extra contribution from Crowners                       20,000
      Extra fixed costs of Crowthers                        (6,000)
      Net gain from ceasing Rooks                             4,000
Therefore, should cease production of Rooks and produce Crowners instead.


Answer to Example 3
Revised costs for special order:
                                              Notes         $
Subcontractor costs                                1              31,300
Supervisor costs                                   2               1,000
General overheads                                  3               1,000
Machine maintenance                                4                 500
Machine overheads                                  5              22,000
Materials                                          6              31,500
Interest costs                                     7                 900
                                                                  88,200
Notes:
1.    The choice lies between the two subcontractor costs that have to be employed because of the shortage of existing
      labour. The minimum cost is to have subcontractors employed who are skilled in the special process.
2.    Only the difference between the bonus and the incentive payment represents an additional cost that arises due to
      the special order. Fixed salary costs do not change.
3.    Only incremental costs are relevant.
130 December 2008 examinations
     PaPer F2

    4.    Depreciation is a period cost and is not related to the special order. Additional maintenance costs are relevant.
    5.    The relevant costs are the variable overheads ($3 × 6000 hours) that will be incurred, plus the displacement costs
          of $2 × 2000 hours making a total of $22,000.
    6.    Since the materials are no longer used the replacement cost is irrelevant. The historic cost of $34,000 is a sunk
          cost. The relevant cost is the lost sale value of the stock used in the special order which is: 7,500 kg × $4.20 per kg
          = $31,500.
    7.    Full opportunity costing will also allow for imputed interest costs on the incremental loan. The correct interest
          rate is the overdraft rate since this represents the incremental cost the company will pay. Simple interest charges
          for three months are therefore: (3/12) × $20,000 × 18% = $900.


    Answer to Example 4
                                X             Y           Z
    Buy-in price                     13             17           16
    Cost to make                     10             12           14
    Saving (p.u.)                    $3             $5           $2


    Kg of B                           3             2             1


    Saving per kg                    $1       $2.50              $2
    RANKING


                                          Material B
                       Units
                                            (kg)
    Y     MAKE         2,500                   5,000
                                               3,000
    Z     MAKE         3,000
                                               8,000kg

    Z     BUY          1,000
    X     BUY          2,000


    Chapter 12
    Answer to Example 1
    (a)   Worst outcome from A: $10,000
          Worst outcome from B: $20,000
          Choose B, the best of the worst outcomes
    (b)   Best outcome from A: $40,000
          Best outcome from B: $24,000
          Choose A, the best of the best outcomes
    (c)   Expected NPV from A = (0.4 × 40,000 ) + (0.6 × 10,000) = $22,000
          Expected NPV from B = (0.4 × 24,000 ) + (0.6 × 20,000) = $21,600
    Choose A, the highest expected NPV


    Answer to Example 2
    (a)
                            Demand
          Contract                           400u        500u         700u        900u
          size
                     300u                   2,900        3,400        4,400       5,400
                     500u                   3,500        4,000        5,000       5,000
                     700u                   4,100        4,600        4,600       4,600
                     800u                   4,400        4,400        4,400       4,400
Answers to examples 131


(b)   (i)      Expected value if contract size =
               300 units = (0.2 ×2,900) + (0.3 × 3,400) + (0.4 × 4,400) + (0.1 × 5,400) = $3,900
               500 units = (0.2 × 3,500) + (0.3 × 4,000) + (0.5 × 5,000) = $4,400
               700 units = (0.2 × 4,100) + (0.8 × 4,600) = $4,500
                            900 units = $4,400
               Sign contract for 700 units

      (ii)     maximin
               Worst outcome from:
               300 units = $2,900
               500 units = $3,500
               700 units = $4,100
               800 units = $4,400
               Sign contract for 800 units

      (iii)    Best outcome from
               300 units = $5,400
               500 units = $5,000
               700 units = $4,600
               800 units = $4,400
               Sign contract for 300 units

      (iv)     Regret table:

                               Demand
               Contract                           400u          500u     700u        900u
               size
                         300u                     1,500         1,200     600            0
                         500u                       900           600       0          400
                         700u                       300             0     400          800
                         800u                         0           200     600        1,000
               Worst regret for
               300 units = $1,500
               500 units = $900
               700 units = $800
               800 units = $1,000
               Sign contract for 700 units


Chapter 13
Answer to Example 1
(a)   Sales budget

                                         $
      X       2,000u       × $100 =             200,000
      Y       4,000u       × $130 =             520,000
                                                450,000
      Z       3,000u       × $150 =
                                             $1,170,000

(b)   Production budget

                                 X             Y            Z
      Sales                    2,000         4,000        3,000
      Opening stock             (500)         (800)        (700)
                                 600         1,000          800
      Closing stock
      Production               2,100 u       4,200 u      3,100 u
132 December 2008 examinations
     PaPer F2

    (c)   Material usage budget

                                      Wood         Varnish
          X         2,100u      ×5=   10,500    ×2   4,200
          Y         4,200u      ×3=   12,600    ×2   8,400
                                       6,200         3,100
          Z         3,100u      ×2=             ×1
                                      29,300 kg     15,700 litres

    (d)   Materials purchases budget

                                 Wood            Varnish
          Usage                   29,300           15,700
          Opening stock          (21,000)         (10,000)
                                  18,000            9,000
          Closing stock
                                  26,300 kg        14,700 litres
                                    × $8             × $4
                                $210,400          $58,800

    (e)   Labour budget

                                      hours
          X        2,100u × 4   =        8,400
          Y        4,200u × 6   =       25,200
                                        24,800
          Z        3,100u × 8   =
                                        58,400 hours
                                           ×$3
                                      $175,200

    Answer to Example 2
                        Flexed        Actual     Variances
    Sales                 12,000u       12,000 u
    Production            12,000u       12,000 u

                           120,000     122,000
    Sales                                                2,000 (F)
    Materials                                                –
                            60,000      60,000
    Labour                  30,000      28,500           1,500 (F)
                            15,000      15,000
    Variable o/h                                             –
                           105,000     103,500
    Contribution            15,000      18,500
                            10,000      11,000          1,000 (A)
    Fixed o/h
    Profit                  $5,000      $7,500         $2,500 (F)

    Statement

                                                                     $
    Original budget contribution        (10,000u × $1.25)          12,500
                                                                    2,500 (F)
    Sales volume variance                  (2,000 × $1.25)
                                                                   15,000
                                                                    2,000 (F)
    Sales price variance
                                                                    1,500 (F)
    Labour variance
    Actual contribution                                            18,500
    Fixed overheads
       Budget                                       10,000
                                                     1,000 (A)     11,000
       Variance
    Actual profit                                                  $7,500
Answers to examples 133


Chapter 14
Answer to Example 1
                                                            u        $
High                                                          700     85,000
Low                                                           100     40,000
                                                             600u    $45,000

                           45,000
                                           = $75
Variable cost =
                            600


For high:

Total cost =                                                85,000
Variable cost (700u @ $75)                                  52,500
Fixed cost                                                 $32,500


Answer to Example 2
  x                    y              xy            x2          y2
  1                   40              40             1      1,600
  4                   65             260            16      4,225
  2                   45              90             4      2,025
  7                   85             595            49      7,225
  6                   70             420            36      4,900
  5                   70             350            25      4,900
  3                   50             150             9      2,500
 28                  425           1,905           140     27,375
 Σx                   Σy             Σxy           Σx2        Σy2


      n ∑ xy −∑ x ∑ y
b=
       n ∑ x 2 −( ∑ x )
                           2


  7×1, 905 − 28×425
=
      7×140 − 282
  1, 435
         = 7.321
=
   196


     ∑ y − b∑ x
a=
     n     n
  425 7.321×28
               = 31.430
=     −
   7      7

y = 31.430 + 73.21x


Answer to Example 3
                     n∑ xy −∑ x ∑ y
r=
       (n∑ x −(∑ x) (n∑ y −(∑ y) ))
                               2                   2
                 2                     2


                 (7×1, 905)−(28×425)
=
     (((7×140)−(28) )((7×27, 375)−(425) ))
                           2                           2


        1, 435
                      = 0.977
=
     196×11, 00
134 December 2008 examinations
     PaPer F2

    Answer to Example 4
                                                 Moving         Trend        Seasonal     % variation
                                                 Average                     Variation
    2000                       1            80
                               2            87        84.75
                               3            82        87.25           86             -4          95.3
                               4            90        89.25        88.25         + 1.75         102.0
    2001                       1            90           92        90.62         - 0.62          99.3
                               2            95           95         93.5           +1.5         101.6
                               3            93        98.75        96.87         - 3.87          96.0
                               4           102         103        100.87         +1.13          101.1
    2002                       1           105        105.5       104.25         +0.75          100.7
                               2           112         109        107.25         +4.75          104.4
                               3           103
                               4           116

                          1            2          3             4
    2000                     -            -          -4       + 1.75
    2001                - 0.62        + 1.5      - 3.87       + 1.13
    2002                + 0.95       + 4.75           -            -
    Total               + 0.13       + 6.25      - 7.87       + 2.88
    Averages            + 0.06       + 3.12      - 3.93       + 1.44


    Answer to Example 5
                          1            2          3             4
    2000                    -            -        95.3         102.0
    2001                 99.3        101.6        96.0         101.1
    2002                100.7        104.4           -             -
    Total                200          206        191.3         203.1
    Averages            100%         103%        95.6%        101.5%


    Answer to Example 6
                    Average
      units                  Total time
                      time
          1             100       100
          2               75      150
          4            56.25      225
          8         42.1875     337.5

                                     hours
    Time for 8                       337.5
    Time for first                   100
    Time for additional 7            237.5 hours


    Answer to Example 7
    (a)            log 0.85
              b=              = −0.2345
                    log 2


              y = axb
              for 16 batches y = 200 × 16-02345 = 104.3912

              Total time for 16 = 16 × 104.4              =    1,670 hours
              Time for first                              =      200 hours
              Time for next 15                            =    1,470 hours
Answers to examples 135


(b)      Average time for 30 = 200 × 30-0.2345 = 90.08
               Total time for 30 = 30 × 90.08 = 2,703 hours
         Average time for 29 = 200 × 29-0.2345 = 90.80
               Total time for 29 = 29 × 90.80 = 2,633 hours
         Time for 30th = 2,703 – 2,633 = 70 hours


Chapter 15
Answer to Example 1
                              Original               Flexed
                                                                        Actual         Variances
                            Fixed Budget             Budget
                            $                    $                  $
Sales (units)                      8,000               8,400              8,400
Production (units)                 8,700               8,900              8,900

                                  600,000            630,000            613,200
Sales                                                                                     16,800   (A)
Materials                                                                                  3,255   (A)
                                  156,600            160,200            163,455
Labour                            217,500            222,500            224,515            2,015   (A)
Variable o/h                       87,000             89,000             87,348            1,652   (F)
                                  130,500            133,500            134,074
Fixed o/h                                                                                    574   (A)
                                  591,600            605,200            609,392
                                  (47,600)           (34,000)           (34,000)
Closing stock
                                  544,000            571,200            575,392
Profit                            $56,000            $58,800            $37,808           20,992   (A)


Answer to Example 2
Materials
     Expense variance
     Actual purchases           at actual cost                     163,455
     35,464kg
                                at standard cost
                                                                   159,588
                                ($4.50)
                                                                    $3,867 (A)
         Usage variance
                                                              kg
         Actual usage                                               35,464
         Standard usage for actual production
                                                                    35,600
         (8,900 u × 4kg)
                                                                       136kg
                                  at a standard cost ($4.50) = $612 (F)
Labour
     Rate of Pay variance

         Actual hours paid at actual cost                          224,515
                                                                   227,000
         45,400 hours at standard cost ($5)
                                                                    $2,485       (F)

         Idle Time Variance

         Actual hours paid                                          45,400
                                                                    44,100
         Actual hours worked
                                                                     1,300     hrs
                                  at a standard cost ($5) = $6,500 (A)
136 December 2008 examinations
     PaPer F2

          Efficiency variance
          Actual hours worked                               44,100
          Standard hours for actual production
                                                            44,500
          (8,900 u × 5hrs)
                                                               400 hrs
                                         at a standard cost ($5) = $2,000 (F)
    Variable overheads
          Expenditure variance
          Actual hours worked         at actual cost         87,348
                                                             88,200
                    44,100            at standard cost
                                                              $852 (F)
          Efficiency variance
          Actual hours worked                               44,100
          Standard hours for actual production
                                                            44,500
          (8,900u × 5hrs)
                                                               400 hrs
                                               at a standard cost ($2) = $800 (F)
    Fixed overheads
         Expenditure variance

          Actual total                                      134,074
                                                            130,500
          Original budget total
                                                             $3,574 (A)
          Capacity variance
          Actual hours worked                                44,100
                                                             43,500
          Budget hours (8,700u × 5hrs)
                                                                600 hrs
                                         at a standard cost ($3) = $1,800 (F)
          Efficiency variance
          Actual hours worked                                  44,100
          Standard hours for actual production
                                                               44,500
          (8,900u × 5hrs)
                                                                  400 hrs
                                               at a standard cost ($3) = $1,200 (F)
    Operating Statement
                                                      $
    Original budget profit                           56,000
                                                      2,800
    Sales            – volume variance                         (F)
                                                     58,800
    Sales            – price variance               (16,800)   (A)
    Materials        – expense variance              (3,867)   (A)
                     – usage variance                   612    (F)
    Labour           – rate of pay variance           2,485    (F)
                     – idle time variance            (6,500)   (A)
                     – efficiency variance            2,000    (F)
    Variable o/hs    – expense variance                 852    (F)
                     – efficiency variance              800    (F)
    Fixed o/hs       – expense variance              (3,574)   (A)
                     – capacity variance              1,800    (F)
                                                      1,200
                     – efficiency variance                     (F)
    Actual profit                                   $37,808
Answers to examples 137


Answer to Example 3
No Answer


Answer to Example 4
No Answer


Chapter 16
Answer to Example 1
Cost cards:

                                           Original                                        Revised
                                                $p.u.                                           $p.u.
Materials (1 litre @ $1 per litre)               1.00      (1.2 litres @$0.95 per litre)         1.14
Labour (2hrs @ $2.50 per hr)                     5.00      (2 hrs @$2.60 per hr)                 5.20
                                                 1.40                                            1.40
Variable overheads
                                                 7.40                                            7.74
Selling price                                  16.00                                           16.00
Standard contribution                            8.60                                            8.26


Operating statement
Original budget contribution (5,000u × $8.60)                              43,000
                                                                            5,830(A)
Planning Variance (balancing figure)
Revised budget contribution (4,500u × $8.26)                               37,170

Operational variances
                                                                            4,956(F)
Sales volume variance ((5,100u – 4,500u) × $8.26)
                                                                           42,126

Sales price variance (81,000 – (5,100 × 16))                                  600(A)

Materials expense variance (5,120 – (5150 × 0.95))                          227.5(A)

Materials usage variance (5,150 – (5,200 × 1.2)) × 0.95                    1035.5(F)

Labour rate variance (27,400 – (10,200 × 2.60)                                880(A)

Labour efficiency variance (10,200 – (5,200 × 2)) × 2.60                      520(F)

Variable overhead variance (7,000 – (5,200 × 1.40))                           280(F)

Actual contribution                                                        42,254
Less: Fixed overheads
           Budget 20,000
                                                                           19,500
             Variance 500(F)
Actual profit                                                             $22,754


Answer to Example 2
Total materials cost variance

Actual total cost (27,000 + 11,000)                           38,000
                                                              40,000
Standard total cost (5,000 × $8)
Total cost variance                                           $2,000(F)
138 December 2008 examinations
     PaPer F2

    Materials price variance
           Actual         Actual           Actual                 Standard
         purchases          cost         purchases                   cost
         kg               $              kg                       $
    X         9,900         27,000            9,900                   29,700
                            11,000                                    10,600
    Y         5,300                           5,300
                            38,000                                    40,300
    Price variable = 38,000 – 40,300 = $2,300 (F)
    Mix variance
         Actual       Standard       Standard                     Standard
        purchases        cost           mix                          cost
           kg             $             kg                            $
    X         9,900       29,700 (⅔)     10,133                        30,399
              5,300       10,600 (⅓)       5,067                       10,134
    Y
             15,200kg     40,300         15,200kg                      40,533


    Mix variance = 40,300 – 40,533 = 233 (F)
    Yield variance
           Standard mix                 Standard            Standard       Standard
                                           cost                mix            cost
           (actual total)
                kg                          $                  kg               $
    X               10,133                   30,399             10,000         30,000
                     5,067                   10,134              5,000         10,000
    Y
                    15,200kg                 40,533             15,000kg       40,000
    Yield variance = 40,533 – 40,000 = 533 (A)
    (Usage variance = Yield variance + Mix variance = 533 (A) + 233 (F) = 300 (A))


    Answer to Example 3
    Total sales margin variance
    Budget profit:

    A      200u       ×      (20 – 17)                600
    B      100u       ×      (25 – 21)          =     400
                                                      600
    C      100u       ×      (30 – 24)          =
                                                    1,600
    Actual profit (using standard costs):

    A      180u       ×      (22 – 17)                900
    B      150u       ×      (22 – 21)          =     150
                                                      340
    C      107u       ×      (26 – 24)          =
                                                    1,390
    Total variance = 1,390 – 1,600 = $210 (A)
    Sales price variance
                                     Actual                          Standard
             Actual sales                             Actual sales
                                      S.P.                              S.P.
                  u                    $                   u             $
    A     180 × 22 =                    3,960        180 × 20 =           3,600
    B     150 × 22 =                    3,300        150 × 25 =           3,750
                                        4,420                             5,100
    C     170 × 26 =                                 170 × 30 =
                                       11,680                            12,450
    Sales price variance = 11,680 – 12,450 = $770 (A)
    Sales mix variance
Answers to examples 139


                              Actual                                     Standard
         Actual sales                                    Actual sales
                               S.P.                                         S.P.
               u                $                             u              $
A     180 × $3 =                    540     (2/4)      250 × $3 =               750
B     150 × $4 =                    600     (1/4)      125 × $4 =               500
C     170 × $6 =                 1,020      (1/4)      125 × $6 =               750
      500                        2,160                 500                    2,000
Mix variance = 2,160 – 2,000 = $160 (F)
Sales quantity variance
      Standard mix                  Standard                                     Standard
                                                           Budget
       (actual total)                 Profit                                       profit
             u                          $                     u                      $
A           250 × $3 =                     750             200 × $3 =                   600
B           125 × $4 =                     500             100 × $4 =                   400
C           125 × $6 =                     750             100 × $6 =                   600
                   500                   2,000                    400                 1,600
Quantity variance = 20,000 – 1,600 = $400 (F)


Answer to Example 4
(a)   Each unit takes 7.6 hours to make, and therefore the company expects to need to pay for 7.6/.95 = 8 hours of
      labour.
      8 hours at the rate of $5.70 per hour gives a standard cost of $45.60 per unit
(b)   Each unit should take 7.6 hours to produce, and should cost $45.60 for labour. Therefore, the effective standard
      cost per hour worked is 45.60 / 7.6 = $6.00
c)    Total labour variance:
       Actual cost of production:                      50,020
       Standard cost of actual production
       (1,000 units at $45.60)                         45,600
                                                        4,420 (A)
       Total variance
d)    Rate of pay variance:
       Actual amount paid                             50,020
       Standard cost of actual hours paid
       (8,200 hours at $5.70)                         46,740
                                                        3,280 (A)
       Total variance
      Idle time variance:
       Actual idle hours (8,200 – 7,740)                  460 hours
       Standard idle time (8,200 × 5%)                    410 hours
       Excess idle time                                    50 hours
                                                        $300 (A)
       Idle time variance: 50 hours at $6.00 =
      Efficiency variance:

       Actual hours worked                              7,740 hours
       Standard hours worked for actual
       Production: 1000 units × 7.6 hours =             7,600 hours
       Idle time variance: 50 hours at $6.00 =            140 hours
                                                        $840 (A)
       Efficiency variance: 140 hours × $6 =
      (Check:

       Rate of pay                                      3,280 (A)
       Excess idle time                                   300 (A)
       Efficiency                                         840 (A)
                                                        4,420 hours
       Total
140 December 2008 examinations
     PaPer F2


    Chapter 17
    Answer to Example 1
                                                      2007        2006
                                    790
                                 (        )
    Net profit margin                                 11%         8.5%
                                   7, 180

                                     1, 795
                                 (          )
    Gross profit margin                               25%         22.5%
                                     7, 180

                                      790
                                 (          )
    Return on capital employed                        29.4%       25.7%
                                     2, 690

                                      478
                                 (          )
    Return on equity capital                          21.8%       19%
                                     2, 190

                                     7, 180
                                 (          )
    Asset turnover                                    2.67        3.02
                                     2, 690

                                     2, 314
                                 (          )
    Current ratio                                     2.4         2.4
                                      965

                                     1, 308
                                 (          )
    Quick ratio (or acid test)                        1.36        1.15
                                      965

                                     1, 006
                                 (          × 365)
    Inventory turnover                                68.2 days   75.5 days
                                     5, 385

                                      948
                                 (          × 365)
    Receivables days                                  48.2 days   47.5 days
                                     7, 180

                                      653
                                 (          × 365)
    Payables days                                     44.3 days   44.7 days
                                     5, 385

                                      500
                                 (          )
    Gearing ratio                                     22.8%       28.6%
                                     2, 190

                                      478
                                 (          )
    Earnings per share                                $0.40       $0.37
                                     1, 200

    P/E ratio                                         5.75        5.41

                                     169 ÷ 1, 200
                                 (                )
    Dividend yield                                    6.12%       6.60%
                                         230

                                     790
                                 (       )
    Interest cover                                    15.8        8.88
                                      50


    Chapter 18
    No Examples
Answers to examples 141


Chapter 19
Answer to Example 1
                                      17,000
                                                        = 17%
Return from new project =
                                     100,000

(a)   For company:
      17% > 15% (target)
      Therefore company wants to accept

(b)   For division

                                              82,000
      ROI (without project)                                        = 16.4%
                                              500,000
                                          82,000 + 17,000
      ROI (with project)                                           = 16.5%
                                         500,000 + 100,000
      ROI of division increases therefore divisional manager motivated to accept.


Answer to Example 2
                                     16,000
Return from new project =                                       = 16%
                                     100,000
(a)   For company: 16% > 15%
      Company wants to accept
(b)   For division:

ROI (without project)                                        =16.4%
                                    82,000 + 16,000
ROI (with project)                                         = 16.3%
                                   500,000 + 100,000


Answer to Example 3
(1)   RI (without project)
      Profit                                             82,000
      Less: Interest
      15% × 500,000                                     (75,000)
                                                          $7,000

      RI (with project)
      Profit                                             99,000
      Less: Interest
      15% × 600,000                                      90,000
                                                         $9,000
      $9,000 > $7,000     manager motivated to accept

(2)   RI (without project)                               $7,000

      ROI (with project)
      Profit                                             98,000
      Less: Interest
      15% × 600,000                                      90,000
                                                         $8,000
      $8,000 > $7,000     manager motivated to accept
      In both cases the decisions are goal congruent
142 December 2008 examinations
    PaPer F5


    Chapter 20
    Answer to Example 1
    (a)      Selling price                         20
             Costs:                 A       10
                                    B        4     14
             Profit                                $6

    (b)                        A                                         B
             Total Profit       12               Selling price            20
             Cost               10               Total Profit      12
             Profit             $2               Costs              4     16
                                                 Profit                   $4


    Answer to Example 2
    (a)      Transfer price = 15 × 1.2 = $18 p.u.

    (b)      Selling price                         30
             Costs:                 A       15
                                    B        5     20
             Profit                               $10

    (c)                        A                                         B
             Total Profit       18               Selling price            30
             Cost               15               Total Profit      18
             Profit             $3               Costs              5     23
                                                 Profit                   $7


    Answer to Example 3
    (a)      Transfer price = 20 × 1.2 = $24 p.u.

    (b)      Selling price                         30
             Costs:                 A       20
                                    B        8     28
             Profit                                $2

    (c)                        A                                         B
             Total Profit       24               Selling price               30
             Cost               20               Total Profit      24
             Profit             $4               Costs              8      32
                                                 Profit                   $(2)


    Answer to Example 4
    For A:                   T.P.    > 20
    For B:            T.P.   < 30 - 8
                                     < 22
    Sensible T.P. between $20 and $22 p.u.


    Answer to Example 5
    For A:                   T.P.    > 15
    For B:            T.P.   < 35 - 10
                                     < 25
    Sensible range between $15 and $25 p.u.


                                                                 For latest news and course notes updates please visit www.opentuition.com
Answers to examples 143


Answer to Example 6
For A:               T.P.   > 20
For B:        T.P.   < 25 (as in previous example)
                            < 22
Sensible range. between $20 and $22 p.u.


Answer to Example 7
(a)      For A:             T.P.   >8
For B:        T.P.   < 14


Sensible range between $8 and $14 p.u.


(b)      For A:             T.P.   >8
For B:        T.P.   < 20 – 4
                            < 16
Sensible range between $8 and $16 p.u.


Answer to Example 8
                                   X         Y
Contribution                       $20     $30
Hours                                5      10
Contribution per hour               $4      $3
Therefore, if no transfers to B then A would sell exactly and generate $4 per hour contribution.
To make transfers of Y worthwhile, A need to charge at least 70 + (10 × 4) = $110 p.u.


Chapter 21
No Examples
144 December 2008 examinations
    PaPer F5


                                 For latest news and course notes updates please visit www.opentuition.com

More Related Content

Viewers also liked

Menerima tempahan menampal batu swarovski
Menerima tempahan menampal batu swarovskiMenerima tempahan menampal batu swarovski
Menerima tempahan menampal batu swarovskiSaufee Luffy Mugiwara
 
Examples-Answers-all-Sections-2up
Examples-Answers-all-Sections-2upExamples-Answers-all-Sections-2up
Examples-Answers-all-Sections-2upsyed ahmed taran
 
Concurrent Forces
Concurrent ForcesConcurrent Forces
Concurrent Forcesguestb54490
 
Coplanar concurrent forces
Coplanar concurrent forcesCoplanar concurrent forces
Coplanar concurrent forcesDarshan Panchal
 
FORCE, TYPES, & SYSTEM OF FORCES
FORCE, TYPES, & SYSTEM OF FORCESFORCE, TYPES, & SYSTEM OF FORCES
FORCE, TYPES, & SYSTEM OF FORCESManish Jha
 

Viewers also liked (7)

Menerima tempahan menampal batu swarovski
Menerima tempahan menampal batu swarovskiMenerima tempahan menampal batu swarovski
Menerima tempahan menampal batu swarovski
 
Examples-Answers-all-Sections-2up
Examples-Answers-all-Sections-2upExamples-Answers-all-Sections-2up
Examples-Answers-all-Sections-2up
 
Concurrent Forces
Concurrent ForcesConcurrent Forces
Concurrent Forces
 
Coplanar concurrent forces
Coplanar concurrent forcesCoplanar concurrent forces
Coplanar concurrent forces
 
Types of forces
Types of forcesTypes of forces
Types of forces
 
Forces Ppt
Forces PptForces Ppt
Forces Ppt
 
FORCE, TYPES, & SYSTEM OF FORCES
FORCE, TYPES, & SYSTEM OF FORCESFORCE, TYPES, & SYSTEM OF FORCES
FORCE, TYPES, & SYSTEM OF FORCES
 

Similar to F5 Answers To Examples

Melford Written Analysis
Melford Written AnalysisMelford Written Analysis
Melford Written AnalysisUCFPMBA
 
97903171 cost-accounting-series-3-2007-code3016
97903171 cost-accounting-series-3-2007-code301697903171 cost-accounting-series-3-2007-code3016
97903171 cost-accounting-series-3-2007-code3016priya5594
 
Budgeting Problem - JRM
Budgeting Problem - JRMBudgeting Problem - JRM
Budgeting Problem - JRMJay R Modi
 
Actual Vs Budget Variance PowerPoint Presentation Slides
Actual Vs Budget Variance PowerPoint Presentation SlidesActual Vs Budget Variance PowerPoint Presentation Slides
Actual Vs Budget Variance PowerPoint Presentation SlidesSlideTeam
 
212255 ama-sn- 2010(final)
212255 ama-sn- 2010(final)212255 ama-sn- 2010(final)
212255 ama-sn- 2010(final)Ashok Prasad
 
Budget Vs Actual Variance Analysis PowerPoint Presentation Slides
Budget Vs Actual Variance Analysis PowerPoint Presentation SlidesBudget Vs Actual Variance Analysis PowerPoint Presentation Slides
Budget Vs Actual Variance Analysis PowerPoint Presentation SlidesSlideTeam
 
Budget Variance PowerPoint Presentation Slides
Budget Variance PowerPoint Presentation SlidesBudget Variance PowerPoint Presentation Slides
Budget Variance PowerPoint Presentation SlidesSlideTeam
 
Franchise presentation
Franchise presentationFranchise presentation
Franchise presentationKiizii Malubay
 
Executive Summary Case 4 Melford
Executive Summary  Case 4 MelfordExecutive Summary  Case 4 Melford
Executive Summary Case 4 MelfordUCFPMBA
 
Business plan on fly ash bricks
Business plan on fly ash bricksBusiness plan on fly ash bricks
Business plan on fly ash bricksAtikant Kashyap
 
Assessing carbon value
Assessing carbon valueAssessing carbon value
Assessing carbon valuePeter Weisberg
 
Textile printing project dr.azhar 2004
Textile printing project dr.azhar 2004Textile printing project dr.azhar 2004
Textile printing project dr.azhar 2004softbiz1
 
Lab 4 2 Celines Scooter Supply Ltd Quarterly Income
Lab 4 2 Celines Scooter Supply Ltd Quarterly IncomeLab 4 2 Celines Scooter Supply Ltd Quarterly Income
Lab 4 2 Celines Scooter Supply Ltd Quarterly IncomeSalena Shemilt
 
5 year cashflow Cal Marine SCAM????
5 year cashflow Cal Marine SCAM????5 year cashflow Cal Marine SCAM????
5 year cashflow Cal Marine SCAM????FingerPointer
 
Cost Vs Budget PowerPoint Presentation Slides
Cost Vs Budget PowerPoint Presentation SlidesCost Vs Budget PowerPoint Presentation Slides
Cost Vs Budget PowerPoint Presentation SlidesSlideTeam
 
Using The What If Scenarios In Excel
Using The What If Scenarios In ExcelUsing The What If Scenarios In Excel
Using The What If Scenarios In Excelrparken25
 
33918586 cost-accounting-level-3-series-2-2009
33918586 cost-accounting-level-3-series-2-200933918586 cost-accounting-level-3-series-2-2009
33918586 cost-accounting-level-3-series-2-2009priya5594
 
Pbl2 p & l statement - excel
Pbl2   p & l statement - excelPbl2   p & l statement - excel
Pbl2 p & l statement - excelMARIAPHAN
 
Pbl2 p & l statement - excel
Pbl2   p & l statement - excelPbl2   p & l statement - excel
Pbl2 p & l statement - excelMARIAPHAN
 

Similar to F5 Answers To Examples (20)

Melford Written Analysis
Melford Written AnalysisMelford Written Analysis
Melford Written Analysis
 
97903171 cost-accounting-series-3-2007-code3016
97903171 cost-accounting-series-3-2007-code301697903171 cost-accounting-series-3-2007-code3016
97903171 cost-accounting-series-3-2007-code3016
 
Budgeting Problem - JRM
Budgeting Problem - JRMBudgeting Problem - JRM
Budgeting Problem - JRM
 
Actual Vs Budget Variance PowerPoint Presentation Slides
Actual Vs Budget Variance PowerPoint Presentation SlidesActual Vs Budget Variance PowerPoint Presentation Slides
Actual Vs Budget Variance PowerPoint Presentation Slides
 
212255 ama-sn- 2010(final)
212255 ama-sn- 2010(final)212255 ama-sn- 2010(final)
212255 ama-sn- 2010(final)
 
Budget Vs Actual Variance Analysis PowerPoint Presentation Slides
Budget Vs Actual Variance Analysis PowerPoint Presentation SlidesBudget Vs Actual Variance Analysis PowerPoint Presentation Slides
Budget Vs Actual Variance Analysis PowerPoint Presentation Slides
 
Budget Variance PowerPoint Presentation Slides
Budget Variance PowerPoint Presentation SlidesBudget Variance PowerPoint Presentation Slides
Budget Variance PowerPoint Presentation Slides
 
Franchise presentation
Franchise presentationFranchise presentation
Franchise presentation
 
Executive Summary Case 4 Melford
Executive Summary  Case 4 MelfordExecutive Summary  Case 4 Melford
Executive Summary Case 4 Melford
 
Business plan on fly ash bricks
Business plan on fly ash bricksBusiness plan on fly ash bricks
Business plan on fly ash bricks
 
Assessing carbon value
Assessing carbon valueAssessing carbon value
Assessing carbon value
 
Textile printing project dr.azhar 2004
Textile printing project dr.azhar 2004Textile printing project dr.azhar 2004
Textile printing project dr.azhar 2004
 
Lab 4 2 Celines Scooter Supply Ltd Quarterly Income
Lab 4 2 Celines Scooter Supply Ltd Quarterly IncomeLab 4 2 Celines Scooter Supply Ltd Quarterly Income
Lab 4 2 Celines Scooter Supply Ltd Quarterly Income
 
5 year cashflow Cal Marine SCAM????
5 year cashflow Cal Marine SCAM????5 year cashflow Cal Marine SCAM????
5 year cashflow Cal Marine SCAM????
 
Cost Vs Budget PowerPoint Presentation Slides
Cost Vs Budget PowerPoint Presentation SlidesCost Vs Budget PowerPoint Presentation Slides
Cost Vs Budget PowerPoint Presentation Slides
 
Chapter no 8 EOQ
Chapter no 8 EOQChapter no 8 EOQ
Chapter no 8 EOQ
 
Using The What If Scenarios In Excel
Using The What If Scenarios In ExcelUsing The What If Scenarios In Excel
Using The What If Scenarios In Excel
 
33918586 cost-accounting-level-3-series-2-2009
33918586 cost-accounting-level-3-series-2-200933918586 cost-accounting-level-3-series-2-2009
33918586 cost-accounting-level-3-series-2-2009
 
Pbl2 p & l statement - excel
Pbl2   p & l statement - excelPbl2   p & l statement - excel
Pbl2 p & l statement - excel
 
Pbl2 p & l statement - excel
Pbl2   p & l statement - excelPbl2   p & l statement - excel
Pbl2 p & l statement - excel
 

F5 Answers To Examples

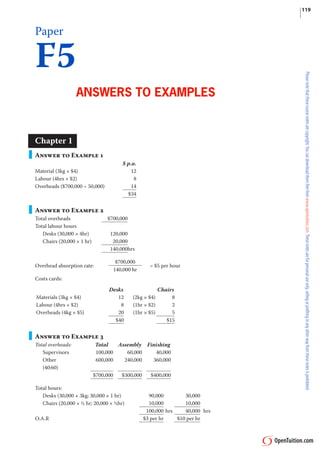
  • 1. 119 Paper F5 Answers to exAmPles Chapter 1 Answer to Example 1 $ p.u. Material (3kg × $4) 12 Labour (4hrs × $2) 8 14 Overheads ($700,000 ÷ 50,000) $34 Answer to Example 2 $700,000 Total overheads Total labour hours Desks (30,000 × 4hr) 120,000 20,000 Chairs (20,000 × 1 hr) 140,000hrs $700,000 Overhead absorption rate: = $5 per hour 140,000 hr Costs cards: Desks Chairs Materials (3kg × $4) 12 (2kg × $4) 8 Labour (4hrs × $2) 8 (1hr × $2) 2 20 5 Overheads (4kg × $5) (1hr × $5) $40 $15 Answer to Example 3 Total Assembly Finishing Total overheads: Supervisors 100,000 60,000 40,000 Other 600,000 240,000 360,000 (40:60) $700,000 $300,000 $400,000 Total hours: Desks (30,000 × 3kg; 30,000 × 1 hr) 90,000 30,000 10,000 10,000 Chairs (20,000 × ½ hr; 20,000 × ½hr) 100,000 hrs 40,000 hrs O.A.R $3 per hr $10 per hr
  • 2. 120 December 2008 examinations PaPer F2 Cost cards: desk chair Materials 12 8 Labour 8 2 Overheads: 80 Assembly 9 1.50 10 5.00 Finishing 19 6.50 $39 $16.50 Answer to Example 4 Total Processing Packing Canteen Factory rent 20,000 12,500 6,250 1,250 (cubic space) Factory Heat 5,000 3,125 1,563 312 (cubic space) Supervisors 25,000 15,000 10,000 – Depreciation 7,000 3,000 3,000 1,000 (NBV equipment) Canteen 18,000 – – 18,000 Welfare 5,000 2,500 2,000 500 (No of employees) $80,000 $36,125 $22,813 $21,062 Answer to Example 5 Processing Packing Canteen Already apportioned 36,125 22,813 21,062 Recharge canteen 11,701 9,361 (21,062) (no. of employees) $47,826 $32,174 – Answer to Example 6 Repeated distribution method X Y Stores Maintenance Already allocated 70,000 30,000 20,000 15,000 (20,000) 4,000 Recharge stores 10,000 6,000 – 19,000 (19,000) Recharge maintenance 8,550 7,600 2,850 – (2,850) Recharge stores 1,425 855 570 – Recharge maintenance 257 228 85 (570) – (85) Recharge stores 43 25 17 – (17) Recharge maintenance 8 7 2 – 1 1 (2) Recharge stores $90,284 $44,716 – Algebraic method Stores: S = 20,000 + 0.15M (1) Maintenance M = 15,000 + 0.20S (2)
  • 3. Answers to examples 121 Replace M in (1):S = 20,000 + 2,250 + 0.03S 0.97S = 22,250 S = 22,250/0.97 = $22,938 Replace S in (2):M = 15,000 + 0.20 × 22,938 M = $19,588 X Y Stores Maintenance Already allocated 70,000 30,000 20,000 15,000 Recharge stores: ($22,938) 11,469 6,881 (22,938) 4,588 Recharge maintenance: 8,815 7,835 2,938 (19,588) ($19,588) $90,284 $44,716 – – Chapter 2 Answer to Example 1 (a) Cost cards: $ p.u Materials (4kg × $3) 12 Labour (4hrs × $2) 8 Var. overheads 5 Fixed overheads 2 ($20,000/10,000) $27p.u Selling price $35p.u Standard profit $8p.u (b) Profit Statements January February 315,000 (11,500 × $35) 402,500 Sales (9,000 × $35) Cost of sales: Opening stock – (2,000 × $27) 54,000 Materials (11,000 × $12) 13,200 (9,500 × $12) 114,000 Labour (11,000 × $8) 88,000 (9,500 × $8) 76,000 Variable o/h (11,000 × $5) 55,000 (9,500 × $5) 47,500 22,000 19,000 Fixed o/h (11,000 × $2) (9,500 × $2) 297,000 310,500 (54,000) – Less: Closing stock (2,000 × $27) 243,000 310,500 Standard Gross Profit (9,000u × $8) (11,500 × $8) 72,000 92,000 Adjustment for over/(under) [ [ [ [ absorption of fixed overheads 2,000 (1,000) Actual fixed o/h’s: 20,000 Actual: 20,000 Absorbed: 22,000 Absorbed: 19,000 Actual Gross Profit 74,000 91,000 Less: selling costs Variable (9,000 × $1) (9,000) (11,500 × $1) (11,500) (2,000) (2,000) Fixed Actual Net Profit $63,000 $77,500
  • 4. 122 December 2008 examinations PaPer F2 Answer to Example 2 320, 000 =$4 per hour Overhead absorption rate = (a) 80, 000 Amount absorbed =78,000 × $4 = $312,000 (b) Actual overheads = $315,500 Amount under absorbed = 315,500 – 312,000 = $3,500 Chapter 3 Answer to Example 1 (a) Cost card $ p.u Materials (4kg × $3) 12 Labour (4hrs × $2) 8 5 Var. overheads Marginal cost $25 p.u Selling price $35 p.u Marginal cost (25) (1) Variable selling cost Standard profit $9 p.u (b) Profit Statements January February 315,000 (11,500 × $35) 402,500 Sales (9,000 × $35) Less: Cost of sales: Opening stock – (2,000 × $25) 50,000 Materials (11,000 × $12) 132,000 (9,500 × $12) 114,000 Labour (11,000 × $8) 88,000 (9,500 × $8) 76,000 55,000 47,500 Variable o/h (11,000 × $5) (9,500 × $5) 275,000 287,500 (50,000) – Less: Closing stock (2,000 × $27) 225,000 287,500 90,000 115,000 (9,000) (11,500) Less: Variable selling costs (9,000 × $1) (11,500 × $1) Contribution 81,000 103,500 Less: Fixed costs Production (20000) (20,000) Selling (2,000) (2,000) Actual Net Profit $59,000 $81,500 Answer to Example 2 January February Absorption costing 63,000 77,500 59,000 81,500 Marginal costing Difference 4,000 (4,000) Fixed overheads in stock value: Opening Stock (2,000 × $2) – (4,000) 4,000 – Closing stock (2,000 × $2) 4,000 (4,000)
  • 5. Answers to examples 123 Chapter 4 Answer to Example 1 (a) Total overheads $190,000 Total labour hours A 20,000 × 2 = 40,000 B 25,000 × 1 = 25,000 2,000 C 2,000 × 1 = 67,000hours 190,000 O.A.R. = = $2.836 per hour 67,000 Cost cards: A B C Materials 5 10 10 Labour 10 5 5 5.68 2.84 2.84 Overheads (at $2.84 per hr) 20.68 17.84 17.84 Selling price 20 20 20 $(0.68) $2.16 $2.16 Profit / Loss (b) Total A B C Set-up costs 90, 000 = 3, 600 ) (Cost per set up = 90,000 36,000 46,800 7,200 25 Receiving 30, 000 = 1, 364 ) (Cost per delivery = 30,000 13,636 13,636 2,728 22 Despatch 15, 000 (Cost per order = = 250 ) 15,000 5,000 5,000 5.000 60 Machining 55, 000 (Cost per machine hour: = 0.585 ) 55,000 23,404 29,256 2,340 94 , 000 190,000 78,040 94,692 17,268 Number of units 20,000 25,000 2,000 Overheads p.u. $3.90 $3.79 $8.63 Costings: A B C Materials 5 10 10 Labour 10 5 5 3.90 3.79 8.63 Overheads 18.90 18.79 23.63 Selling price 20 20 20 Profit / Loss $1.10 $1.21 $(3.63) Chapter 5 Answer to Example 1 Selling price = $20 p.u. Target return = 40% of selling price Target Cost = $12 p.u.
  • 6. 124 December 2008 examinations PaPer F2 Answer to Example 2 Target return = 30% × 5M = $1.5M p.u. Expected revenue = 40,000 × $67.50 = $2.7M 2.7M − 1.5 = £30 p.u. Target cost = 40, 000 Chapter 6 No Examples Chapter 7 Answer to Example 1 Raw materials and W.I.P $ $ b/f (150u × $14) 2,100 Raw materials 27,800 Transfer to finished goods (2,000u × $33) 66,000 Labour and overheads 39,000 Variance 1,500 c/f (100u × $14) 1,400 $68,900 $68,900 Finished Goods $ $ b/f (200u × $33) 6,600 Transfer from WIP 66,000 Cost of sales (2,100u × $33) 69,300 c/f (100u × $33) 3,300 $72,600 $72,600 Chapter 8 Answer to Example 1 A B Selling price 25 28 Materials 8 20 Other variable 12 4 20 24 Contribution p.u. 5 4 Machine hrs p.u. 2 1 Contribution per hour $2.50 $4 Production units hours 10,000 B: 10,000 × 1 hr = A: 19,000 × 2hrs = 38,000 hours 48,000
  • 7. Answers to examples 125 Profit $ 95,000 A: 19,000 × $5 B: 10,000 × $4 40,000 135,000 less Fixed costs: [A: 20,000 × $3 B: 10,000 × $2] 80,000 Profit $55,000 Answer to Example 2 A B 25 28 Selling price Materials 8 20 Throughput p.u. $17 $8 Machine hrs p.u. 2 1 Contribution per hour $8.50 $8 Production units hours 40,000 A: 20,000 × 2hrs = B: 8,000 × 1hr = 8,000 hours 48,000 Profit $ 340,000 A: 29,000 × $17 B: 8,000 × $8 64,000 404,000 less “fixed” costs: [A: 20,000 × $15 B: 10,000 × $6] 360,000 Profit $44,000 360,000 = $7.50 Cost per factory hour = $48,000 Throughput accounting ratios: 8.50 = 1.13 A: 7.50 8 = 1.07 B: 7.50
  • 8. 126 December 2008 examinations PaPer F2 Chapter 9 Answer to Example 1 Let S = number of standard chairs produced per week E = number of executive chairs produced per week Constraints: Materials: 2S + 4E ≤ 80 Labour: 5S + 6E ≤ 180 Demand: E ≤ 10 Non-negativity: S ≥ 0; E ≥ 0 Objective: Maximise C = 6S + 9E S 40 Feasible area: A,B,C, D, 0 30 B C 20 10 D 0 20 40 E 10 30 Maximum contribution occurs at point B (using the objective function). At B, 2S + 4E = 80 (1) 5S + 6E = 180 (2) (1) × 2.5: 5S + 10E = 200 (3) (3) – (2): 4E = 20 E=5 In (1): 2S + 20 = 80 2S = 60 S = 30 C = 6S + 9E = 180 + 45 = $225 Produce 5 Executive chairs and 30 standard chairs per week. Maximum contribution is $225 per week. Answer to Example 2 There is no spare material or labour The spare demand for executive chairs is 5 chairs (10 – 5)
  • 9. Answers to examples 127 Answer to Example 3 (a) If there was 1 more kg of material available, then the material constraint becomes: 2S + 4E ≤ 81 Point B will still be the optimum solution, and therefore this will be when: 2S + 4E = 81 (1) 5S + 6E = 180 (2) (1) × 2.5 5S + 10E = 202.5 (3) (3) – (2) 4E = 22.5 E = 5.625 in (1) 2S + 22.5 = 81 2S = 58.5 C = 6S +9E = 175.5 + 50.625 = 226.125 Shadow price of material = extra contribution = 226.125 – 225 = $1.125 per kg (b) If there was 1 more hour of labour available, then the labour constraint becomes: 5S + 6E ≤ 181 Point B will still be the optimum solution, and therefore this will be when: 2S + 4E = 80 (1) 5S + 6E = 181 (2) (1) × 2.5 5S + 10E = 200 (3) (3) – (2) 4E = 19 E = 4.75 in (1) 2S + 19 = 80 2S = 61 S = 30.5 C = 6S +9E = 183 + 42.75 = 225.75 Shadow price of labour = 225.75 – 225 = $0.75 per hour The shadow price of demand for executive chairs is $0, because there is already spare demand Chapter 10 Answer to Example 1 (a) Materials 10 Labour 8 Variable o/h 5 Fixed o/h (50,000 ÷ 10,000) 5 Full cost 28 Profit 5.60 Selling price $33.60 (b) Materials 10 Labour 8 Variable o/h 5 Marginal cost 23 Profit 9.20 Selling price $32.20
  • 10. 128 December 2008 examinations PaPer F2 Answer to Example 2 Total Marginal Marginal S.P. p.u. Demand Cost p.u. Total cost Total profit Revenue Revenue cost 16 100 14.0 1,600 1,400 200 1,600 1,400 15.5 200 13.9 3,100 2,780 320 1,500 1,380 15 300 13.8 4,500 4,140 360 1,400 1,360 14.5 400 13.7 5,800 5,480 320 1,300 1,340 14 500 13.6 7,000 6,800 200 1,200 1,320 13.5 600 13.5 8,100 8,100 - 1,100 1,300 13 700 13.4 9,100 9,380 (280) 1,000 1,280 Optimum selling price is $15 per unit Answer to Example 3 (a) 200 − 100 100 = 32 PED = 15.5 − 16 16 (b) 400 − 300 300 = 10 PED = 14.5 − 15 15 Answer to Example 4 Minimum price is £12 + 16, 000 × £1 = £18.40 2, 500 1 P = 18.40 − Q 2, 500 (or P = 18.40 − 0.0004 Q) Answer to Example 5 1 P = 50 − P = 50 − 0.01Q 100 R = PQ = 50Q − 0.01Q 2 dR = 50 - 0.02Q Marginal revenue = dQ dC =20 Total cost = dQ For maximum profit, MR = MC 50 – 0.02Q = 20 Q = 1,500 When Q = 1,500 P = 50 – 0.01Q = $35 p.u.
  • 11. Answers to examples 129 Chapter 11 Answer to Example 1 (a) Contribution = 150 – 120 = $30 p.u. Breakeven point = 54,000 = 1,800 units 30 Breakeven revenue = 1,800 u × $150 = $270,000 3,000 – 1,800 × 100 % = 40% (b) Margin of safety = 3,000 New Contribution: $ S.P. (150 × 1.1) 165 Var. cost (120 × 1.2) (144) Contribution $21 Total contribution 3,000 × 21= 63,000 Fixed overhead 54,000 Profit $9,000 Answer to Example 2 (a) Lost contribution from Rooks (15,000) Save fixed overheads 5,000 Net loss from ceasing Rooks 10,000 Therefore, should continue production of Rooks. (b) Lost contribution from Rooks (15,000) Save fixed overheads 5,000 Extra contribution from Crowners 20,000 Extra fixed costs of Crowthers (6,000) Net gain from ceasing Rooks 4,000 Therefore, should cease production of Rooks and produce Crowners instead. Answer to Example 3 Revised costs for special order: Notes $ Subcontractor costs 1 31,300 Supervisor costs 2 1,000 General overheads 3 1,000 Machine maintenance 4 500 Machine overheads 5 22,000 Materials 6 31,500 Interest costs 7 900 88,200 Notes: 1. The choice lies between the two subcontractor costs that have to be employed because of the shortage of existing labour. The minimum cost is to have subcontractors employed who are skilled in the special process. 2. Only the difference between the bonus and the incentive payment represents an additional cost that arises due to the special order. Fixed salary costs do not change. 3. Only incremental costs are relevant.
  • 12. 130 December 2008 examinations PaPer F2 4. Depreciation is a period cost and is not related to the special order. Additional maintenance costs are relevant. 5. The relevant costs are the variable overheads ($3 × 6000 hours) that will be incurred, plus the displacement costs of $2 × 2000 hours making a total of $22,000. 6. Since the materials are no longer used the replacement cost is irrelevant. The historic cost of $34,000 is a sunk cost. The relevant cost is the lost sale value of the stock used in the special order which is: 7,500 kg × $4.20 per kg = $31,500. 7. Full opportunity costing will also allow for imputed interest costs on the incremental loan. The correct interest rate is the overdraft rate since this represents the incremental cost the company will pay. Simple interest charges for three months are therefore: (3/12) × $20,000 × 18% = $900. Answer to Example 4 X Y Z Buy-in price 13 17 16 Cost to make 10 12 14 Saving (p.u.) $3 $5 $2 Kg of B 3 2 1 Saving per kg $1 $2.50 $2 RANKING Material B Units (kg) Y MAKE 2,500 5,000 3,000 Z MAKE 3,000 8,000kg Z BUY 1,000 X BUY 2,000 Chapter 12 Answer to Example 1 (a) Worst outcome from A: $10,000 Worst outcome from B: $20,000 Choose B, the best of the worst outcomes (b) Best outcome from A: $40,000 Best outcome from B: $24,000 Choose A, the best of the best outcomes (c) Expected NPV from A = (0.4 × 40,000 ) + (0.6 × 10,000) = $22,000 Expected NPV from B = (0.4 × 24,000 ) + (0.6 × 20,000) = $21,600 Choose A, the highest expected NPV Answer to Example 2 (a) Demand Contract 400u 500u 700u 900u size 300u 2,900 3,400 4,400 5,400 500u 3,500 4,000 5,000 5,000 700u 4,100 4,600 4,600 4,600 800u 4,400 4,400 4,400 4,400
  • 13. Answers to examples 131 (b) (i) Expected value if contract size = 300 units = (0.2 ×2,900) + (0.3 × 3,400) + (0.4 × 4,400) + (0.1 × 5,400) = $3,900 500 units = (0.2 × 3,500) + (0.3 × 4,000) + (0.5 × 5,000) = $4,400 700 units = (0.2 × 4,100) + (0.8 × 4,600) = $4,500 900 units = $4,400 Sign contract for 700 units (ii) maximin Worst outcome from: 300 units = $2,900 500 units = $3,500 700 units = $4,100 800 units = $4,400 Sign contract for 800 units (iii) Best outcome from 300 units = $5,400 500 units = $5,000 700 units = $4,600 800 units = $4,400 Sign contract for 300 units (iv) Regret table: Demand Contract 400u 500u 700u 900u size 300u 1,500 1,200 600 0 500u 900 600 0 400 700u 300 0 400 800 800u 0 200 600 1,000 Worst regret for 300 units = $1,500 500 units = $900 700 units = $800 800 units = $1,000 Sign contract for 700 units Chapter 13 Answer to Example 1 (a) Sales budget $ X 2,000u × $100 = 200,000 Y 4,000u × $130 = 520,000 450,000 Z 3,000u × $150 = $1,170,000 (b) Production budget X Y Z Sales 2,000 4,000 3,000 Opening stock (500) (800) (700) 600 1,000 800 Closing stock Production 2,100 u 4,200 u 3,100 u
  • 14. 132 December 2008 examinations PaPer F2 (c) Material usage budget Wood Varnish X 2,100u ×5= 10,500 ×2 4,200 Y 4,200u ×3= 12,600 ×2 8,400 6,200 3,100 Z 3,100u ×2= ×1 29,300 kg 15,700 litres (d) Materials purchases budget Wood Varnish Usage 29,300 15,700 Opening stock (21,000) (10,000) 18,000 9,000 Closing stock 26,300 kg 14,700 litres × $8 × $4 $210,400 $58,800 (e) Labour budget hours X 2,100u × 4 = 8,400 Y 4,200u × 6 = 25,200 24,800 Z 3,100u × 8 = 58,400 hours ×$3 $175,200 Answer to Example 2 Flexed Actual Variances Sales 12,000u 12,000 u Production 12,000u 12,000 u 120,000 122,000 Sales 2,000 (F) Materials – 60,000 60,000 Labour 30,000 28,500 1,500 (F) 15,000 15,000 Variable o/h – 105,000 103,500 Contribution 15,000 18,500 10,000 11,000 1,000 (A) Fixed o/h Profit $5,000 $7,500 $2,500 (F) Statement $ Original budget contribution (10,000u × $1.25) 12,500 2,500 (F) Sales volume variance (2,000 × $1.25) 15,000 2,000 (F) Sales price variance 1,500 (F) Labour variance Actual contribution 18,500 Fixed overheads Budget 10,000 1,000 (A) 11,000 Variance Actual profit $7,500
  • 15. Answers to examples 133 Chapter 14 Answer to Example 1 u $ High 700 85,000 Low 100 40,000 600u $45,000 45,000 = $75 Variable cost = 600 For high: Total cost = 85,000 Variable cost (700u @ $75) 52,500 Fixed cost $32,500 Answer to Example 2 x y xy x2 y2 1 40 40 1 1,600 4 65 260 16 4,225 2 45 90 4 2,025 7 85 595 49 7,225 6 70 420 36 4,900 5 70 350 25 4,900 3 50 150 9 2,500 28 425 1,905 140 27,375 Σx Σy Σxy Σx2 Σy2 n ∑ xy −∑ x ∑ y b= n ∑ x 2 −( ∑ x ) 2 7×1, 905 − 28×425 = 7×140 − 282 1, 435 = 7.321 = 196 ∑ y − b∑ x a= n n 425 7.321×28 = 31.430 = − 7 7 y = 31.430 + 73.21x Answer to Example 3 n∑ xy −∑ x ∑ y r= (n∑ x −(∑ x) (n∑ y −(∑ y) )) 2 2 2 2 (7×1, 905)−(28×425) = (((7×140)−(28) )((7×27, 375)−(425) )) 2 2 1, 435 = 0.977 = 196×11, 00
  • 16. 134 December 2008 examinations PaPer F2 Answer to Example 4 Moving Trend Seasonal % variation Average Variation 2000 1 80 2 87 84.75 3 82 87.25 86 -4 95.3 4 90 89.25 88.25 + 1.75 102.0 2001 1 90 92 90.62 - 0.62 99.3 2 95 95 93.5 +1.5 101.6 3 93 98.75 96.87 - 3.87 96.0 4 102 103 100.87 +1.13 101.1 2002 1 105 105.5 104.25 +0.75 100.7 2 112 109 107.25 +4.75 104.4 3 103 4 116 1 2 3 4 2000 - - -4 + 1.75 2001 - 0.62 + 1.5 - 3.87 + 1.13 2002 + 0.95 + 4.75 - - Total + 0.13 + 6.25 - 7.87 + 2.88 Averages + 0.06 + 3.12 - 3.93 + 1.44 Answer to Example 5 1 2 3 4 2000 - - 95.3 102.0 2001 99.3 101.6 96.0 101.1 2002 100.7 104.4 - - Total 200 206 191.3 203.1 Averages 100% 103% 95.6% 101.5% Answer to Example 6 Average units Total time time 1 100 100 2 75 150 4 56.25 225 8 42.1875 337.5 hours Time for 8 337.5 Time for first 100 Time for additional 7 237.5 hours Answer to Example 7 (a) log 0.85 b= = −0.2345 log 2 y = axb for 16 batches y = 200 × 16-02345 = 104.3912 Total time for 16 = 16 × 104.4 = 1,670 hours Time for first = 200 hours Time for next 15 = 1,470 hours
  • 17. Answers to examples 135 (b) Average time for 30 = 200 × 30-0.2345 = 90.08 Total time for 30 = 30 × 90.08 = 2,703 hours Average time for 29 = 200 × 29-0.2345 = 90.80 Total time for 29 = 29 × 90.80 = 2,633 hours Time for 30th = 2,703 – 2,633 = 70 hours Chapter 15 Answer to Example 1 Original Flexed Actual Variances Fixed Budget Budget $ $ $ Sales (units) 8,000 8,400 8,400 Production (units) 8,700 8,900 8,900 600,000 630,000 613,200 Sales 16,800 (A) Materials 3,255 (A) 156,600 160,200 163,455 Labour 217,500 222,500 224,515 2,015 (A) Variable o/h 87,000 89,000 87,348 1,652 (F) 130,500 133,500 134,074 Fixed o/h 574 (A) 591,600 605,200 609,392 (47,600) (34,000) (34,000) Closing stock 544,000 571,200 575,392 Profit $56,000 $58,800 $37,808 20,992 (A) Answer to Example 2 Materials Expense variance Actual purchases at actual cost 163,455 35,464kg at standard cost 159,588 ($4.50) $3,867 (A) Usage variance kg Actual usage 35,464 Standard usage for actual production 35,600 (8,900 u × 4kg) 136kg at a standard cost ($4.50) = $612 (F) Labour Rate of Pay variance Actual hours paid at actual cost 224,515 227,000 45,400 hours at standard cost ($5) $2,485 (F) Idle Time Variance Actual hours paid 45,400 44,100 Actual hours worked 1,300 hrs at a standard cost ($5) = $6,500 (A)
  • 18. 136 December 2008 examinations PaPer F2 Efficiency variance Actual hours worked 44,100 Standard hours for actual production 44,500 (8,900 u × 5hrs) 400 hrs at a standard cost ($5) = $2,000 (F) Variable overheads Expenditure variance Actual hours worked at actual cost 87,348 88,200 44,100 at standard cost $852 (F) Efficiency variance Actual hours worked 44,100 Standard hours for actual production 44,500 (8,900u × 5hrs) 400 hrs at a standard cost ($2) = $800 (F) Fixed overheads Expenditure variance Actual total 134,074 130,500 Original budget total $3,574 (A) Capacity variance Actual hours worked 44,100 43,500 Budget hours (8,700u × 5hrs) 600 hrs at a standard cost ($3) = $1,800 (F) Efficiency variance Actual hours worked 44,100 Standard hours for actual production 44,500 (8,900u × 5hrs) 400 hrs at a standard cost ($3) = $1,200 (F) Operating Statement $ Original budget profit 56,000 2,800 Sales – volume variance (F) 58,800 Sales – price variance (16,800) (A) Materials – expense variance (3,867) (A) – usage variance 612 (F) Labour – rate of pay variance 2,485 (F) – idle time variance (6,500) (A) – efficiency variance 2,000 (F) Variable o/hs – expense variance 852 (F) – efficiency variance 800 (F) Fixed o/hs – expense variance (3,574) (A) – capacity variance 1,800 (F) 1,200 – efficiency variance (F) Actual profit $37,808
  • 19. Answers to examples 137 Answer to Example 3 No Answer Answer to Example 4 No Answer Chapter 16 Answer to Example 1 Cost cards: Original Revised $p.u. $p.u. Materials (1 litre @ $1 per litre) 1.00 (1.2 litres @$0.95 per litre) 1.14 Labour (2hrs @ $2.50 per hr) 5.00 (2 hrs @$2.60 per hr) 5.20 1.40 1.40 Variable overheads 7.40 7.74 Selling price 16.00 16.00 Standard contribution 8.60 8.26 Operating statement Original budget contribution (5,000u × $8.60) 43,000 5,830(A) Planning Variance (balancing figure) Revised budget contribution (4,500u × $8.26) 37,170 Operational variances 4,956(F) Sales volume variance ((5,100u – 4,500u) × $8.26) 42,126 Sales price variance (81,000 – (5,100 × 16)) 600(A) Materials expense variance (5,120 – (5150 × 0.95)) 227.5(A) Materials usage variance (5,150 – (5,200 × 1.2)) × 0.95 1035.5(F) Labour rate variance (27,400 – (10,200 × 2.60) 880(A) Labour efficiency variance (10,200 – (5,200 × 2)) × 2.60 520(F) Variable overhead variance (7,000 – (5,200 × 1.40)) 280(F) Actual contribution 42,254 Less: Fixed overheads Budget 20,000 19,500 Variance 500(F) Actual profit $22,754 Answer to Example 2 Total materials cost variance Actual total cost (27,000 + 11,000) 38,000 40,000 Standard total cost (5,000 × $8) Total cost variance $2,000(F)
  • 20. 138 December 2008 examinations PaPer F2 Materials price variance Actual Actual Actual Standard purchases cost purchases cost kg $ kg $ X 9,900 27,000 9,900 29,700 11,000 10,600 Y 5,300 5,300 38,000 40,300 Price variable = 38,000 – 40,300 = $2,300 (F) Mix variance Actual Standard Standard Standard purchases cost mix cost kg $ kg $ X 9,900 29,700 (⅔) 10,133 30,399 5,300 10,600 (⅓) 5,067 10,134 Y 15,200kg 40,300 15,200kg 40,533 Mix variance = 40,300 – 40,533 = 233 (F) Yield variance Standard mix Standard Standard Standard cost mix cost (actual total) kg $ kg $ X 10,133 30,399 10,000 30,000 5,067 10,134 5,000 10,000 Y 15,200kg 40,533 15,000kg 40,000 Yield variance = 40,533 – 40,000 = 533 (A) (Usage variance = Yield variance + Mix variance = 533 (A) + 233 (F) = 300 (A)) Answer to Example 3 Total sales margin variance Budget profit: A 200u × (20 – 17) 600 B 100u × (25 – 21) = 400 600 C 100u × (30 – 24) = 1,600 Actual profit (using standard costs): A 180u × (22 – 17) 900 B 150u × (22 – 21) = 150 340 C 107u × (26 – 24) = 1,390 Total variance = 1,390 – 1,600 = $210 (A) Sales price variance Actual Standard Actual sales Actual sales S.P. S.P. u $ u $ A 180 × 22 = 3,960 180 × 20 = 3,600 B 150 × 22 = 3,300 150 × 25 = 3,750 4,420 5,100 C 170 × 26 = 170 × 30 = 11,680 12,450 Sales price variance = 11,680 – 12,450 = $770 (A) Sales mix variance
  • 21. Answers to examples 139 Actual Standard Actual sales Actual sales S.P. S.P. u $ u $ A 180 × $3 = 540 (2/4) 250 × $3 = 750 B 150 × $4 = 600 (1/4) 125 × $4 = 500 C 170 × $6 = 1,020 (1/4) 125 × $6 = 750 500 2,160 500 2,000 Mix variance = 2,160 – 2,000 = $160 (F) Sales quantity variance Standard mix Standard Standard Budget (actual total) Profit profit u $ u $ A 250 × $3 = 750 200 × $3 = 600 B 125 × $4 = 500 100 × $4 = 400 C 125 × $6 = 750 100 × $6 = 600 500 2,000 400 1,600 Quantity variance = 20,000 – 1,600 = $400 (F) Answer to Example 4 (a) Each unit takes 7.6 hours to make, and therefore the company expects to need to pay for 7.6/.95 = 8 hours of labour. 8 hours at the rate of $5.70 per hour gives a standard cost of $45.60 per unit (b) Each unit should take 7.6 hours to produce, and should cost $45.60 for labour. Therefore, the effective standard cost per hour worked is 45.60 / 7.6 = $6.00 c) Total labour variance: Actual cost of production: 50,020 Standard cost of actual production (1,000 units at $45.60) 45,600 4,420 (A) Total variance d) Rate of pay variance: Actual amount paid 50,020 Standard cost of actual hours paid (8,200 hours at $5.70) 46,740 3,280 (A) Total variance Idle time variance: Actual idle hours (8,200 – 7,740) 460 hours Standard idle time (8,200 × 5%) 410 hours Excess idle time 50 hours $300 (A) Idle time variance: 50 hours at $6.00 = Efficiency variance: Actual hours worked 7,740 hours Standard hours worked for actual Production: 1000 units × 7.6 hours = 7,600 hours Idle time variance: 50 hours at $6.00 = 140 hours $840 (A) Efficiency variance: 140 hours × $6 = (Check: Rate of pay 3,280 (A) Excess idle time 300 (A) Efficiency 840 (A) 4,420 hours Total
  • 22. 140 December 2008 examinations PaPer F2 Chapter 17 Answer to Example 1 2007 2006 790 ( ) Net profit margin 11% 8.5% 7, 180 1, 795 ( ) Gross profit margin 25% 22.5% 7, 180 790 ( ) Return on capital employed 29.4% 25.7% 2, 690 478 ( ) Return on equity capital 21.8% 19% 2, 190 7, 180 ( ) Asset turnover 2.67 3.02 2, 690 2, 314 ( ) Current ratio 2.4 2.4 965 1, 308 ( ) Quick ratio (or acid test) 1.36 1.15 965 1, 006 ( × 365) Inventory turnover 68.2 days 75.5 days 5, 385 948 ( × 365) Receivables days 48.2 days 47.5 days 7, 180 653 ( × 365) Payables days 44.3 days 44.7 days 5, 385 500 ( ) Gearing ratio 22.8% 28.6% 2, 190 478 ( ) Earnings per share $0.40 $0.37 1, 200 P/E ratio 5.75 5.41 169 ÷ 1, 200 ( ) Dividend yield 6.12% 6.60% 230 790 ( ) Interest cover 15.8 8.88 50 Chapter 18 No Examples
  • 23. Answers to examples 141 Chapter 19 Answer to Example 1 17,000 = 17% Return from new project = 100,000 (a) For company: 17% > 15% (target) Therefore company wants to accept (b) For division 82,000 ROI (without project) = 16.4% 500,000 82,000 + 17,000 ROI (with project) = 16.5% 500,000 + 100,000 ROI of division increases therefore divisional manager motivated to accept. Answer to Example 2 16,000 Return from new project = = 16% 100,000 (a) For company: 16% > 15% Company wants to accept (b) For division: ROI (without project) =16.4% 82,000 + 16,000 ROI (with project) = 16.3% 500,000 + 100,000 Answer to Example 3 (1) RI (without project) Profit 82,000 Less: Interest 15% × 500,000 (75,000) $7,000 RI (with project) Profit 99,000 Less: Interest 15% × 600,000 90,000 $9,000 $9,000 > $7,000 manager motivated to accept (2) RI (without project) $7,000 ROI (with project) Profit 98,000 Less: Interest 15% × 600,000 90,000 $8,000 $8,000 > $7,000 manager motivated to accept In both cases the decisions are goal congruent
  • 24. 142 December 2008 examinations PaPer F5 Chapter 20 Answer to Example 1 (a) Selling price 20 Costs: A 10 B 4 14 Profit $6 (b) A B Total Profit 12 Selling price 20 Cost 10 Total Profit 12 Profit $2 Costs 4 16 Profit $4 Answer to Example 2 (a) Transfer price = 15 × 1.2 = $18 p.u. (b) Selling price 30 Costs: A 15 B 5 20 Profit $10 (c) A B Total Profit 18 Selling price 30 Cost 15 Total Profit 18 Profit $3 Costs 5 23 Profit $7 Answer to Example 3 (a) Transfer price = 20 × 1.2 = $24 p.u. (b) Selling price 30 Costs: A 20 B 8 28 Profit $2 (c) A B Total Profit 24 Selling price 30 Cost 20 Total Profit 24 Profit $4 Costs 8 32 Profit $(2) Answer to Example 4 For A: T.P. > 20 For B: T.P. < 30 - 8 < 22 Sensible T.P. between $20 and $22 p.u. Answer to Example 5 For A: T.P. > 15 For B: T.P. < 35 - 10 < 25 Sensible range between $15 and $25 p.u. For latest news and course notes updates please visit www.opentuition.com
  • 25. Answers to examples 143 Answer to Example 6 For A: T.P. > 20 For B: T.P. < 25 (as in previous example) < 22 Sensible range. between $20 and $22 p.u. Answer to Example 7 (a) For A: T.P. >8 For B: T.P. < 14 Sensible range between $8 and $14 p.u. (b) For A: T.P. >8 For B: T.P. < 20 – 4 < 16 Sensible range between $8 and $16 p.u. Answer to Example 8 X Y Contribution $20 $30 Hours 5 10 Contribution per hour $4 $3 Therefore, if no transfers to B then A would sell exactly and generate $4 per hour contribution. To make transfers of Y worthwhile, A need to charge at least 70 + (10 × 4) = $110 p.u. Chapter 21 No Examples
  • 26. 144 December 2008 examinations PaPer F5 For latest news and course notes updates please visit www.opentuition.com