International Journal of Engineering Research and Development
•
2 gefällt mir•648 views

Electrical, Electronics and Computer Engineering, Information Engineering and Technology, Mechanical, Industrial and Manufacturing Engineering, Automation and Mechatronics Engineering, Material and Chemical Engineering, Civil and Architecture Engineering, Biotechnology and Bio Engineering, Environmental Engineering, Petroleum and Mining Engineering, Marine and Agriculture engineering, Aerospace Engineering.

Empfohlen
Empfohlen
Weitere ähnliche Inhalte
Was ist angesagt?
Was ist angesagt? (20)
Andere mochten auch
Andere mochten auch (18)
Ähnlich wie International Journal of Engineering Research and Development
Ähnlich wie International Journal of Engineering Research and Development (20)
Mehr von IJERD Editor
Mehr von IJERD Editor (20)
Kürzlich hochgeladen
Kürzlich hochgeladen (20)
International Journal of Engineering Research and Development
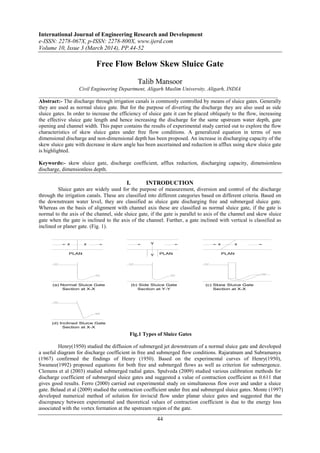
- 1. International Journal of Engineering Research and Development e-ISSN: 2278-067X, p-ISSN: 2278-800X, www.ijerd.com Volume 10, Issue 3 (March 2014), PP.44-52 44 Free Flow Below Skew Sluice Gate Talib Mansoor Civil Engineering Department, Aligarh Muslim University, Aligarh, INDIA _________________________________________________________________________________________ Abstract:- The discharge through irrigation canals is commonly controlled by means of sluice gates. Generally they are used as normal sluice gate. But for the purpose of diverting the discharge they are also used as side sluice gates. In order to increase the efficiency of sluice gate it can be placed obliquely to the flow, increasing the effective sluice gate length and hence increasing the discharge for the same upstream water depth, gate opening and channel width. This paper contains the results of experimental study carried out to explore the flow characteristics of skew sluice gates under free flow conditions. A generalized equation in terms of non dimensional discharge and non-dimensional depth has been proposed. An increase in discharging capacity of the skew sluice gate with decrease in skew angle has been ascertained and reduction in afflux using skew sluice gate is highlighted. Keywords:- skew sluice gate, discharge coefficient, afflux reduction, discharging capacity, dimensionless discharge, dimensionless depth. I. INTRODUCTION Sluice gates are widely used for the purpose of measurement, diversion and control of the discharge through the irrigation canals. These are classified into different categories based on different criteria. Based on the downstream water level, they are classified as sluice gate discharging free and submerged sluice gate. Whereas on the basis of alignment with channel axis these are classified as normal sluice gate, if the gate is normal to the axis of the channel, side sluice gate, if the gate is parallel to axis of the channel and skew sluice gate when the gate is inclined to the axis of the channel. Further, a gate inclined with vertical is classified as inclined or planer gate. (Fig. 1). x x Y Y x x PLAN PLAN PLAN (a) Normal Sluice Gate Section at X-X (b) Side Sluice Gate Section at Y-Y (c) Skew Sluice Gate Section at X-X (d) Inclined Sluice Gate Section at X-X Fig.1 Types of Sluice Gates Henry(1950) studied the diffusion of submerged jet downstream of a normal sluice gate and developed a useful diagram for discharge coefficient in free and submerged flow conditions. Rajaratnam and Subramanya (1967) confirmed the findings of Henry (1950). Based on the experimental curves of Henry(1950), Swamee(1992) proposed equations for both free and submerged flows as well as criterion for submergence. Clemens et al (2003) studied submerged radial gates. Spulveda (2009) studied various calibration methods for discharge coefficient of submerged sluice gates and suggested a value of contraction coefficient as 0.611 that gives good results. Ferro (2000) carried out experimental study on simultaneous flow over and under a sluice gate. Belaud et al (2009) studied the contraction coefficient under free and submerged sluice gates. Monte (1997) developed numerical method of solution for inviscid flow under planar sluice gates and suggested that the discrepancy between experimental and theoretical values of contraction coefficient is due to the energy loss associated with the vortex formation at the upstream region of the gate.
- 2. Free Flow Below Skew Sluice Gate 45 The side sluice gates and skew sluice gates are often used to divert the discharge in the side channel in irrigation, urban sewage system and during flood operation. Little published work namely Panda (1981), Swamee et al (1993), and Ghodsian (2003) is available on side sluice gates. On skew sluice gates, Swamee et al (2000) conducted experimental study under free and submerged flow conditions covering a wide range of hydraulic parameters. The details of the work are also available in Mansoor (1999). They proposed equation for elementary discharge coefficient that can be used to compute the discharge through sluice gate having any plan shape. In this paper an attempt has been made to develop a simple generalized equation for discharge coefficient and to investigate the increase in discharging capacity and reduction in afflux with the use of skew sluice gate in free flow conditions. II. DIMENSIONAL ANALYSIS The functional relationship for the discharge, Q through a skew sluice gate can be written as: (1) where, ρ = Density of water, μ = Kinematic Viscosity of water, g = gravity acceleration, y = water depth at the upstream, B = channel width, σ = surface tension of water, θ = skew angle, and L = length of skew sluice gate. From Eq. (1) dimensionless ratios that describe the discharge function can be formed as follows: (2) The dependent ratio in Eq. (2) is a coefficient of discharge. The first three independent ratios describe the geometry of the flow boundaries, and the last two symbols represent the Reynolds and Weber numbers. Since their effect on discharge is not appreciable, they can be dropped and the coefficient of discharge can be defined as: (3) The first ratio L/B is simply a measure of alignment of sluice gate i.e. oblique angle. The second ratio y/L can be described as alignment parameter. Slight increase in sluice gate length, L reduces the upstream depth, y. The last ratio y/a is a measure of the depth contraction characteristic of the sluice gate. Eq. (3) can be written in its general form as: (4) III. EXPERIMENTAL SET -UP Experiments were conducted in a rectangular brick masonry channel plastered with cement. The channel was 9.0 m long, 0.5m wide and 0.6m having nearly horizontal bed. The sharp crested sluice gates were made of 5mm thick mild steel plate and a chamfer of 450 was provide at the downstream face to obtain a crest thickness of 1mm. These sluice gates were installed at angles θ = 150 , 300 , 450 , 600 and 750 with respect to channel axis. Water was supplied to the channel from an over head tank maintained at constant head using overflow arrangement. Smooth, undisturbed, steady-uniform flow was obtained by making the water to flow through brick screen. Wooden float was tied to brick screen to dampen the surface waves. The experimental set up is shown in Fig. 2. The depth at the upstream of sluice gate was measured using a point gauge (0.1mm accuracy) located on the channel axis at a distance of about 1.50m on upstream of the skew sluice gate. Discharge flowing through sluice gate was measured with the help of a calibrated rectangular weir provided at the end of the drain. Water after running through the experimental setup was collected in an underground sump from which it was re- circulated by lifting it up to the overhead tank. The range of parameters covered is given in Table - I. Table I Range of parameters S. No. Skew angle θ (rad) Gate opening a (m) Discharge Q (m3/s) Depth y (m) No. of runs 1 π/4 0.01–0.06 0.005–0.062 0.077–0.572 77 2 π/3 0.01–0.05 0.004–0.053 0.060–0.562 102 3 5π/12 0.01–0.05 0.004–0.045 0.086–0.574 87
- 3. Free Flow Below Skew Sluice Gate 46 0.50 m X 9.00 m 0.60 m Wooden Float Grid Walls Inlet Pipe Skew Sluice Gate Main Channel Drain 0.60 m deep Section at X-X Plan X Skew Sluice Gate Fig.2 Experimental Set-up IV. ANALYSIS OF DATA AND DISCUSSION Experimental data collected in the laboratory for various skew sluice gates have been analysed to study the effects of various flow and geometrical parameters on discharge coefficient. Variation of Q with upstream depth y is depicted in Figs. 3 - 5. From these graphs it is clear that there is a separate curves for each gate opening a with higher opening at the top. Using Eq. (4) Cd was computed for each data set and graphs drawn in Fig. 6 - 8 again show different curves for each gate opening. The best fit equations for discharge coefficient obtained from these graphs could not be converted into single generalized equation due much scatter in coefficient and exponents. In order to obtain a simple generalized equation for discharge coefficient eq. (4) was written in terms of dimensionless discharge and dimensionless depth in the following manner: Dividing both sides of (4) by and rearranging the terms (5) It can be written as (6) where and The data were converted in the form of dimensionless discharge and dimensionless depth and graphs were drawn between Qn and Yn as shown in Figs. 9 - 11. It is clear from these figures that the data points represent a best fit trend with large RMS value of 0.99. Following equation were obtained for skew angle π/4, π/3 and 5π/12 respectively. (7) (8) (9) Above three equations can be written in a generalized form as: (10) where and θ is in radians. The values of exponent m in eqs. (7) - (9) are very close to 0.6. Thus assuming a value of 0.6 for m will not add significant error. Therefore, generalized equation for discharge through skew sluice gate can be expressed as: (11) Comparing (6) and (11) generalized equation for discharge coefficient of skew sluice gate in free flow condition can be written as: (12) A. Accuracy of generalized equation For the data set of each skew angle, dimensionless discharge values were computed using (11). These computed values were plotted against the observed values as shown in Fig. 12. It is evident from this figure that most of the data points lie within a tolerance limit of ±5%.
- 4. Free Flow Below Skew Sluice Gate 47 B. Efficiency of skew sluice gate In order to examine the efficiency of skew sluice gate, the ratio of discharges through a skew sluice gate and a normal sluice gate Q /Qnormal fitted in the same channel and operating under the same hydraulic conditions were computed and plotted against y/a as shown in Fig. 13. A perusal of this figure indicate that the ratio Q /Qnormal remains almost constant with y/a and there is gain of 40% , 20% and 10% respectively for skew angles of π/4 , π/3 and 5π/12. C. Reduction in afflux Afflux is defined as the maximum increase in water level at the upstream due to the presence of a hydraulic structure in a channel. Reduction in afflux can be written as Δy = y - ynormal where y and ynormal are the depths at the upstream of a skew sluice gate and normal sluice gate respectively when both are having the same gate opening and passing the same discharge. Percentage reduction in afflux can be written as: % Δy = For a gate opening of 5cm, values of % Δy were computed for different values of discharge for various skew sluice gates and a diagram was prepared between Q and % Δy as shown in Fig. 14. It is clear from Fig. 14 that afflux reduction is maximum in case of least skew angle. At a discharge of 0.05 m3 /s, percentage reduction in afflux is 43%, 26% and 8% respectively for 450 , 600 and 750 skew sluice gate. V. CONCLUSIONS A simple generalized equation for discharge coefficient for skew sluice gate in free flow condition has been proposed that can be used to find Cd for any value of θ in the specified range of parameters. Using this equation discharge through skew sluice gate can be obtained within an accuracy of ±5%. Larger flow area below skew sluice gate is available for the same upstream depth relative to conventional normal sluice gate and this reduces the afflux on the upstream. Thus the requirement of free board in the channel gets reduced. REFERENCES [1] Belaud G., Cassan, L., and Baume, J. P. 2009. "Calculation of contraction coefficient under sluice gates and application to discharge measurement,". ASCE J of Hydraul. Eng., 135(12).1086-1091. [2] Clemens A. J., Strelkoff, T. S., and Replgle, J. A. 2003. Calibration of submerged radial gates. ASCE J of Hydraul. Eng. 129(9). 680-687. [3]. Ferro, V. 2000. Simultaneous flow over and under a gate. ASCE J of Irrig. and Drain Eng. 126(3). 190-193. [4]. Ghodsian, M. 2003. Flow through side sluice gates, ASCE J of Irrig. and Drain Eng. 129(6). 458-463. [5]. Henry, H. R. 1950. Discussion of Diffusion of submerged jets, Trans. Proc. ASCE. Vol. 115. 687-697. [6] Mansoor, T. 1999. Study of skew weirs and sluice gates. Ph. D. Thesis. Univ. of Roorkee. Roorkee. India (Presently IIT. Roorkee. [7]. Panda, S. 1981.Characteristics of side sluice flow. M. E. Thesis. Univ. of Roorkee. Roorkee. India (Presently IIT. Roorkee) [8]. Rajaratnam, N. and Subramanya, K. 1967. Flow equation for the sluice gate. ASCE J. of Irrig. and Drain. Eng. 93(4). 167-186. [9] Rajaratnam, N., Free flow immediately below sluice gates. 1977. ASCE J. Hydraul Eng. 103(4). 345- 351. [10]. Spulveda , C.,Gomez, M. and Rodellar. (2009).J. Benchmark of discharge calibration methods for submerged sluice gates. ASCE J of Irrig. and Drain Eng., 135(5). 676-682. [11] Swamee, P. K. 1992. Sluice gate discharge equations. ASCE J of Irrig. and Drain Eng., 118(1). 56-60. [12] Swamee , P. K., Pathak, S. K. and Ali, M. S. (1993). Analysis of rectangular side sluice gate. ASCE J of Irrig. and Drain Eng. 119(6). 1026-1035. [13] Swamee, P. K., Pathak, S. K. Mansoor, T., and Ojha. C. S. P. 2000. Discharge Characteristics of skew sluice gates. ASCE J of Irrig. and Drain Eng. 126(5). 328-334.
- 5. Free Flow Below Skew Sluice Gate 48 Notations The following symbols are used in this paper: a = sluice gate opening height (L); A= coefficient; B = channel width (L); Cd = discharge coefficient (nondimensional); g = gravitational acceleration (LT -2 ); L=length of skew slice gate(L); m=exponent; Q = discharge (L3 T-2 ); Qnormal = discharge through normal sluice gate (L3 T-2 ); Qn = dimensionless discharge (L3 T-2 ); R = Reynolds Number; W= Weber Number; y = depth of flow (L); Δy = reduction in afflux (L); Yn= dimensionless depth of flow (L); θ = sluice gate angle (nondimensional). µ= dynamic viscosity of water ρ= mass density of water Fig. 3 Variation of Q verses y for θ = 450 Fig. 4 Variation of Q verses y for θ = 600
- 6. Free Flow Below Skew Sluice Gate 49 Fig. 5 Variation of Q verses y for θ = 750 Fig. 6 Variation of Cd vs y/a for θ = 450 Fig. 7 Variation of Cd vs y/a for θ = 600
- 7. Free Flow Below Skew Sluice Gate 50 Fig. 8 Variation of Cd vs y/a for θ = 750 Fig. 9 Variation of Qn vs yn for θ = 450 Fig. 10 Variation of Qn vs yn for θ = 600
- 8. Free Flow Below Skew Sluice Gate 51 Fig. 11 Variation of Qn vs yn for θ = 750 Fig 12 Comparison of computed and observed dimensionless discharges Fig 13 Comparison of Q/Qnormal with y/a for a=4cm
- 9. Free Flow Below Skew Sluice Gate 52 Fig 14 Variation of % afflux reduction with discharge