Me2521122119
•
0 likes•653 views

IJERA (International journal of Engineering Research and Applications) is International online, ... peer reviewed journal. For more detail or submit your article, please visit www.ijera.com

Recommended
Recommended
More Related Content
What's hot
What's hot (19)
Viewers also liked
Viewers also liked (20)
Similar to Me2521122119
Similar to Me2521122119 (20)
Recently uploaded
Recently uploaded (20)
Me2521122119
- 1. Dikendra Verma, Sanjay Mathur / International Journal of Engineering Research and Applications (IJERA) ISSN: 2248-9622 www.ijera.com Vol. 2, Issue 5, September- October 2012, pp.2112-2119 Image Denoising Based On Averaging Of Two Wavelet Transformed Images Dikendra Verma *, Sanjay Mathur ** *(Electronics & Communication Engineering Department, College of Technology, GBPUA&T Pantnagar ** (Electronics & Communication Engineering Department, College of Technology, GBPUA&T Pantnagar (India) ABSTRACT When the signal in the form of image is processing techniques involve treating the image as processed, it gets distorted and further processing a two-dimensional signal and applying standard does not provide good results. Hence it is very signal-processing techniques to it. There are important to get back the image in its original applications in image processing that require the noise free condition. In this paper we present an analysis to be localized in the spatial domain. The image denoising method for noise removal. In this term spatial domain refers to the image plane itself, work, a wavelet-based multiscale linear minimum and approaches in this category are based on direct mean square-error estimation (LMMSE) scheme manipulation of pixels in an image. Transform for image denoising is proposed. In order to domain processing techniques are based on achieve this undecimated wavelet transforms modifying the Fourier or wavelet transform of an (UWT) have been applied to the image. We use image. The classical way of doing this is through two wavelet filters and generate two wavelet what is called Windowed Fourier Transform. Central transformed images for each filter. Average of idea of windowing is reflected in Short Time Fourier these two transformed images is used to generate Transform (STFT). The STFT conveys the localized a new image which is visually pleasing as frequency component present in the signal during compared to individual filtered image. It is also the short window of time. The same concept can be shown quantitatively by PSNR and MSE value. extended to a two-dimensional spatial image where Experiments show that the proposed scheme the localized frequency components may be outperforms some existing denoising methods. determined from the windowed transform. This is one of the bases of the conceptual understanding of Keywords - bior1.3, db2, image processing, wavelet transforms. Hence, wavelet transforms have LMMSE, UWT been kept as the main consideration in this paper. Denoising of natural images corrupted by noise 1. INTRODUCTION using wavelet techniques is very effective because of Each imaging system suffers with a its ability to capture the energy of a signal in few common problem of “Noise”. Unwanted data which energy transform values. The wavelet denoising may reduce the contrast deteriorating the shape or scheme thresholds the wavelet coefficients arising size of objects in the image and blurring of edges or from the wavelet transform. The wavelet transform dilution of fine details in the image may be termed yields a large number of small coefficients and a as noise. It may be due to one or more of the small number of large coefficients. Simple de- following reasons, physical nature of the system, noising algorithms that use the wavelet transform shortcomings of image acquisition devices, image consist of three steps. developing mechanism and due to environment. Calculate the wavelet transform of the Mathematically there are two basic models of Noise, noisy signal. additive and multiplicative. Additive noise is Modify the noisy wavelet coefficients systematic in nature and can be easily modeled and according to some rule. hence removed or reduced easily. Whereas Compute the inverse transform using the multiplicative noise is image dependent, complex to modified coefficients. model and hence difficult to reduce. Suppressing such noise is, thus, the usual first step. Thus, The problem of Image de-noising can be denoising is often a necessary and the first step to be summarized as follows. Let A(i, j) be the noise-free taken before the images data is analyzed. It is image and B(i, j) the image corrupted with noise Z(i, necessary to apply an efficient denoising technique j) , B(i, j) = A(i, j) +σZ(i, j). The problem is to to compensate for such data corruption. Image estimate the desired signal as accurately as possible denoising still remains a challenge for researchers according to some criteria. In the wavelet domain, because noise removal introduces artifacts and the problem can be formulated as Y(i, j) =W(i, j) + causes blurring of the images. Most image N(i, j). Where Y(i, j) is noisy wavelet coefficient, 2112 | P a g e
- 2. Dikendra Verma, Sanjay Mathur / International Journal of Engineering Research and Applications (IJERA) ISSN: 2248-9622 www.ijera.com Vol. 2, Issue 5, September- October 2012, pp.2112-2119 W(i, j) is true coefficient and N(i, j) noise. The the wavelet coefficients at adjacent scales would wavelet transform has proved to be very successful strengthen the significant structures while diluting in making signal and noise components of the signal noise. Such a property has been exploited for distinct. As wavelets have compact support the denoising. wavelet coefficients resulting from the signal are In this paper we have taken two wavelet localized, whereas the coefficients resulting from filter biorthogonal (bior1.3) and Daubechies (db2) noise in the signal are distributed. Thus the energy and reconstructed the image individual filter. Now from the signal is directed into a limited number of the average of two reconstructed images and coefficients which „stand out‟ from the noise. generate the new image which is superior then Wavelet denoising must not be confused with individually generated images. The LMMSE based smoothing; smoothing only removes the high denoising technique with the assistance of UWT frequencies and retains the lower ones. Wavelet (undecimated wavelet transforms) adopted in this shrinkage denoising then consists of identifying the paper. magnitude of wavelet coefficients one can expect from the noise (the threshold), and then shrinking 2. THE DENOISING METHOD the magnitudes of all the coefficients by this amount. This paper discusses how to remove the What remain of the coefficients should be valid additive white Gaussian noise (AWGN) with a zero signal data, and the transform can then be inverted to mean and reconstructed images also analyzed for reconstruct an estimate of the signal. Wavelet other mean values. Decimation of the wavelet shrinkage depends heavily on the choice of a coefficients is an intrinsic property of the discrete thresholding parameter and the choice of this wavelet transform (DWT). The decimation step threshold determines, to a great extent the efficacy removes every other of the coefficients of the current of denoising. Researchers have developed various level. Thus the computation of the wavelet transform techniques for choosing denoising parameters and so is faster and more compact in terms of storage space. far there is no “best” universal threshold More importantly, the transformed signal can be determination technique. Two types of wavelet perfectly reconstructed from the remaining transforms have been used: Discrete wavelet coefficients. Unfortunately, the decimation is transform (DWT) and Undecimated Discrete causing shift variance of the wavelet transform. In wavelet transform (UWT). In threshold-based order to achieve shift- invariance, researches from denoising schemes, a threshold is set to distinguish different fields and having various goals have noise from the structural information. Thresholding invented several wavelets transform algorithms. This can be classified into soft and hard ones, in which type of transforms is known under the common coefficients less than the threshold will be set to 0 name undecimated wavelet transform (UWT). but those above the threshold will be preserved (hard Unlike the discrete wavelet transform (DWT), which thresholding) or shrunk (soft thresholding). Donoho downsamples the approximation coefficients and (1995) first presented the Wavelet Shrinkage scheme detail coefficients at each decomposition level, the with universal threshold based on orthonormal undecimated wavelet transform (UWT) does not wavelet bases. It is generally accepted that in each incorporate the down sampling operations. This subband the image wavelet coefficients can be algorithm is based on the idea of no decimation. It modeled as independent identically distributed applies the wavelet transform and omits both down (i.i.d.) random variables with generalized Gaussian sampling in the forward and up sampling in the distribution (GGD). So by choosing different type of inverse transform. More precisely, it applies the threshold we can improve the quality of the images. transform at each point of the image and saves the Although wavelet transform well decorrelates detail coefficients and uses the low-frequency signals, strong intrascale and interscale dependencies coefficients for the next level. The size of the between wavelet coefficients may still exist. The coefficients array does not diminish from level to denoising schemes benefited from intrascale models. level. Thus, the approximation coefficients and Wavelet interscale models are also used in many detail coefficients at each level are the same length other applications. If a coefficient at a coarser scale as the original signal. By using all coefficients at has small magnitude, its descendants at finer scales each level, we get very well allocated high- are very likely to be small too. Shapiro (1993) frequency information. The resolution of the UWT exploited this property and developed the well- coefficients decreases with increasing levels of known embedded zero tree wavelet image decomposition. By comparing the UWT with the compression scheme. In another viewpoint, if a DWT, the UWT has some unique features, wavelet coefficient generated by true signal has Translation invariance, better denoising capability, large magnitude at a finer scale; its ascendants at better peak detection capability. coarser scales will likely be significant as well. But for those coefficients caused by noise, the magnitudes may decay rapidly along the scales. With this observation, it is expected that multiplying 2113 | P a g e
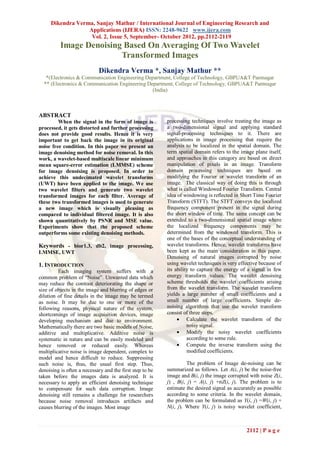
- 3. Dikendra Verma, Sanjay Mathur / International Journal of Engineering Research and Applications (IJERA) ISSN: 2248-9622 www.ijera.com Vol. 2, Issue 5, September- October 2012, pp.2112-2119 where n ∈ N(0, σ2 ), Applying the UWT to the noisy signal g, at scale yields 𝑤𝑗 = 𝑥 𝑗 + 𝑣 𝑗 (2) where wj is wavelet coefficients at scale j, xj and vj are the expansions of f and n respectively. In this thesis, the LMMSE of wavelet coefficients is employed instead of soft thresholding. Suppose the variance of vj and xj is 𝜎𝑗2 and 𝜎 2𝑗 respectively. 𝑥 Since vj and xj are both zero mean, the LMMSE of xj is: 𝑥𝑗′ = 𝑘 ′ . 𝑤𝑗 Fig.2: a 2-dimensional UWT - decomposition step 𝜎2𝑥𝑗 where 𝑘′ = 2 +𝜎 2 (3) 𝜎𝑥 𝑗 2.1 Wavelet Thresholding 𝑗 The term wavelet thresholding is explained This leads to the energy shrinkage of the as decomposition of the data or the image into restored signal. After applying the LMMSE, wavelet coefficients, comparing the detail approximate 𝒙′𝒋 is obtained and 𝑥𝑗′ is extracted, and coefficients with a given threshold value, and this is nearly approximate coefficients of the real shrinking these coefficients close to zero to take image. away the effect of noise in the data. The image is reconstructed from the modified coefficients. 2.2 Wavelet Filter Used Thresholding distinguishes between the coefficients Orthogonal filter banks with symmetric FIR due to noise and the ones consisting of important filters are of great interest in certain applications of signal information. The choice of a threshold is an image and video processing. The symmetry property important point of interest. It plays a major role in of the filters is important for handling boundary the removal of noise in images because denoising distortions of finite length signals effectively. The most frequently produces smoothed images, orthogonality property in filter banks preserves the reducing the sharpness of the image. Care should be energy of the input signal in the subbands, which taken so as to preserve the edges of the denoised guarantees that errors arising from quantization or image. There exist various methods for wavelet transmission will not be amplified. In addition, thresholding, which rely on the choice of a threshold orthogonality usually leads to high energy value. Some typically used methods for image noise compaction. Thus, it is desirable to design filter removal include VisuShrink, SureShrink and banks that are both symmetric and orthogonal. BayesShrink. For all these methods the image is first Daubechies (1992) subjected to a wavelet transform, which decomposes Ingrid Daubechies, one of the brightest the image into various sub-bands. The sub-bands stars in the world of wavelet research, invented what HHm, HLm, LHm, m = 1, 2, …, j are called the details, are called compactly supported orthonormal where m is the scale and j denotes the largest or wavelets, thus making discrete wavelet analysis coarsest scale in decomposition. Note, LLm is the practicable. The names of the Daubechies family low-resolution component. Thresholding is now wavelets are written dbN, where N is the order, and applied to the detail components of these sub bands db the “surname” of the wavelet. The db1 wavelet is to remove the unwanted coefficients, which the same as Haar wavelet. In this paper we used db2 contribute to noise. And as a final step in the wavelet filter of this family which is used in denoising algorithm, the inverse wavelet transform programming by this instruction. is applied to build back the modified image from its [Lo_D,Hi_D,Lo_R,Hi_R] = wfilters('wname') coefficients. In threshold-based (hard or soft) This computes four filters associated with denoising schemes, the wavelet coefficients whose the orthogonal or biorthogonal wavelet named in the magnitudes are below a threshold will be set to 0. string „wname‟. Here we signify db2 wavelet filter These pixels are generally noise predominated and name. thus the thresholding of these coefficients is safely a Biorthogonal Filter structure preserving denoising process. We apply the For image denoising, symmetric wavelet LMMSE only to those coefficients above a threshold filters are more desirable because a symmetrical and shrink those below the threshold to 0. Here in extension at the image edges can be used, providing this paper threshold applied to wj (wavelet less distortion and higher denoising. The most coefficients) is set as TH=1.8*σj. common type of symmetrical wavelet filter is called Suppose the original signal f is corrupted with a biorthogonal filter. FASTMAN has implemented a additive white Gaussian noise n. biorthogonal wavelet filter pair as a mega function. g=f+n (1) This mega function implements one stage of the wavelet filter pyramid. It takes an input signal at a clock frequency f0, computes the decimated high- 2114 | P a g e
- 4. Dikendra Verma, Sanjay Mathur / International Journal of Engineering Research and Applications (IJERA) ISSN: 2248-9622 www.ijera.com Vol. 2, Issue 5, September- October 2012, pp.2112-2119 pass and low-pass outputs (at clock frequencies f0/2) than individually generated denoised and then interleaves them to produce a single output images. containing alternating lowpass and highpass coefficients. Wavelet coefficients are computed by 3. PERFORMANCE MEASURE applying multiple stages of a lowpass and highpass In this work the performance of image denoising is filter pair, called a quadrature mirror filter pair, to computed in terms of Mean square error (MSE) and the data signal. At each stage (or scale) of the Peak signal to noise ratio (PSNR). pyramid, the low-pass filter computes a smoother (i) Mean Square Error (MSE) version of the signal and the high-pass filter brings out the signal‟s detail information at that scale. At MSE= 1 𝑀 𝑥=1 𝑁 𝑦=1 𝑓 𝑥, 𝑦 − 𝑓 ′ 𝑥, 𝑦 2 (4) 𝑀𝑁 the first stage, the filters are applied to the original, full-length signal. Then, at the next stage, the filter 𝑓 𝑥, 𝑦 : Original image pair is applied to the smoothed and decimated low- 𝑓 ′ 𝑥, 𝑦 : reconstructed image after denoising pass output of the first stage. The wavelet M, N: dimensions of the image coefficients consist of the accumulated detail For better performance MSE value should be components and the final smooth component. minimum. Biorthogonal wavelets with FIR filters: These wavelets can be defined through the two (ii) Peak Signal to Noise Ratio (PSNR) scaling filters wr and wd, for reconstruction and It is the measure of the peak error in the signal and is decomposition respectively. The Biorthogonal expressed mathematically by the following equation: wavelet family is a predefined family of this type such as bior1.1, bior1.3. 𝑀 𝑁 ′ 2 This family of wavelets exhibits the 𝑥 =1 𝑦 =1 𝑓 𝑥,𝑦 𝑃𝑆𝑁𝑅 = 𝑀𝑆𝐸 (5) property of linear phase, which is needed for signal The higher the value of peak signal to noise ratio and image reconstruction. In this family two means the ratio of the significant signal to noise is wavelets are used, one for decomposition and the better. other for reconstruction. In this thesis second filter we used bior1.3 wavelet filter which is used in programming by this instruction. 4. EXPERIMENTAL RESULTS The proposed image denoising algorithm is [Lo_D,Hi_D,Lo_R,Hi_R] = wfilters('wname') implemented in matrix laboratory (MATLAB). This „wname‟ we specify here is bior1.3. part presents the results, obtained after following the wavelet denoising algorithm. The results have been 2.3 Image Denosing using proposed algorithm demonstrated in the form of plots and reconstructed Image denoising based on averaging of two wavelets images. The proposed technique has been tested for transformed images algorithm is as follows: assumed standard test images Lena and Barbara. 1. Read the input image. The size of images which we have examined is 2. Corrupt the image with Additive White 512×512. These images are widely used by Gaussian noise (AWGN) with different researchers in image processing applications. The noise intensity. qualitative judgment made visually based on the 3. Perform multiscale decomposition of the results obtained for Gaussian noise variance 5, 10, image corrupted by Gaussian noise using 15, 20, 25, 30, with zero mean. For making the Undecimated wavelet transform (UWT) with the help of „bior1.3‟ wavelet filter. method general the images were examined for 4. Calculate the wavelet coefficients of noisy different mean values of noise also and verified the results. In Fig. 4.1 and Fig. 4.2 it has been clearly image for 3 different scales. seen that the MSE value of reconstructed image 5. Select only those coefficients above the threshold and shrink those below the generated by averaging of two wavelets transformed images is below the MSE value of individually threshold to 0. generated image by single filter. It is well known 6. We combine the wavelet coefficients with that the performance of the image quality increases the same spatial location across adjacent with decrement in MSE value. So from Fig. 4.1 and scales as a vector, to which the LMMSE is Fig. 4.2 it can be easily concluded that the PSNR then applied. value obtained for proposed method is better than 7. Invert the multiscale decomposition to reconstruct the denoised image. the PSNR value of individual filter. 8. Repeat the step from 3 to 6 for the „db2‟ wavelet filter and reconstruct the image. 9. Averaging the matrices of two reconstructed images. 10. Generate a new reconstructed image matrix and get the denoised image which is better 2115 | P a g e
- 5. Dikendra Verma, Sanjay Mathur / International Journal of Engineering Research and Applications (IJERA) ISSN: 2248-9622 www.ijera.com Vol. 2, Issue 5, September- October 2012, pp.2112-2119 (c): noisy image (σ=10) (d): Denoised image (σ=10) Fig.4.1: Variation of MSE and PSNR for different (e): noisy image (σ=15) (f): Denoised image filter for Lena image (σ=15) (g): noisy image (σ=20) (h): Denoised image (σ=20) Fig.4.2: variation of MSE and PSNR for different filter for Barbara image (i): noisy image (σ=25) (j): Denoised image (σ=25) (a): noisy image (σ=5) (b): Denoised image (σ=5) (k): noisy image (σ=30) (l): Denoised image (σ=30) 2116 | P a g e
- 6. Dikendra Verma, Sanjay Mathur / International Journal of Engineering Research and Applications (IJERA) ISSN: 2248-9622 www.ijera.com Vol. 2, Issue 5, September- October 2012, pp.2112-2119 (a): noisy image (σ=5) (b): Denoised (k): noisy image (σ=30) (l): Denoised image (σ=5) image (σ=30) Fig.4.3: comparison between noisy and denoised images In summary, the proposed scheme permits more smoothing away from edges and lesser smoothing near edges, resulting in restoring the noisy image without significantly degrading its edges. However, visually, the edges of the image appear sharp and most of the background and other low activity areas of the image have been overly (c): noisy image (σ=10) (d): Denoised image smoothed. (σ=10) As of now the results of various images for different values of noise variance with zero mean have been observed. It has been seen that, experimentally this method gives good results for zero mean. Now the proposed method has been examined for two mean values 1, 2 using standard image Lena. Table 4: Comparison of quantitative parameters for Bior1.3, Db2 and Averaging filter with different mean for Lena image (e): noisy image (σ=15) (f): Denoised image (σ=15) (a) Additive White Gaussian noise with mean=1 MSE Averaging Variance Bior 1.3 Db2 filter 15 14.9996 15.8271 14.644 20 21.1894 22.21 20.557 (g): noisy image (σ=20) (h): Denoised image 25 28.4396 29.5641 27.4408 (σ=20) PSNR(db) Averaging Variance Bior 1.3 Db2 filter 15 30.7656 30.5343 31.8706 20 29.2633 29.0615 30.3958 25 27.9866 27.8212 29.143 (i): noisy image (σ=25) (j): Denoised image (σ=25) 2117 | P a g e
- 7. Dikendra Verma, Sanjay Mathur / International Journal of Engineering Research and Applications (IJERA) ISSN: 2248-9622 www.ijera.com Vol. 2, Issue 5, September- October 2012, pp.2112-2119 represented by black line. This is providing the best (b) Additive White Gaussian noise with mean=2 results to all other methods of denoising. 5. Conclusion MSE In this paper, Averaging of two wavelet Averaging transformed images algorithm for denoising natural Variance Bior 1.3 Db2 filter images were investigated and their performance was 15 17.8939 18.6266 comparatively assessed. Its performance was shown 17.4962 to be competitive with or exceeding the performance 20 24.1054 25.1874 23.5045 of other algorithms. In addition, it has been shown to enjoy the advantage of implementation simplicity. 25 31.1594 32.3935 30.2098 REFERENCES [1] I. Daubechies, A. Cohen. and J. Feauveau, Biorthogonal bases of compactly supported PSNR wavelets, Comm. Pure Appl. Math., vol. 45, Averaging 1992, 485–560. Variance Bior 1.3 Db2 filter [2] D. Donoho and I. Johnstone, Adapting to 15 30.0593 29.8868 31.1576 unknown smoothness via wavelet shrinkage, J. Amer. Stat. Assoc., vol. 90, 20 28.7642 28.576 29.8748 1995, 1200–1224. [3] I. Elyasi and S. Zarmehi, Elimination Noise 25 27.6495 27.4838 28.785 by Adaptive Wavelet Threshold, World Academy of Science Engineering and From above tables it has been observed that Technology, article 81, 2009,462-466. as mean value of AWGN increases, MSE value also [4] D. Gnanadurai and V. Sadasivam, An increases which degrades the performance of image in Efficient Adaptive Thresholding Technique terms of PSNR. But the proposed method gives better for Wavelet Based Image Denoising, World results as compared to single filter reconstructed image Academy of Science, Engineering and for different mean values. So it can be seen from Table 4 Technology, Vol. 1, Issue: 2, 2006, 114- that the proposed method gives better results for any 119. value of mean with different variance. [5] S. Grace Chang, Y. Bin and M. Vetterli, Spatially Adaptive Wavelet Thresholding with Context Modeling for Image Denoising, IEEE Transactions on Image Processing, vol. 15, 2000, 1471-1485. [6] A. Gyaourova, Undecimated wavelet transforms for image de-noising, Lecture Notes in Statistics, vol.161, 2002, 1-11. [7] L. Juan and P. Moulin, Information- Theoretic Analysis of Interscale and Intrascale Dependencies between Image Wavelet Coefficients, IEEE Transactions on Image Processing, vol. 10, No.11, 2000, 1647-1658. [8] M. Kıvanc Mıhcak, I. Kozintsev and K.Ramchandran, Low-Complexity Image Denoising Based on Statistical Modeling of Wavelet Coefficients, IEEE Signal Process Fig.4.4: comparison of PSNR (dB) for different Lett, vol. 6, no. 12, 1999, 300-303. image denoising technique for Lena image corrupted [9] W. Liu, New Method for Image Denoising by AWGN while Keeping Edge Information, IEEE conference Image and Signal Processing, The above graph show that the different 2009, 1 – 5, Tianjin. denoising response for three different variance 15, [10] S. Mallat, A theory for multiresolution 20, 30. These denoising schemes clearly signal decomposition: the wavelet differentiated by their respective colors. The graph representation, IEEE Trans. Pattern Anal. compares the value of PSNR (dB) for different type Machine Intell, vol.11, no. 7, 1989, 674– of denoising schemes. The proposed scheme is 693. 2118 | P a g e
- 8. Dikendra Verma, Sanjay Mathur / International Journal of Engineering Research and Applications (IJERA) ISSN: 2248-9622 www.ijera.com Vol. 2, Issue 5, September- October 2012, pp.2112-2119 [11] P. Quan, L. Zhang, D. Guanzhong, and H. Zhang, Two Denoising Methods by Wavelet Transform, IEEE Trans. Signal Process. vol. 47, 1999, 3401-3406. [12] R.Rangarajan, R. Venkataramanan and S. Shah, Image Denoising Using Wavelets, Computing in Science and Engineering, 2002, 3-13. [13] J. Shapiro, Embedded image coding using zero trees of wavelet coefficients, IEEE Transactions on Signal Process, vol. 41, no. 12, 1993, 3445–3462. [14] M.Tian, H.Wen, L. Zhou and Y. Xinge, Image denoising using multi-scale thresholds method in the wavelet domain, IEEE Conference Wavelet Analysis and Pattern Recognition (ICWAPR), 2010, 79 – 83. Wuhan, China. [15] L. Xin and T. Michael, Spatially Adaptive Image Denoising Under Overcomplete Expansion, IEEE Transactions on Information Theory, Vol. 47, 2000, 945- 956. [16] L. Zhang and B. Paul, A Wavelet-based Edge Detection Method by Scale Multiplication, IEEE International Conference Pattern Recognition, vol. 3, 2002, 501 – 504, Kowloon, China. [17] L.Zhang, B. Paul and W. Xiaolin, Multiscale LMMSE-Based Image Denoising With Optimal Wavelet Selection, IEEE Transactions on Signal Processing Vol. 15, Issue: 4, 2005, 469 – 481. 2119 | P a g e