SlideShare ist ein Scribd-Unternehmen logo
1 von 8
Downloaden Sie, um offline zu lesen
Pankaj Sharma, Kamaljeet Bhambri / International Journal of Engineering Research and
                Applications (IJERA)      ISSN: 2248-9622 www.ijera.com
                      Vol. 3, Issue 2, March -April 2013, pp.429-436

   Experimental Investigation of Parameters of CNC Turning by
            Taguchi based Grey Relational Analysis
                          Pankaj Sharma*, Kamaljeet Bhambri**
           *(Department of Mechanical Engg., M.M. University, Mullana, Ambala (Haryana) - India)
             ** (Department of Mechanical Engg., S.U.S.C.E.T., Tangori, Mohali (Punjab) – India)


Abstract                                                 As we know in actual machining there are many
The AISI H13, a chromium based hot work tool             factors which affect the surface roughness and
Steel has a wide variety of applications in              material removal rates i.e. cutting conditions, tool
aluminum casting and extrusion dies, forging dies,       variables and work piece variables. Cutting
hot nut tools, hot header dies, extrusion mandrels,      conditions includes speed, feed and depth of cut. The
plastic molds, cores, die holder blocks, hot press       tool variables includes tool material, nose radius, rake
dies and specially hot work punches etc. In this         angle, cutting edge geometry, tool vibration, tool
study, the optimization of two response                  overhang, tool point angle etc. The work piece
parameters (Surface roughness and Material               variables include hardness and mechanical properties
Removal Rate) by three machining parameters              of the material. It is very difficult to take all the
(cutting speed, feed rate and depth of cut) is           parameters that control the response parameters for a
investigated in high speed turning of H13 in dry         particular manufacturing process. In a turning
conditions. Taguchi’s L’18 orthogonal array and          operation, it is very difficult to select the cutting
analysis of variance (ANOVA) are used for                parameters to achieve the high surface finish with
individual optimization. The simultaneous                optimal material removal rate. This study would help
optimization is done by Grey Relational Analysis         the operator to select the cutting parameters.
approach. The different levels of all machining          The hot work tool steels have the ability to resist
parameters are used and experiments are done on          softening under hot working conditions and after
HMT STALLION-100 HS CNC lathe machine.                   numerous exposures to elevated operating
The optimum condition for combined effects was           temperatures. Hot work material used for the present
found V5-F1-D1 and the optimal value of the              study is H13 steel. The nominal chemical
surface roughness (Ra) comes out to be 0.84 (μm)         compositions are {Chromium (5%), Vanadium (1%),
and of MRR is 488.8 (mm³/sec). The optimum               Molybdenum (1.5%), Carbon (0.4%), Maganese
results are also verified with the help of               (0.35%)}. This H13 tool steel is suitable for forging
confirmation experiments.                                dies, forging die inserts, hot gripper dies, hot nut
                                                         tools, hot header dies, brass forging and pressing
Keywords: CNC Turning, Optimization, ANOVA,              dies, aluminum base dies, aluminum casting and
MRR, Surface Roughness (Ra), Taguchi Method,             extrusion dies, zinc die casting dies, extrusion
Grey Relational Analysis, GRG.                           mandrels, plastic molds, cores, die holder blocks, hot
                                                         press dies and hot work punches etc.
1. Introduction                                          This paper is about experimentally investigating and
Quality plays a major role in today‟s manufacturing      optimizing the machining parameters for Material
market. From Customer‟s viewpoint quality is very        Removal Rate (MRR) and Surface Roughness in
important because the quality of products affects the    CNC turning by Taguchi method and grey relational
degree of satisfaction of the consumers during usage     analysis approach.. Taguchi‟s orthogonal arrays are
of the product. It also improves the goodwill of the     highly fractional designs, used to estimate main
company.                                                 effects using very few experimental runs. These
High speed turning operation is done on CNC lathe.       designs are not only applicable for two level factorial
The quality of the surface plays a very important role   experiments, but also can investigate main effects
in the performance of dry turning because a good         when factors have more than two levels. Designs are
quality turned surface surely improves fatigue           also available to investigate main effects for some
strength, corrosion resistance and creep life. Surface   mixed level experiments where the factors included
roughness also affects on some functional attributes     do not have the same number of levels.
of parts, such as, contact causing surface friction,     For example, a four-level full factorial design with
wearing, light reflection, ability of distributing and   five factors requires 1024 runs while the Taguchi
also holding a lubricant, load bearing capacity,         orthogonal array reduces the required number of runs
coating and resisting fatigue.                           to 16 only.


                                                                                                 429 | P a g e
Pankaj Sharma, Kamaljeet Bhambri / International Journal of Engineering Research and
                Applications (IJERA)      ISSN: 2248-9622 www.ijera.com
                      Vol. 3, Issue 2, March -April 2013, pp.429-436

Ojel, T. et al. (2004) has studied the effects of cutting   2. Design of Experiment
edge geometry, work piece hardness, feed rate and           The experiments are designed using Taguchi method
cutting speed on surface roughness and resultant            so that effect of all the parameters could be studied
forces in the finish hard turning of AISI H13 steel.        with minimum possible number of experiments.
Cubic Boron Nitrite inserts with two distinct edge          Using Taguchi method, Appropriate Orthogonal
preparations (chamfered and honed) and through              Array has been chosen and experiments have been
hardened AISI H13 steel bars were used. The honed           performed as per the set of experiments designed in
Edge geometry and lower work piece surface                  the orthogonal array. Signal to Noise ratios are also
hardness resulted in better surface roughness.              calculated for analyzing the effect of machining
Ghani, M.U. et al. (2007) has presented results of an       parameters more accurately. The results of the
investigation into the tool life and the tool wear          experimentation are analyzed analytically and
behaviour of low content CBN cutting tools used in          graphically as well. ANOVA is used to determine the
hard turning of hardened H13 tool steel using finite        percentage contribution of all factors upon each
element thermal modeling. It involved measuring the         response individually.
cutting forces, cutting temperatures, tool wear and the
contact area. Using the measured cutting forces and         3. Taguchi Method
the contact area in the orthogonal cutting model, he        The traditional experimental design methods are very
calculated the heat flux on the tool. The heat partition    complicated and difficult to use. Additionally, these
into the tool was estimated to be around 21–22% for         methods also require a large number of experiments
conventional speeds, 14% for high-speed turning.            when the number of process parameters increases. In
The tool wear, however, was found to be dominated           order to minimize the number of tests required,
by chipping for both cutting speeds and could be            Taguchi experimental design method, a powerful tool
reduced considerably by reducing the amount of heat         for designing high-quality system, was developed by
entering the tool.                                          Taguchi. Taguchi method uses a design of orthogonal
Jaharah, A.G. et al (2009) has studied the effect of        arrays to study the entire parameter space with small
uncoated carbide tool geometries in turning AISI            number of experiments only. Taguchi recommends
1045 using finite element analysis. This paper              analyzing the mean response for each run in the
presents the application of Finite element method           array, and he also suggests to analyze variation using
(FEM) in simulating the effect of cutting tool              an appropriately chosen signal-to-noise ratio (S/N).
geometries on the effective stress and temperature          There are 3 Signal-to-Noise ratios of common
increased in turning. The tool geometries studied           interest for optimization of static problems:
were various rake (α) and clearance (β) in the
different ranges. The minimum effective stress of               1.   Smaller The Better
1700MPa is achieved using rake and clearance angles                  S                     ∑Yi 2
of 5° and 5° respectively with cutting speed of                           = −10 log
                                                                     N                      n
300mm/min, and feed rate of 0.25mm/rev.
Chakradhar, D. and Venu Gopal, A. (2011) has done               2.   Larger The Better
                                                                     S                1
the multi objective optimization of electrochemical
                                                                     N
                                                                       = −10 log⁡ ∑ yi ²)/n)
                                                                                 ((
machining of EN-31 steel by grey relational analysis.
The process parameters considered are electrolyte
                                                                3.   NOMINAL-THE-BEST
concentration, feed rate and applied voltage and are                  𝑆               𝑦2
optimized with considerations of multiple                             𝑁
                                                                          = 10 log⁡ 𝑠 2 )
                                                                                  (
performance characteristics including material              Where,
removal rate, over cut, cylindricity error and surface               Yi - ith observed value of the response,
roughness. With the help of Analysis of variance                     n - Number of observations in a trial,
(ANOVA) it was observed that feed rate is the                        y - Average of observed values (responses)
significant process parameter that affects the ECM                   s - Variance.
robustness.
Hassan, K. et al. (2012) has done the experimental          Regardless of the category of the performance
investigation of material removal rate (MRR) in CNC         characteristics, the higher S/N ratio corresponds to a
turning of C34000 using Taguchi method using L‟27           better performance. Therefore, the optimal level of
array. When the MRR is optimized alone the MRR              the process parameters is the level with the highest
comes out to be 8.91. The optimum levels of process         S/N value. The statistical analysis of the data is
parameters for simultaneous optimization of MRR             performed by analysis of variance (ANOVA) to study
have been identified. Optimal results were verified         the contribution of the various factors and
through confirmation experiments. It was concluded          interactions and to explore the effects of each process
that MRR is mainly affected by cutting speed and            on the observed values.
feed rate.


                                                                                                   430 | P a g e
Pankaj Sharma, Kamaljeet Bhambri / International Journal of Engineering Research and
                Applications (IJERA)      ISSN: 2248-9622 www.ijera.com
                      Vol. 3, Issue 2, March -April 2013, pp.429-436

4. Experimentation                                        to determine the optimum combination of the
In this study, three machining parameters were            machining parameters.
selected with different levels as given in Table 1. The   A series of turning tests are conducted to assess the
experimental design was according to an L‟18 array        effect of turning parameters on surface roughness in
based on Taguchi method. A set of experiments             turning of H13. The Material Removal Rate
designed and conducted to investigate the relation        calculations and experimental results of the surface
between the process parameters and response factor.       roughness for turning of H13 with different turning
Minitab 16 software is used for optimization and          parameters are shown in Table 3.
graphical analysis of obtained data.
                                                          Table 3 Design of experiment and calculations
Table 1 Turning parameters and levels                      S.   Weight Weight Machining Means of
 Levels        CS            F                DOC         No. before        after      Time        Material
             (m/sec)     (mm/rev)             (mm)              turning turning        (sec.)      Removal
    1          150          0.1                0.5                (gm)      (gm)                     Rate
    2          180          0.2                 1                                                 (mm³/sec)
    3          210          0.3                1.5         1     454.1      425.2       12.0        304.85
    4          240                                         2     425.2      406.7        7.0        334.53
    5          270                                         3     406.7      386.7        5.7        444.14
    6          300                                         4     456.4      424.2       10.4        391.91
                                                           5     424.2      399.4        8.0        392.40
The work material selected for this experiment is          6     399.4      380.9        5.5        425.77
H13 of Ø 32 mm, length 70 mm in the present study.         7     456.2      421.2       10.1        438.65
The chemical composition of H13 sample can be              8     421.2      399.3        6.4        433.14
seen in Tables 2.                                          9     399.3      382.9        5.2        399.22
                                                          10     454.0      415.9        9.6        502.37
Table 2 Chemical composition of H13 sample                11     415.9      392.2        6.2        483.87
 Ele-    C    Cr V      Mo SI        S     P              12     392.2      377.4        3.9        480.36
 ments                                                    13     452.0      418.8        8.5        494.41
 %       0.36 4.9 0.9 1.4 1.04 0.03 0.03                  14     418.8      390.1        7.2        504.57
                                                          15     390.1      372.9        4.4        494.82
The turning tests were carried out to determine the       16     457.0      424.4        8.5        483.99
Material Removal Rate and Surface Roughness under         17     424.4      402.7        6.5        422.59
various turning parameters. A HMT STALLION-100            18     402.7      384.4        4.9        459.82
HS CNC lathe machine is used for experimentation.
Roughness is measured using stylus type surface           Table 4 Design of experiment and calculations
roughness tester „Surftest SJ-201‟ made of Mitutoyo,      Ex. CS         F         D       MRR        Ra
Japan. The cut-off length (λ) was chosen as 0.8cm for     No. (m/        ( mm/     (mm (mm³/          (μm)
each roughness measurement. An average of 5                     min)     rev)      )       sec)
measurements of the surface roughness was taken to        1       150       0.1      0.5    304.85     0.57
use in the multi-criteria optimization.                   2       150       0.2      1.0    334.53     0.96
The Material Removal Rate, MRR (mm³/ min) was
                                                          3       150       0.3      1.5    444.14     1.04
calculated using formula:
                                                          4       180       0.1      0.5    391.91     0.59
                   𝑊𝑖 −𝑊𝑓                                 5       180       0.2      1.0    392.40     0.96
          𝑀𝑅𝑅 =      𝜌𝑠 𝑡
                            𝑚𝑚³/𝑠𝑒𝑐                       6       180       0.3      1.5    425.77     1.09
Where, Wi = Initial weight of work piece in gm            7       210       0.1      1.0    438.65     0.82
      Wf= Final weight of work piece in gm                8       210       0.2      1.5    433.14     0.88
      t = Machining time in seconds                       9       210       0.3      0.5    399.22     0.86
     ρs= Density of mild steel (7.9 x 10ˉ³ gm/mm³).       10      240       0.1      1.5    502.37     0.97
                                                          11      240       0.2      0.5    483.87     0.84
5. Results and Discussions                                12      240       0.3      1.0    480.36     0.94
In high speed turning operation, surface roughness is     13      270       0.1      1.0    494.41     0.92
an important criterion. The purpose of the analysis of    14      270       0.2      1.5    504.57     1.06
variance (ANOVA) is to investigate which design           15      270       0.3      0.5    494.82     1.04
parameter significantly affects the surface roughness.    16      300       0.1      1.5    483.99     1.06
Based on the ANOVA, the relative importance of the        17      300       0.2      0.5    422.59     1.02
machining parameters with respect to material             18      300       0.3      1.0    459.82     0.98
removal rate and surface roughness was investigated

                                                                                                431 | P a g e
Pankaj Sharma, Kamaljeet Bhambri / International Journal of Engineering Research and
                Applications (IJERA)      ISSN: 2248-9622 www.ijera.com
                      Vol. 3, Issue 2, March -April 2013, pp.429-436

Table 5 ANOVA Table for means of MRR
V D        SS    MS       F       P            C
     F
C 5      41373 8274. 11.83 0.002           73.79
S              7                           ***
F   2    1526  762.9 1.09       0.381      2.7 2*
D 2      7566  3783. 5.41       0.033      13.49
               2                           **
E   8    5598  699.7                       9.98
                                                          Fig 2 Main effect plot for means of Ra
T   17 56064                               100
                                                    Here,
Table 6 Response Table for means of MRR             V-Variable,                CS-Cutting Speed,
 Level        CS             F        DOC           F-Feed Rate,               D-Depth Of Cut,
   1         361.2         436.0      416.2         SR-Surface Roughness, E-Error,
   2         403.4         428.5      433.4         T-Total,                   DF-Degree of Freedom,
   3         423.7         450.7      465.7         SS-Sum of Squares,         MS-Mean of Squares,
   4         488.9                                  F-a statistical parameter, P-Percentage,
   5         497.9                                  C-% Contribution.
   6         455.5                                  Here *** & ** represents most significant and
 Delta       136.8         22.2        49.5         significant parameters and * as less significant.
 Rank          1             3          2
                                                    6. Grey Relational Analysis
                                                    In the Grey relational analysis the quality
                                                    characteristics are first normalized, ranging from zero
                                                    to one. This process is known as Grey Relational
                                                    Generation. Then the Grey Relational Coefficient
                                                    based on normalized experimental data is calculated
                                                    to represent the correlation between the desired and
                                                    the actual experimental data. Then overall Grey
                                                    Relational Grade (GRG) is determined by averaging
                                                    the Grey relational coefficient corresponding to
    Fig 1 Main effect plot for means of MRR         selected responses.

Table 7 ANOVA Table for means of Ra                 The overall performance characteristic of the
V D SS         MS       F       P          C        multiple response process depends on the calculated
    F                                               GRG. This Grey relational approach converts a
C    5 0.0826 0.016 1.77        0.226      22.35    multiple response process optimization problem into
S              5                           *        a single response optimization problem. The optimal
F    2 0.0954 0.047 5.10        0.037      25.82    parametric combination is then evaluated, which
               7                           **       would result in the highest Grey relational grade. The
D    2 0.1166 0.058 6.23        0.023      31.56    optimal factor setting for maximizing the overall
               2                           ***      Grey relational grade can be performed using the
E    8 0.0749 0.009                        20.27    Taguchi method.
               3                                    In Grey relational generation, the normalized MRR
T   17 0.3695                              100      should follow the larger-the-better (LB) criterion,
                                                    which can be expressed as:
                                                                          max yi k – yi k
Table 8 Response Table for means of Ra                         xi k =
 Level         CS             F           DOC                           max yi k – min yi k
   1         0.8567        0.8217        0.8200     The normalized Ra should follow the smaller-the-
   2         0.8800        0.9533        0.9300     better (SB) criterion which can be expressed as:
   3         0.8533        0.9917        1.0167                            yi k − min yi k
                                                                xi k =
   4         0.9167                                                      max yi k – min yi k
   5         1.0067                                 Where, xi(k) and xj(k) are the value after Grey
   6         1.0200                                 Relational Generation for LB and SB criteria. Max
 Delta       0.1667        0.1700        0.1967     yi(k) is the largest value of yi(k) for kth response and
 Rank           3             2             1       min yi(k) is the minimum value of yi(k) for the kth
                                                    response.

                                                                                            432 | P a g e
Pankaj Sharma, Kamaljeet Bhambri / International Journal of Engineering Research and
                  Applications (IJERA)      ISSN: 2248-9622 www.ijera.com
                        Vol. 3, Issue 2, March -April 2013, pp.429-436

The Grey relational coefficient ξi(k) can be calculated    Table 10: Grey Relational Analysis Calculations
as:                                                        S. GRGC             RSDC            GRCC
        ξi(k) = Δmin + Ψ Δmax                              N.
                 Δ oi(k) + Ψ Δmax                              MR      Ra      MR      Ra      MR      Ra
                                                               R               R               R
And      Δ oi = ║ xo(k) – xi(k) ║                          xo 1.000 1.000 1.000 1.000 1.000 1.000
                                                           1   0.000 1.000 1.000 0.000 0.333 1.000
Where Δ oi is the difference between absolute value        2   0.148 0.250 0.852 0.750 0.369 0.400
xo(k) and xi(k). Ψ is the distinguishing coefficient 0 ≤   3   0.697 0.096 0.303 0.904 0.622 0.356
Ψ ≥ 1. Δ min and Δ max are the minimum and                 4   0.431 0.962 0.569 0.038 0.467 0.929
maximum value among the Δ oi for corresponding kth         5   0.438 0.250 0.562 0.750 0.470 0.400
response.                                                  6   0.605 0.000 0.395 1.000 0.558 0.333
Now the Grey Relational Grade (GRG) can be                 7   0.669 0.519 0.331 0.481 0.601 0.509
calculated as :                                            8   0.642 0.404 0.358 0.596 0.582 0.456
                                                           9   0.472 0.442 0.528 0.558 0.486 0.472
         γi =
                                                           10 0.988 0.231 0.012 0.769 0.976 0.394
Where n is the number of process responses.                11 0.896 0.481 0.108 0.519 0.822 0.490
The higher value of the GRG corresponds to a               12 0.878 0.288 0.122 0.712 0.803 0.412
relational degree between the Reference Sequence           13 0.949 0.327 0.051 0.673 0.907 0.426
xo(k) and the given sequence xi(k). The Reference          14 1.000 0.058 0.000 0.942 1.000 0.346
Sequence xo(k) represents the best process sequence.       15 0.951 0.096 0.049 0.904 0.910 0.356
Therefore, a higher GRG means that the                     16 0.896 0.058 0.104 0.942 0.827 0.346
corresponding parameter combination is closer to the       17 0.589 0.135 0.411 0.865 0.548 0.366
optimal. The mean response for the GRG and the             18 0.775 0.212 0.225 0.788 0.689 0.388
main effect plot of the GRG are very important
because the optimal process condition can be               Where,
evaluated from this plot.                                   GRGC- Grey Relational Generation Calculation,
                                                            RSDC- Reference Sequence Definition Calculation,
Table 9 S/N Ratio Calculation for MRR and Ra                GRCC- Grey Relational Coefficient Calculation
S. No.    Mean Values          S/N Ratios
                                                           Table 11 GRG calculation
Xo         MRR         Ra           MRR       Ra            S. No.              GRG                  Rank
1           304.85       0.57       49.681       4.882                 Mean         S/N Ratio
2           334.53       0.96       50.488       0.354         1       0.6665        -3.5240
3           444.14       1.04       52.950      -0.340         2       0.3845        -8.3020
4           391.91       0.59       51.863       4.582         3       0.4890        -6.2138
5           392.40       0.96       51.874       0.354         4       0.6980        -3.1228
6           425.77       1.09       52.583      -0.748         5       0.4350        -7.2302
7           438.65       0.82       52.842       1.723         6       0.4455        -7.0230
8           433.14       0.88       52.732       1.110         7       0.5550        -5.1141
9           399.22       0.86       52.024       1.310         8       0.5190        -5.6966
10          502.37       0.97       54.020       0.264         9       0.4790        -6.3932
11          483.87       0.84       53.694       1.514        10       0.6850        -3.2861
12          480.36       0.94       53.631       0.537        11       0.6560        -3.6619
13          494.41       0.92       53.881       0.724        12       0.6075        -4.3290
14          504.57       1.06       54.058      -0.506        13       0.6665        -3.5240
15          494.82       1.04       53.888      -0.340        14       0.6730        -3.4397
16          483.99       1.06       53.696      -0.506        15       0.6330        -3.9719
17          422.59       1.02       52.518      -0.172        16       0.5865        -4.6346
18          459.82       0.98       53.251       0.175        17       0.4570        -6.8016
Max.        304.85       0.57       49.681      -0.748        18       0.5385        -5.3762
Min.        504.57       1.09       54.058       4.882


                                                                                              433 | P a g e
Pankaj Sharma, Kamaljeet Bhambri / International Journal of Engineering Research and
                  Applications (IJERA)      ISSN: 2248-9622 www.ijera.com
                        Vol. 3, Issue 2, March -April 2013, pp.429-436

Table 12: ANOVA calculations for means of GRG
V D SS           MS       F      P     C
    F
C 5       0.0706 0.0141 3.50 0.05 41.29***
S
F   2     0.0546 0.0273 6.78 0.01 31.93**
D      2    0.0135   0.0067   1.68   0.24    7.89*
E      8    0.0323   0.0040                  18.89
T      17   0.1710                           100          Fig 4Main effect plot for S/N Ratio of GRG

Table 13: ANOVA calculations for S/N ratio of
GRG
V D SS         MS      F       P       C
    F
C 5      17.65 3.531 3.15      0.07    40.30
S        3                             ***
F   2    13.75 6.878 6.14      0.02    31.40
         6                             **
D      2    3.430    1.715    1.53    0.27    7.83*
E      8    8.965    1.121                    20.47
T      17   43.80                             100          Fig 5 Interaction plot for means of GRG
            4
                                                      7. Determination of Optimum Condition:
Table 14 Response Table for means of GRG              Both the response and S/N ratio are used to derive the
  Level         CS            F         DOC           optimum conditions. Since for quality characteristic,
    1         0.5133       0.6429      0.5983         Grey Relational Grade larger the better approach is
    2         0.5262       0.5207      0.5312         desirable, the largest is the ideal level for a
    3         0.5177       0.5321      0.5663         parameter. The S/N ratio is always highest at the
    4         0.6495                                  optimum condition. The graphs of Figures 2 and 3
    5         0.6575                                  are used to determine the optimum process
    6         0.5273                                  parameters combination. The optimum combination
  Delta       0.1442       0.1222      0.0671         is therefore V5-F1-D1.
  Rank           1            2           3
                                                      7.1 Predictive Equation and Verification:
    Table 15 Response Table for S/N Ratio of GRG      The predicted values of GRG, MRR and Ra at the
    Level          CS            F          DOC       optimal levels are calculated by using the relation:
      1          -6.013       -3.868       -4.579
      2          -5.792       -5.855       -5.646
      3          -5.735       -5.551       -5.049
      4          -3.759                               Where,
      5                                               ñ - Predicted response value after optimization,
                 -3.645
      6          -5.604                                     - Total mean value of quality characteristic,
     Delta        2.368        1.988        1.067           - Mean value of quality characteristic at
     Rank           1            2            3       optimum level of each parameter and
                                                      o - Number of main machining parameters that affect
                                                      the response parameter.
                                                      Applying this relation, predicted values of GRG,
                                                      MRR and Ra at the optimum conditions are
                                                      calculated as:
                                                      1. ñGRG = 0.5652 + [ (0.6575 - 0.5652) + (0.6429 –
                                                                    0.5652) + (0.5983 - 0.5652) ]
                                                                = 0.7683
                                                      2. ñRa = 0.9222 + [ (1.0067 – 0.9222) + (0.8217 –
                                                                   0.9222) + (0.8200 – 0.9222 ]
       Fig 3 Main effect plot for means of GRG                  = 0.8040 µm.
                                                                                             434 | P a g e
Pankaj Sharma, Kamaljeet Bhambri / International Journal of Engineering Research and
                  Applications (IJERA)      ISSN: 2248-9622 www.ijera.com
                        Vol. 3, Issue 2, March -April 2013, pp.429-436

                                                        OL-Optimum Levels of Parameters
3. ñMRR = 438.4 + [ (497.9 – 438.4) + (436.0 –          POV-Predicted Optimum value
          438.4) + (416.2 – 438.4) ]                    EOV-Experimental Optimum Value
        = 473.3 mm³/sec.                                OR-Optimum Range of MRR                 and    Surface
                                                        Roughness
The robustness of this parameter optimization is
verified experimentally.      This requires the         9. Conclusions
confirmation run at the predicted optimum               In this study, the Grey relational based Taguchi
conditions. The experiment is conducted twice at the    method was applied for the multiple performance
predicted optimum conditions.                           characteristics of turning operations.
                                                        A grey relational analysis of the Material removal
Verifications                                           rate and the surface roughness obtained from the
1. For Material Removal Rate (MRR)                      Taguchi method reduced from the multiple
The calculated value of MRR at the optimum              performance characteristics to a single performance
condition (V5-F1-D1) is 488.8 mm³/sec. The error in     characteristic which is called the grey relational
the predicted optimum value (473.3) and the             grade. Therefore, the optimization of the complicated
calculated value (488.8) is only 3.2%.                  multiple performance characteristics of the processes
                                                        can be greatly simplified using the Grey relational
2. For Surface Roughness (Ra)                           based Taguchi method. It is also shown that the
The average of two measured values (0.82, 0.86) of      performance characteristics of the turning operations,
the response at the optimum condition (V5-F1-D1) is     such as the material removal rate and the surface
0.84 μm. The error in the predicted optimum value       roughness are greatly enhanced by using this method.
(0.8040) and experimental value (0.84) is only 4.4%.
                                                        References
Hence, so good agreement between the actual and the     [1]   Akhyar, G. et al. (2008), “Application of
predicted results is observed. Since the percentage           Taguchi method in the optimization of turning
error is less than 5%, it confirms excellent                  parameters for surface roughness”, International
reproducibility of the results. The results show that         Journal     of    Science     Engineering and
using the optimal parameter setting (V5-F1-D1) a              Technology, vol.1, no.3, pp. 60-66.
higher material removal rate is achieved with lower     [2]   Chakradhar, D. and Venu Gopal, A. (2011),
surface roughness.                                            “Multi-objective           optimization        of
                                                              electrochemical machining of en31 steel by
8. Results                                                    grey relational analysis”, International Journal
The effect of three machining parameters i.e. Cutting         of Modeling and optimization, vol. 1, no.2, pp.
speed, Feed rate and Depth of cut and their                   113-117.
interactions are evaluated using ANOVA. The             [3]   David Pye et al. “Chromiun Steel Article for
purpose of the ANOVA in this study is to identify the         AISI H13 Hot Work Tool Steel by Pye
important turning parameters in prediction of                 Metallurgical             consulting”          at
Material Removal Rate and Surface roughness. Some             http://www.heattreatonline.com/
important results come from ANOVA and plots are               ChromiumSteelArticle.pdf
given here. Table 16 shown below shows that optimal     [4]   Datta, R. and Majumdar, A. (2010),
values of surface roughness and material removal rate         “Optimization of turning process parameters
that lie between the optimal ranges.                          using multi-objective evolutionary algorithm”
                                                              Institute of electrical and electronics engineers
Table 16 Optimal values of machining and                      (IEEE), vol. 2010, article id 978-1-4244-8126-
response parameters                                           2/10.
CP OV        OL POV     EOV   OR                        [5]   Dhanabalan, S. et al. (2011), “Optimization of
                                                              EDM process parameters with multiple
CS     270    V5-    MRR=     MRR=      473.3                 performance characteristics for titanium grades”
                     473.3    488.8     <MRR>                 European Journal of Scientific research, vol. 68,
F      0.1    F1-                       488.8                 no. 3, pp. 297-305.
                                                        [6]   Gonzalez, L.W.H. et al. (2011), “Study of
D      0.5    D1     Ra=      Ra=       0.8040                performance of high speed turning of AISI1045
                     0.8040   0.84      < Ra >                using the volumetric dimension of cutting tool
                                        0.84                  life” International journal of advances in
                                                              machining and forming operations, vol. 3, no.1,
Where,                                                        pp.19-32.
CP-Cutting Parameters
OV-Optimal Values of Parameters
                                                                                                435 | P a g e
Pankaj Sharma, Kamaljeet Bhambri / International Journal of Engineering Research and
                   Applications (IJERA)      ISSN: 2248-9622 www.ijera.com
                         Vol. 3, Issue 2, March -April 2013, pp.429-436

[7]    Ghani, M.U. et al. (2007), “An investigation of             Response Surface Methodology and Taguchi
       heat partition and tool wear in hard turning of             Approach” International journal of industrial
       H13 tool steel with CBN cutting tools”                      engineering computations, vol. 2, pp. 819-830.
       International       Journal       of     Advance     [12]   Sathiya, P. and Jaleel, M.Y.A. (2010), “Grey
       Manufacturing and Technology, article id 170-               Based Taguchi method for optimization of bead
       007-1282-7.                                                 geometry in laser bead on plate welding”
[8]    Hassan, K. et al. (2012) “Experimental                      Advances in Production Engineering and
       investigation of Material removal rate in CNC               Management, vol. 5, no. 4, pp. 225-234.
       turning using Taguchi method” International          [13]   Solhjoei, N. et al. (2012), “Investigation in
       Journal of Engineering Research and                         electric discharge machining”Research Journal
       application, vol. 2, no. 2, pp. 1581-1590                   of Applied Science, Engineering and
[14]   Jaharah, A.G. et al. (2009), “Surface integrity of          echnology, vol. 4, no. 14, pp. 3005-3014.
       AISI H13 tool steel in end milling process”          [14]   Thamizhmani, S. et al. (2007), “Analysis of
       International Journal of Mechanical and                     surface Roughness by using Taguchi Method”,
       Materials Engineering (IJMME), vol. 4, no. 1,               Achievements in materials and manufacturing
       pp. 88 -92.                                                 engineering, vol. 20, no. 1, pp. 503-505.
[9]    Mahapatra, S.S. et al. (2006), “Parametric           [15]   Velibor, M. and Milos, M. (2011),
       analysis and optimization of cutting parameters             “Optimization of surface roughness in turning
       for turning operations based on taguchi                     alloy steel by using taguchi method” Scientific
       method” Proceedings of the international                    research and essays, vol. 6, no. 16, pp. 3474-
       conference on global manufacturing and                      3484.
       innovation, - July 27-29/2006, pp. 1-9.
[17]   Modh, N.R. et al. (2009), “An experimental
       investigation to optimize the process parameters
       of AISI 52100 steel in hot machining”
       International journal of engineering research
       and applications, vol. 1, no. 3, pp.483-489.
[18]   Natarajan, C. et al. (2011), “Investigation of
       cutting parameters of surface roughness for a
       non ferrous material using artificial neural
       network in cnc turning”, Journal of mechanical
       engineering, vol. 3, no. 1, pp. 1-14.
[19]   Ojel, T. and Karpat, Y. (2004), “Predictive
       modeling of surface roughness and tool wear in
       hard turning using regression and neural
       networks” International Journal of Machine
       Tools and Manufacture, vol. 45, pp. 467–479.
[10]   Pawade, R.S. and Joshi, S.S. (2011), “Multi-
       objective optimization of surface roughness and
       cutting forces in high speed turning of Inconel
       718 using taguchi grey relational analysis
       (TGRA)” International Journal of Advance
       Manufacturing technology, vol. 56, pp. 47-62.
[19]   Qamar, S.Z. et al. (2009), “Effect of heat
       treatment on mechanical properties of H13
       steel” 13th international research/expert
       conference „Trends in the development of
       machinery and associated technology‟,
       TMT2009, Hammamet, Tunisia, 16-21 October,
       2009 .
[20]   Ramanujam, R. et al. (2011), “Optimization of
       cutting parameters for turning Al-SiC(10p)
       MMC using ANOVA and grey relational
       analysis” International Journal of precision
       engineering and manufacturing, vol. 12, no.4,
       pp. 651-656.
[11]   Sahoo, A.K. and Sahoo, B. (2011), “Surface
       Roughness model and parametric optimization
       in finish turning using coated carbide insert:
                                                                                                   436 | P a g e

Weitere ähnliche Inhalte

Was ist angesagt?

Multi Objective Optimization on SS304
Multi Objective Optimization on SS304Multi Objective Optimization on SS304
Multi Objective Optimization on SS304Rohit Bhosale
 
NUMERICAL AND EXPERIMENTAL VALIDATION OF CHIP MORPHOLOGY
NUMERICAL AND EXPERIMENTAL VALIDATION OF CHIP MORPHOLOGYNUMERICAL AND EXPERIMENTAL VALIDATION OF CHIP MORPHOLOGY
NUMERICAL AND EXPERIMENTAL VALIDATION OF CHIP MORPHOLOGYIAEME Publication
 
COMPARISON OF SURFACE ROUGHNESS OF COLDWORK AND HOT WORK TOOL STEELS IN HARD ...
COMPARISON OF SURFACE ROUGHNESS OF COLDWORK AND HOT WORK TOOL STEELS IN HARD ...COMPARISON OF SURFACE ROUGHNESS OF COLDWORK AND HOT WORK TOOL STEELS IN HARD ...
COMPARISON OF SURFACE ROUGHNESS OF COLDWORK AND HOT WORK TOOL STEELS IN HARD ...ijmech
 
Process Parametric Optimization of CNC Vertical Milling Machine Using Taguchi...
Process Parametric Optimization of CNC Vertical Milling Machine Using Taguchi...Process Parametric Optimization of CNC Vertical Milling Machine Using Taguchi...
Process Parametric Optimization of CNC Vertical Milling Machine Using Taguchi...IOSR Journals
 
Analysis and simulation of chip formation & thermal effects on tool life usin...
Analysis and simulation of chip formation & thermal effects on tool life usin...Analysis and simulation of chip formation & thermal effects on tool life usin...
Analysis and simulation of chip formation & thermal effects on tool life usin...IAEME Publication
 
Optimization of tungsten inert gas welding on 6063 aluminum alloy on taguchi ...
Optimization of tungsten inert gas welding on 6063 aluminum alloy on taguchi ...Optimization of tungsten inert gas welding on 6063 aluminum alloy on taguchi ...
Optimization of tungsten inert gas welding on 6063 aluminum alloy on taguchi ...RSIS International
 
Experimental Approach of CNC Drilling Operation for Mild Steel Using Taguchi...
Experimental Approach of CNC Drilling Operation for Mild  Steel Using Taguchi...Experimental Approach of CNC Drilling Operation for Mild  Steel Using Taguchi...
Experimental Approach of CNC Drilling Operation for Mild Steel Using Taguchi...IJMER
 
Modeling and Analysis for Cutting Temperature in Turning of Aluminium 6063 Us...
Modeling and Analysis for Cutting Temperature in Turning of Aluminium 6063 Us...Modeling and Analysis for Cutting Temperature in Turning of Aluminium 6063 Us...
Modeling and Analysis for Cutting Temperature in Turning of Aluminium 6063 Us...IOSR Journals
 
Fracture Analysis of FDM Manufactured Acrylonitrile Butadiene Styrene Using Fem
Fracture Analysis of FDM Manufactured Acrylonitrile Butadiene Styrene Using FemFracture Analysis of FDM Manufactured Acrylonitrile Butadiene Styrene Using Fem
Fracture Analysis of FDM Manufactured Acrylonitrile Butadiene Styrene Using Fempaperpublications3
 
Optimization of Cutting Parameters Based on Taugchi Method of AISI316 using C...
Optimization of Cutting Parameters Based on Taugchi Method of AISI316 using C...Optimization of Cutting Parameters Based on Taugchi Method of AISI316 using C...
Optimization of Cutting Parameters Based on Taugchi Method of AISI316 using C...IRJET Journal
 
Investigation on Optimization of Machining Parameters in Wire EDM using Taguc...
Investigation on Optimization of Machining Parameters in Wire EDM using Taguc...Investigation on Optimization of Machining Parameters in Wire EDM using Taguc...
Investigation on Optimization of Machining Parameters in Wire EDM using Taguc...ijsrd.com
 

Was ist angesagt? (18)

Multi Objective Optimization on SS304
Multi Objective Optimization on SS304Multi Objective Optimization on SS304
Multi Objective Optimization on SS304
 
Fr3310111015
Fr3310111015Fr3310111015
Fr3310111015
 
NUMERICAL AND EXPERIMENTAL VALIDATION OF CHIP MORPHOLOGY
NUMERICAL AND EXPERIMENTAL VALIDATION OF CHIP MORPHOLOGYNUMERICAL AND EXPERIMENTAL VALIDATION OF CHIP MORPHOLOGY
NUMERICAL AND EXPERIMENTAL VALIDATION OF CHIP MORPHOLOGY
 
COMPARISON OF SURFACE ROUGHNESS OF COLDWORK AND HOT WORK TOOL STEELS IN HARD ...
COMPARISON OF SURFACE ROUGHNESS OF COLDWORK AND HOT WORK TOOL STEELS IN HARD ...COMPARISON OF SURFACE ROUGHNESS OF COLDWORK AND HOT WORK TOOL STEELS IN HARD ...
COMPARISON OF SURFACE ROUGHNESS OF COLDWORK AND HOT WORK TOOL STEELS IN HARD ...
 
T4201135138
T4201135138T4201135138
T4201135138
 
Process Parametric Optimization of CNC Vertical Milling Machine Using Taguchi...
Process Parametric Optimization of CNC Vertical Milling Machine Using Taguchi...Process Parametric Optimization of CNC Vertical Milling Machine Using Taguchi...
Process Parametric Optimization of CNC Vertical Milling Machine Using Taguchi...
 
6
66
6
 
G045063944
G045063944G045063944
G045063944
 
Av32317321
Av32317321Av32317321
Av32317321
 
Analysis and simulation of chip formation & thermal effects on tool life usin...
Analysis and simulation of chip formation & thermal effects on tool life usin...Analysis and simulation of chip formation & thermal effects on tool life usin...
Analysis and simulation of chip formation & thermal effects on tool life usin...
 
Optimization of tungsten inert gas welding on 6063 aluminum alloy on taguchi ...
Optimization of tungsten inert gas welding on 6063 aluminum alloy on taguchi ...Optimization of tungsten inert gas welding on 6063 aluminum alloy on taguchi ...
Optimization of tungsten inert gas welding on 6063 aluminum alloy on taguchi ...
 
Ijmet 10 02_011
Ijmet 10 02_011Ijmet 10 02_011
Ijmet 10 02_011
 
C04551318
C04551318C04551318
C04551318
 
Experimental Approach of CNC Drilling Operation for Mild Steel Using Taguchi...
Experimental Approach of CNC Drilling Operation for Mild  Steel Using Taguchi...Experimental Approach of CNC Drilling Operation for Mild  Steel Using Taguchi...
Experimental Approach of CNC Drilling Operation for Mild Steel Using Taguchi...
 
Modeling and Analysis for Cutting Temperature in Turning of Aluminium 6063 Us...
Modeling and Analysis for Cutting Temperature in Turning of Aluminium 6063 Us...Modeling and Analysis for Cutting Temperature in Turning of Aluminium 6063 Us...
Modeling and Analysis for Cutting Temperature in Turning of Aluminium 6063 Us...
 
Fracture Analysis of FDM Manufactured Acrylonitrile Butadiene Styrene Using Fem
Fracture Analysis of FDM Manufactured Acrylonitrile Butadiene Styrene Using FemFracture Analysis of FDM Manufactured Acrylonitrile Butadiene Styrene Using Fem
Fracture Analysis of FDM Manufactured Acrylonitrile Butadiene Styrene Using Fem
 
Optimization of Cutting Parameters Based on Taugchi Method of AISI316 using C...
Optimization of Cutting Parameters Based on Taugchi Method of AISI316 using C...Optimization of Cutting Parameters Based on Taugchi Method of AISI316 using C...
Optimization of Cutting Parameters Based on Taugchi Method of AISI316 using C...
 
Investigation on Optimization of Machining Parameters in Wire EDM using Taguc...
Investigation on Optimization of Machining Parameters in Wire EDM using Taguc...Investigation on Optimization of Machining Parameters in Wire EDM using Taguc...
Investigation on Optimization of Machining Parameters in Wire EDM using Taguc...
 

Andere mochten auch

Desenvolvendo Aplicações para Windows 8
Desenvolvendo Aplicações para Windows 8Desenvolvendo Aplicações para Windows 8
Desenvolvendo Aplicações para Windows 8Daniel Ferreira
 
Bases acuerdo social
Bases acuerdo socialBases acuerdo social
Bases acuerdo socialCaim Usach
 
Transtorno paranoide de la personalidad
Transtorno paranoide de la personalidad Transtorno paranoide de la personalidad
Transtorno paranoide de la personalidad Selenee 'Alleen Hdz
 
Teatro posterior a la guerra civil
Teatro posterior a la guerra civilTeatro posterior a la guerra civil
Teatro posterior a la guerra civilMIGUELANGELCRESPO
 
Tarea 1 ing. andree carreo e ing yvonne barillas
Tarea 1 ing. andree carreo e ing yvonne barillasTarea 1 ing. andree carreo e ing yvonne barillas
Tarea 1 ing. andree carreo e ing yvonne barillasyvonneteresa
 
Tarea 1 ing. andree carreo e ing yvonne barillas
Tarea 1 ing. andree carreo e ing yvonne barillasTarea 1 ing. andree carreo e ing yvonne barillas
Tarea 1 ing. andree carreo e ing yvonne barillasyvonneteresa
 
36524089 ingenieria-de-trafico
36524089 ingenieria-de-trafico36524089 ingenieria-de-trafico
36524089 ingenieria-de-traficoismael itriago
 
A importância das redes sociais para as empresas
A importância das redes sociais para as empresasA importância das redes sociais para as empresas
A importância das redes sociais para as empresasJuliana Abade
 

Andere mochten auch (20)

Bp32425428
Bp32425428Bp32425428
Bp32425428
 
Cq33557561
Cq33557561Cq33557561
Cq33557561
 
Cs33567571
Cs33567571Cs33567571
Cs33567571
 
Ec33772776
Ec33772776Ec33772776
Ec33772776
 
Dr33711716
Dr33711716Dr33711716
Dr33711716
 
Da33612620
Da33612620Da33612620
Da33612620
 
Dn33686693
Dn33686693Dn33686693
Dn33686693
 
Dz33758761
Dz33758761Dz33758761
Dz33758761
 
Tu decides
Tu decidesTu decides
Tu decides
 
Desenvolvendo Aplicações para Windows 8
Desenvolvendo Aplicações para Windows 8Desenvolvendo Aplicações para Windows 8
Desenvolvendo Aplicações para Windows 8
 
Orientacion profesional
Orientacion profesionalOrientacion profesional
Orientacion profesional
 
Bases acuerdo social
Bases acuerdo socialBases acuerdo social
Bases acuerdo social
 
Transtorno paranoide de la personalidad
Transtorno paranoide de la personalidad Transtorno paranoide de la personalidad
Transtorno paranoide de la personalidad
 
Teatro posterior a la guerra civil
Teatro posterior a la guerra civilTeatro posterior a la guerra civil
Teatro posterior a la guerra civil
 
Modulo I final
Modulo I finalModulo I final
Modulo I final
 
Tarea 1 ing. andree carreo e ing yvonne barillas
Tarea 1 ing. andree carreo e ing yvonne barillasTarea 1 ing. andree carreo e ing yvonne barillas
Tarea 1 ing. andree carreo e ing yvonne barillas
 
Tarea 1 ing. andree carreo e ing yvonne barillas
Tarea 1 ing. andree carreo e ing yvonne barillasTarea 1 ing. andree carreo e ing yvonne barillas
Tarea 1 ing. andree carreo e ing yvonne barillas
 
36524089 ingenieria-de-trafico
36524089 ingenieria-de-trafico36524089 ingenieria-de-trafico
36524089 ingenieria-de-trafico
 
Torax 3
Torax 3Torax 3
Torax 3
 
A importância das redes sociais para as empresas
A importância das redes sociais para as empresasA importância das redes sociais para as empresas
A importância das redes sociais para as empresas
 

Ähnlich wie Bq32429436

Investigations of machining parameters on surface roughness in cnc milling u...
Investigations of machining parameters on surface roughness in cnc  milling u...Investigations of machining parameters on surface roughness in cnc  milling u...
Investigations of machining parameters on surface roughness in cnc milling u...Alexander Decker
 
Modeling of Morphology and Deflection Analysis of Copper Alloys
Modeling of Morphology and Deflection Analysis of Copper AlloysModeling of Morphology and Deflection Analysis of Copper Alloys
Modeling of Morphology and Deflection Analysis of Copper AlloysIRJET Journal
 
Experimental Investigation and Parametric Studies of Surface Roughness Analys...
Experimental Investigation and Parametric Studies of Surface Roughness Analys...Experimental Investigation and Parametric Studies of Surface Roughness Analys...
Experimental Investigation and Parametric Studies of Surface Roughness Analys...IJMER
 
A literature review on optimization of cutting parameters for surface roughne...
A literature review on optimization of cutting parameters for surface roughne...A literature review on optimization of cutting parameters for surface roughne...
A literature review on optimization of cutting parameters for surface roughne...IJERD Editor
 
Experimental Investigation and Parametric Studies of Surface Roughness Analy...
Experimental Investigation and Parametric Studies of Surface  Roughness Analy...Experimental Investigation and Parametric Studies of Surface  Roughness Analy...
Experimental Investigation and Parametric Studies of Surface Roughness Analy...IJMER
 
Taguchi based Optimization of Cutting Parameters Affecting Surface Roughness ...
Taguchi based Optimization of Cutting Parameters Affecting Surface Roughness ...Taguchi based Optimization of Cutting Parameters Affecting Surface Roughness ...
Taguchi based Optimization of Cutting Parameters Affecting Surface Roughness ...IRJET Journal
 
Full factorial method for optimization of process parameters for surface roug...
Full factorial method for optimization of process parameters for surface roug...Full factorial method for optimization of process parameters for surface roug...
Full factorial method for optimization of process parameters for surface roug...Editor IJMTER
 
IRJET-Optimization of Machining Parameters Affecting Metal Removal Rate of Al...
IRJET-Optimization of Machining Parameters Affecting Metal Removal Rate of Al...IRJET-Optimization of Machining Parameters Affecting Metal Removal Rate of Al...
IRJET-Optimization of Machining Parameters Affecting Metal Removal Rate of Al...IRJET Journal
 
IRJET- Optimization of Machining Parameters for Turning on CNC Machine of Sta...
IRJET- Optimization of Machining Parameters for Turning on CNC Machine of Sta...IRJET- Optimization of Machining Parameters for Turning on CNC Machine of Sta...
IRJET- Optimization of Machining Parameters for Turning on CNC Machine of Sta...IRJET Journal
 
EFFECT OF NOSE RADIUS ON SURFACE ROUGHNESS DURING CNC TURNING USING RESPONSE ...
EFFECT OF NOSE RADIUS ON SURFACE ROUGHNESS DURING CNC TURNING USING RESPONSE ...EFFECT OF NOSE RADIUS ON SURFACE ROUGHNESS DURING CNC TURNING USING RESPONSE ...
EFFECT OF NOSE RADIUS ON SURFACE ROUGHNESS DURING CNC TURNING USING RESPONSE ...ijmech
 
Effect of process factors on surface roughness in dip cryogenic machining of ...
Effect of process factors on surface roughness in dip cryogenic machining of ...Effect of process factors on surface roughness in dip cryogenic machining of ...
Effect of process factors on surface roughness in dip cryogenic machining of ...eSAT Journals
 
NUMERICAL AND EXPERIMENTAL VALIDATION OF CHIP MORPHOLOGY
NUMERICAL AND EXPERIMENTAL VALIDATION OF CHIP MORPHOLOGYNUMERICAL AND EXPERIMENTAL VALIDATION OF CHIP MORPHOLOGY
NUMERICAL AND EXPERIMENTAL VALIDATION OF CHIP MORPHOLOGYIAEME Publication
 

Ähnlich wie Bq32429436 (20)

Iz2515941602
Iz2515941602Iz2515941602
Iz2515941602
 
Optimization of Thrust Force and Material Removal Rate in Turning EN-16 Steel...
Optimization of Thrust Force and Material Removal Rate in Turning EN-16 Steel...Optimization of Thrust Force and Material Removal Rate in Turning EN-16 Steel...
Optimization of Thrust Force and Material Removal Rate in Turning EN-16 Steel...
 
Ie3115371544
Ie3115371544Ie3115371544
Ie3115371544
 
Investigations of machining parameters on surface roughness in cnc milling u...
Investigations of machining parameters on surface roughness in cnc  milling u...Investigations of machining parameters on surface roughness in cnc  milling u...
Investigations of machining parameters on surface roughness in cnc milling u...
 
Modeling of Morphology and Deflection Analysis of Copper Alloys
Modeling of Morphology and Deflection Analysis of Copper AlloysModeling of Morphology and Deflection Analysis of Copper Alloys
Modeling of Morphology and Deflection Analysis of Copper Alloys
 
Ae4103177185
Ae4103177185Ae4103177185
Ae4103177185
 
Experimental Investigation and Parametric Studies of Surface Roughness Analys...
Experimental Investigation and Parametric Studies of Surface Roughness Analys...Experimental Investigation and Parametric Studies of Surface Roughness Analys...
Experimental Investigation and Parametric Studies of Surface Roughness Analys...
 
Ad25160164
Ad25160164Ad25160164
Ad25160164
 
A literature review on optimization of cutting parameters for surface roughne...
A literature review on optimization of cutting parameters for surface roughne...A literature review on optimization of cutting parameters for surface roughne...
A literature review on optimization of cutting parameters for surface roughne...
 
Be33331334
Be33331334Be33331334
Be33331334
 
Experimental Investigation and Parametric Studies of Surface Roughness Analy...
Experimental Investigation and Parametric Studies of Surface  Roughness Analy...Experimental Investigation and Parametric Studies of Surface  Roughness Analy...
Experimental Investigation and Parametric Studies of Surface Roughness Analy...
 
Fr3310111015
Fr3310111015Fr3310111015
Fr3310111015
 
Taguchi based Optimization of Cutting Parameters Affecting Surface Roughness ...
Taguchi based Optimization of Cutting Parameters Affecting Surface Roughness ...Taguchi based Optimization of Cutting Parameters Affecting Surface Roughness ...
Taguchi based Optimization of Cutting Parameters Affecting Surface Roughness ...
 
Full factorial method for optimization of process parameters for surface roug...
Full factorial method for optimization of process parameters for surface roug...Full factorial method for optimization of process parameters for surface roug...
Full factorial method for optimization of process parameters for surface roug...
 
IRJET-Optimization of Machining Parameters Affecting Metal Removal Rate of Al...
IRJET-Optimization of Machining Parameters Affecting Metal Removal Rate of Al...IRJET-Optimization of Machining Parameters Affecting Metal Removal Rate of Al...
IRJET-Optimization of Machining Parameters Affecting Metal Removal Rate of Al...
 
IRJET- Optimization of Machining Parameters for Turning on CNC Machine of Sta...
IRJET- Optimization of Machining Parameters for Turning on CNC Machine of Sta...IRJET- Optimization of Machining Parameters for Turning on CNC Machine of Sta...
IRJET- Optimization of Machining Parameters for Turning on CNC Machine of Sta...
 
EFFECT OF NOSE RADIUS ON SURFACE ROUGHNESS DURING CNC TURNING USING RESPONSE ...
EFFECT OF NOSE RADIUS ON SURFACE ROUGHNESS DURING CNC TURNING USING RESPONSE ...EFFECT OF NOSE RADIUS ON SURFACE ROUGHNESS DURING CNC TURNING USING RESPONSE ...
EFFECT OF NOSE RADIUS ON SURFACE ROUGHNESS DURING CNC TURNING USING RESPONSE ...
 
Effect of process factors on surface roughness in dip cryogenic machining of ...
Effect of process factors on surface roughness in dip cryogenic machining of ...Effect of process factors on surface roughness in dip cryogenic machining of ...
Effect of process factors on surface roughness in dip cryogenic machining of ...
 
247
247247
247
 
NUMERICAL AND EXPERIMENTAL VALIDATION OF CHIP MORPHOLOGY
NUMERICAL AND EXPERIMENTAL VALIDATION OF CHIP MORPHOLOGYNUMERICAL AND EXPERIMENTAL VALIDATION OF CHIP MORPHOLOGY
NUMERICAL AND EXPERIMENTAL VALIDATION OF CHIP MORPHOLOGY
 

Bq32429436

  • 1. Pankaj Sharma, Kamaljeet Bhambri / International Journal of Engineering Research and Applications (IJERA) ISSN: 2248-9622 www.ijera.com Vol. 3, Issue 2, March -April 2013, pp.429-436 Experimental Investigation of Parameters of CNC Turning by Taguchi based Grey Relational Analysis Pankaj Sharma*, Kamaljeet Bhambri** *(Department of Mechanical Engg., M.M. University, Mullana, Ambala (Haryana) - India) ** (Department of Mechanical Engg., S.U.S.C.E.T., Tangori, Mohali (Punjab) – India) Abstract As we know in actual machining there are many The AISI H13, a chromium based hot work tool factors which affect the surface roughness and Steel has a wide variety of applications in material removal rates i.e. cutting conditions, tool aluminum casting and extrusion dies, forging dies, variables and work piece variables. Cutting hot nut tools, hot header dies, extrusion mandrels, conditions includes speed, feed and depth of cut. The plastic molds, cores, die holder blocks, hot press tool variables includes tool material, nose radius, rake dies and specially hot work punches etc. In this angle, cutting edge geometry, tool vibration, tool study, the optimization of two response overhang, tool point angle etc. The work piece parameters (Surface roughness and Material variables include hardness and mechanical properties Removal Rate) by three machining parameters of the material. It is very difficult to take all the (cutting speed, feed rate and depth of cut) is parameters that control the response parameters for a investigated in high speed turning of H13 in dry particular manufacturing process. In a turning conditions. Taguchi’s L’18 orthogonal array and operation, it is very difficult to select the cutting analysis of variance (ANOVA) are used for parameters to achieve the high surface finish with individual optimization. The simultaneous optimal material removal rate. This study would help optimization is done by Grey Relational Analysis the operator to select the cutting parameters. approach. The different levels of all machining The hot work tool steels have the ability to resist parameters are used and experiments are done on softening under hot working conditions and after HMT STALLION-100 HS CNC lathe machine. numerous exposures to elevated operating The optimum condition for combined effects was temperatures. Hot work material used for the present found V5-F1-D1 and the optimal value of the study is H13 steel. The nominal chemical surface roughness (Ra) comes out to be 0.84 (μm) compositions are {Chromium (5%), Vanadium (1%), and of MRR is 488.8 (mm³/sec). The optimum Molybdenum (1.5%), Carbon (0.4%), Maganese results are also verified with the help of (0.35%)}. This H13 tool steel is suitable for forging confirmation experiments. dies, forging die inserts, hot gripper dies, hot nut tools, hot header dies, brass forging and pressing Keywords: CNC Turning, Optimization, ANOVA, dies, aluminum base dies, aluminum casting and MRR, Surface Roughness (Ra), Taguchi Method, extrusion dies, zinc die casting dies, extrusion Grey Relational Analysis, GRG. mandrels, plastic molds, cores, die holder blocks, hot press dies and hot work punches etc. 1. Introduction This paper is about experimentally investigating and Quality plays a major role in today‟s manufacturing optimizing the machining parameters for Material market. From Customer‟s viewpoint quality is very Removal Rate (MRR) and Surface Roughness in important because the quality of products affects the CNC turning by Taguchi method and grey relational degree of satisfaction of the consumers during usage analysis approach.. Taguchi‟s orthogonal arrays are of the product. It also improves the goodwill of the highly fractional designs, used to estimate main company. effects using very few experimental runs. These High speed turning operation is done on CNC lathe. designs are not only applicable for two level factorial The quality of the surface plays a very important role experiments, but also can investigate main effects in the performance of dry turning because a good when factors have more than two levels. Designs are quality turned surface surely improves fatigue also available to investigate main effects for some strength, corrosion resistance and creep life. Surface mixed level experiments where the factors included roughness also affects on some functional attributes do not have the same number of levels. of parts, such as, contact causing surface friction, For example, a four-level full factorial design with wearing, light reflection, ability of distributing and five factors requires 1024 runs while the Taguchi also holding a lubricant, load bearing capacity, orthogonal array reduces the required number of runs coating and resisting fatigue. to 16 only. 429 | P a g e
  • 2. Pankaj Sharma, Kamaljeet Bhambri / International Journal of Engineering Research and Applications (IJERA) ISSN: 2248-9622 www.ijera.com Vol. 3, Issue 2, March -April 2013, pp.429-436 Ojel, T. et al. (2004) has studied the effects of cutting 2. Design of Experiment edge geometry, work piece hardness, feed rate and The experiments are designed using Taguchi method cutting speed on surface roughness and resultant so that effect of all the parameters could be studied forces in the finish hard turning of AISI H13 steel. with minimum possible number of experiments. Cubic Boron Nitrite inserts with two distinct edge Using Taguchi method, Appropriate Orthogonal preparations (chamfered and honed) and through Array has been chosen and experiments have been hardened AISI H13 steel bars were used. The honed performed as per the set of experiments designed in Edge geometry and lower work piece surface the orthogonal array. Signal to Noise ratios are also hardness resulted in better surface roughness. calculated for analyzing the effect of machining Ghani, M.U. et al. (2007) has presented results of an parameters more accurately. The results of the investigation into the tool life and the tool wear experimentation are analyzed analytically and behaviour of low content CBN cutting tools used in graphically as well. ANOVA is used to determine the hard turning of hardened H13 tool steel using finite percentage contribution of all factors upon each element thermal modeling. It involved measuring the response individually. cutting forces, cutting temperatures, tool wear and the contact area. Using the measured cutting forces and 3. Taguchi Method the contact area in the orthogonal cutting model, he The traditional experimental design methods are very calculated the heat flux on the tool. The heat partition complicated and difficult to use. Additionally, these into the tool was estimated to be around 21–22% for methods also require a large number of experiments conventional speeds, 14% for high-speed turning. when the number of process parameters increases. In The tool wear, however, was found to be dominated order to minimize the number of tests required, by chipping for both cutting speeds and could be Taguchi experimental design method, a powerful tool reduced considerably by reducing the amount of heat for designing high-quality system, was developed by entering the tool. Taguchi. Taguchi method uses a design of orthogonal Jaharah, A.G. et al (2009) has studied the effect of arrays to study the entire parameter space with small uncoated carbide tool geometries in turning AISI number of experiments only. Taguchi recommends 1045 using finite element analysis. This paper analyzing the mean response for each run in the presents the application of Finite element method array, and he also suggests to analyze variation using (FEM) in simulating the effect of cutting tool an appropriately chosen signal-to-noise ratio (S/N). geometries on the effective stress and temperature There are 3 Signal-to-Noise ratios of common increased in turning. The tool geometries studied interest for optimization of static problems: were various rake (α) and clearance (β) in the different ranges. The minimum effective stress of 1. Smaller The Better 1700MPa is achieved using rake and clearance angles S ∑Yi 2 of 5° and 5° respectively with cutting speed of = −10 log N n 300mm/min, and feed rate of 0.25mm/rev. Chakradhar, D. and Venu Gopal, A. (2011) has done 2. Larger The Better S 1 the multi objective optimization of electrochemical N = −10 log⁡ ∑ yi ²)/n) (( machining of EN-31 steel by grey relational analysis. The process parameters considered are electrolyte 3. NOMINAL-THE-BEST concentration, feed rate and applied voltage and are 𝑆 𝑦2 optimized with considerations of multiple 𝑁 = 10 log⁡ 𝑠 2 ) ( performance characteristics including material Where, removal rate, over cut, cylindricity error and surface Yi - ith observed value of the response, roughness. With the help of Analysis of variance n - Number of observations in a trial, (ANOVA) it was observed that feed rate is the y - Average of observed values (responses) significant process parameter that affects the ECM s - Variance. robustness. Hassan, K. et al. (2012) has done the experimental Regardless of the category of the performance investigation of material removal rate (MRR) in CNC characteristics, the higher S/N ratio corresponds to a turning of C34000 using Taguchi method using L‟27 better performance. Therefore, the optimal level of array. When the MRR is optimized alone the MRR the process parameters is the level with the highest comes out to be 8.91. The optimum levels of process S/N value. The statistical analysis of the data is parameters for simultaneous optimization of MRR performed by analysis of variance (ANOVA) to study have been identified. Optimal results were verified the contribution of the various factors and through confirmation experiments. It was concluded interactions and to explore the effects of each process that MRR is mainly affected by cutting speed and on the observed values. feed rate. 430 | P a g e
  • 3. Pankaj Sharma, Kamaljeet Bhambri / International Journal of Engineering Research and Applications (IJERA) ISSN: 2248-9622 www.ijera.com Vol. 3, Issue 2, March -April 2013, pp.429-436 4. Experimentation to determine the optimum combination of the In this study, three machining parameters were machining parameters. selected with different levels as given in Table 1. The A series of turning tests are conducted to assess the experimental design was according to an L‟18 array effect of turning parameters on surface roughness in based on Taguchi method. A set of experiments turning of H13. The Material Removal Rate designed and conducted to investigate the relation calculations and experimental results of the surface between the process parameters and response factor. roughness for turning of H13 with different turning Minitab 16 software is used for optimization and parameters are shown in Table 3. graphical analysis of obtained data. Table 3 Design of experiment and calculations Table 1 Turning parameters and levels S. Weight Weight Machining Means of Levels CS F DOC No. before after Time Material (m/sec) (mm/rev) (mm) turning turning (sec.) Removal 1 150 0.1 0.5 (gm) (gm) Rate 2 180 0.2 1 (mm³/sec) 3 210 0.3 1.5 1 454.1 425.2 12.0 304.85 4 240 2 425.2 406.7 7.0 334.53 5 270 3 406.7 386.7 5.7 444.14 6 300 4 456.4 424.2 10.4 391.91 5 424.2 399.4 8.0 392.40 The work material selected for this experiment is 6 399.4 380.9 5.5 425.77 H13 of Ø 32 mm, length 70 mm in the present study. 7 456.2 421.2 10.1 438.65 The chemical composition of H13 sample can be 8 421.2 399.3 6.4 433.14 seen in Tables 2. 9 399.3 382.9 5.2 399.22 10 454.0 415.9 9.6 502.37 Table 2 Chemical composition of H13 sample 11 415.9 392.2 6.2 483.87 Ele- C Cr V Mo SI S P 12 392.2 377.4 3.9 480.36 ments 13 452.0 418.8 8.5 494.41 % 0.36 4.9 0.9 1.4 1.04 0.03 0.03 14 418.8 390.1 7.2 504.57 15 390.1 372.9 4.4 494.82 The turning tests were carried out to determine the 16 457.0 424.4 8.5 483.99 Material Removal Rate and Surface Roughness under 17 424.4 402.7 6.5 422.59 various turning parameters. A HMT STALLION-100 18 402.7 384.4 4.9 459.82 HS CNC lathe machine is used for experimentation. Roughness is measured using stylus type surface Table 4 Design of experiment and calculations roughness tester „Surftest SJ-201‟ made of Mitutoyo, Ex. CS F D MRR Ra Japan. The cut-off length (λ) was chosen as 0.8cm for No. (m/ ( mm/ (mm (mm³/ (μm) each roughness measurement. An average of 5 min) rev) ) sec) measurements of the surface roughness was taken to 1 150 0.1 0.5 304.85 0.57 use in the multi-criteria optimization. 2 150 0.2 1.0 334.53 0.96 The Material Removal Rate, MRR (mm³/ min) was 3 150 0.3 1.5 444.14 1.04 calculated using formula: 4 180 0.1 0.5 391.91 0.59 𝑊𝑖 −𝑊𝑓 5 180 0.2 1.0 392.40 0.96 𝑀𝑅𝑅 = 𝜌𝑠 𝑡 𝑚𝑚³/𝑠𝑒𝑐 6 180 0.3 1.5 425.77 1.09 Where, Wi = Initial weight of work piece in gm 7 210 0.1 1.0 438.65 0.82 Wf= Final weight of work piece in gm 8 210 0.2 1.5 433.14 0.88 t = Machining time in seconds 9 210 0.3 0.5 399.22 0.86 ρs= Density of mild steel (7.9 x 10ˉ³ gm/mm³). 10 240 0.1 1.5 502.37 0.97 11 240 0.2 0.5 483.87 0.84 5. Results and Discussions 12 240 0.3 1.0 480.36 0.94 In high speed turning operation, surface roughness is 13 270 0.1 1.0 494.41 0.92 an important criterion. The purpose of the analysis of 14 270 0.2 1.5 504.57 1.06 variance (ANOVA) is to investigate which design 15 270 0.3 0.5 494.82 1.04 parameter significantly affects the surface roughness. 16 300 0.1 1.5 483.99 1.06 Based on the ANOVA, the relative importance of the 17 300 0.2 0.5 422.59 1.02 machining parameters with respect to material 18 300 0.3 1.0 459.82 0.98 removal rate and surface roughness was investigated 431 | P a g e
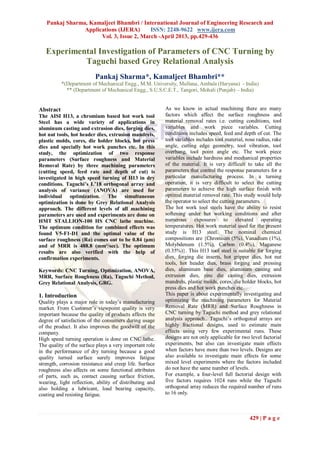
  • 4. Pankaj Sharma, Kamaljeet Bhambri / International Journal of Engineering Research and Applications (IJERA) ISSN: 2248-9622 www.ijera.com Vol. 3, Issue 2, March -April 2013, pp.429-436 Table 5 ANOVA Table for means of MRR V D SS MS F P C F C 5 41373 8274. 11.83 0.002 73.79 S 7 *** F 2 1526 762.9 1.09 0.381 2.7 2* D 2 7566 3783. 5.41 0.033 13.49 2 ** E 8 5598 699.7 9.98 Fig 2 Main effect plot for means of Ra T 17 56064 100 Here, Table 6 Response Table for means of MRR V-Variable, CS-Cutting Speed, Level CS F DOC F-Feed Rate, D-Depth Of Cut, 1 361.2 436.0 416.2 SR-Surface Roughness, E-Error, 2 403.4 428.5 433.4 T-Total, DF-Degree of Freedom, 3 423.7 450.7 465.7 SS-Sum of Squares, MS-Mean of Squares, 4 488.9 F-a statistical parameter, P-Percentage, 5 497.9 C-% Contribution. 6 455.5 Here *** & ** represents most significant and Delta 136.8 22.2 49.5 significant parameters and * as less significant. Rank 1 3 2 6. Grey Relational Analysis In the Grey relational analysis the quality characteristics are first normalized, ranging from zero to one. This process is known as Grey Relational Generation. Then the Grey Relational Coefficient based on normalized experimental data is calculated to represent the correlation between the desired and the actual experimental data. Then overall Grey Relational Grade (GRG) is determined by averaging the Grey relational coefficient corresponding to Fig 1 Main effect plot for means of MRR selected responses. Table 7 ANOVA Table for means of Ra The overall performance characteristic of the V D SS MS F P C multiple response process depends on the calculated F GRG. This Grey relational approach converts a C 5 0.0826 0.016 1.77 0.226 22.35 multiple response process optimization problem into S 5 * a single response optimization problem. The optimal F 2 0.0954 0.047 5.10 0.037 25.82 parametric combination is then evaluated, which 7 ** would result in the highest Grey relational grade. The D 2 0.1166 0.058 6.23 0.023 31.56 optimal factor setting for maximizing the overall 2 *** Grey relational grade can be performed using the E 8 0.0749 0.009 20.27 Taguchi method. 3 In Grey relational generation, the normalized MRR T 17 0.3695 100 should follow the larger-the-better (LB) criterion, which can be expressed as: max yi k – yi k Table 8 Response Table for means of Ra xi k = Level CS F DOC max yi k – min yi k 1 0.8567 0.8217 0.8200 The normalized Ra should follow the smaller-the- 2 0.8800 0.9533 0.9300 better (SB) criterion which can be expressed as: 3 0.8533 0.9917 1.0167 yi k − min yi k xi k = 4 0.9167 max yi k – min yi k 5 1.0067 Where, xi(k) and xj(k) are the value after Grey 6 1.0200 Relational Generation for LB and SB criteria. Max Delta 0.1667 0.1700 0.1967 yi(k) is the largest value of yi(k) for kth response and Rank 3 2 1 min yi(k) is the minimum value of yi(k) for the kth response. 432 | P a g e
  • 5. Pankaj Sharma, Kamaljeet Bhambri / International Journal of Engineering Research and Applications (IJERA) ISSN: 2248-9622 www.ijera.com Vol. 3, Issue 2, March -April 2013, pp.429-436 The Grey relational coefficient ξi(k) can be calculated Table 10: Grey Relational Analysis Calculations as: S. GRGC RSDC GRCC ξi(k) = Δmin + Ψ Δmax N. Δ oi(k) + Ψ Δmax MR Ra MR Ra MR Ra R R R And Δ oi = ║ xo(k) – xi(k) ║ xo 1.000 1.000 1.000 1.000 1.000 1.000 1 0.000 1.000 1.000 0.000 0.333 1.000 Where Δ oi is the difference between absolute value 2 0.148 0.250 0.852 0.750 0.369 0.400 xo(k) and xi(k). Ψ is the distinguishing coefficient 0 ≤ 3 0.697 0.096 0.303 0.904 0.622 0.356 Ψ ≥ 1. Δ min and Δ max are the minimum and 4 0.431 0.962 0.569 0.038 0.467 0.929 maximum value among the Δ oi for corresponding kth 5 0.438 0.250 0.562 0.750 0.470 0.400 response. 6 0.605 0.000 0.395 1.000 0.558 0.333 Now the Grey Relational Grade (GRG) can be 7 0.669 0.519 0.331 0.481 0.601 0.509 calculated as : 8 0.642 0.404 0.358 0.596 0.582 0.456 9 0.472 0.442 0.528 0.558 0.486 0.472 γi = 10 0.988 0.231 0.012 0.769 0.976 0.394 Where n is the number of process responses. 11 0.896 0.481 0.108 0.519 0.822 0.490 The higher value of the GRG corresponds to a 12 0.878 0.288 0.122 0.712 0.803 0.412 relational degree between the Reference Sequence 13 0.949 0.327 0.051 0.673 0.907 0.426 xo(k) and the given sequence xi(k). The Reference 14 1.000 0.058 0.000 0.942 1.000 0.346 Sequence xo(k) represents the best process sequence. 15 0.951 0.096 0.049 0.904 0.910 0.356 Therefore, a higher GRG means that the 16 0.896 0.058 0.104 0.942 0.827 0.346 corresponding parameter combination is closer to the 17 0.589 0.135 0.411 0.865 0.548 0.366 optimal. The mean response for the GRG and the 18 0.775 0.212 0.225 0.788 0.689 0.388 main effect plot of the GRG are very important because the optimal process condition can be Where, evaluated from this plot. GRGC- Grey Relational Generation Calculation, RSDC- Reference Sequence Definition Calculation, Table 9 S/N Ratio Calculation for MRR and Ra GRCC- Grey Relational Coefficient Calculation S. No. Mean Values S/N Ratios Table 11 GRG calculation Xo MRR Ra MRR Ra S. No. GRG Rank 1 304.85 0.57 49.681 4.882 Mean S/N Ratio 2 334.53 0.96 50.488 0.354 1 0.6665 -3.5240 3 444.14 1.04 52.950 -0.340 2 0.3845 -8.3020 4 391.91 0.59 51.863 4.582 3 0.4890 -6.2138 5 392.40 0.96 51.874 0.354 4 0.6980 -3.1228 6 425.77 1.09 52.583 -0.748 5 0.4350 -7.2302 7 438.65 0.82 52.842 1.723 6 0.4455 -7.0230 8 433.14 0.88 52.732 1.110 7 0.5550 -5.1141 9 399.22 0.86 52.024 1.310 8 0.5190 -5.6966 10 502.37 0.97 54.020 0.264 9 0.4790 -6.3932 11 483.87 0.84 53.694 1.514 10 0.6850 -3.2861 12 480.36 0.94 53.631 0.537 11 0.6560 -3.6619 13 494.41 0.92 53.881 0.724 12 0.6075 -4.3290 14 504.57 1.06 54.058 -0.506 13 0.6665 -3.5240 15 494.82 1.04 53.888 -0.340 14 0.6730 -3.4397 16 483.99 1.06 53.696 -0.506 15 0.6330 -3.9719 17 422.59 1.02 52.518 -0.172 16 0.5865 -4.6346 18 459.82 0.98 53.251 0.175 17 0.4570 -6.8016 Max. 304.85 0.57 49.681 -0.748 18 0.5385 -5.3762 Min. 504.57 1.09 54.058 4.882 433 | P a g e
  • 6. Pankaj Sharma, Kamaljeet Bhambri / International Journal of Engineering Research and Applications (IJERA) ISSN: 2248-9622 www.ijera.com Vol. 3, Issue 2, March -April 2013, pp.429-436 Table 12: ANOVA calculations for means of GRG V D SS MS F P C F C 5 0.0706 0.0141 3.50 0.05 41.29*** S F 2 0.0546 0.0273 6.78 0.01 31.93** D 2 0.0135 0.0067 1.68 0.24 7.89* E 8 0.0323 0.0040 18.89 T 17 0.1710 100 Fig 4Main effect plot for S/N Ratio of GRG Table 13: ANOVA calculations for S/N ratio of GRG V D SS MS F P C F C 5 17.65 3.531 3.15 0.07 40.30 S 3 *** F 2 13.75 6.878 6.14 0.02 31.40 6 ** D 2 3.430 1.715 1.53 0.27 7.83* E 8 8.965 1.121 20.47 T 17 43.80 100 Fig 5 Interaction plot for means of GRG 4 7. Determination of Optimum Condition: Table 14 Response Table for means of GRG Both the response and S/N ratio are used to derive the Level CS F DOC optimum conditions. Since for quality characteristic, 1 0.5133 0.6429 0.5983 Grey Relational Grade larger the better approach is 2 0.5262 0.5207 0.5312 desirable, the largest is the ideal level for a 3 0.5177 0.5321 0.5663 parameter. The S/N ratio is always highest at the 4 0.6495 optimum condition. The graphs of Figures 2 and 3 5 0.6575 are used to determine the optimum process 6 0.5273 parameters combination. The optimum combination Delta 0.1442 0.1222 0.0671 is therefore V5-F1-D1. Rank 1 2 3 7.1 Predictive Equation and Verification: Table 15 Response Table for S/N Ratio of GRG The predicted values of GRG, MRR and Ra at the Level CS F DOC optimal levels are calculated by using the relation: 1 -6.013 -3.868 -4.579 2 -5.792 -5.855 -5.646 3 -5.735 -5.551 -5.049 4 -3.759 Where, 5 ñ - Predicted response value after optimization, -3.645 6 -5.604 - Total mean value of quality characteristic, Delta 2.368 1.988 1.067 - Mean value of quality characteristic at Rank 1 2 3 optimum level of each parameter and o - Number of main machining parameters that affect the response parameter. Applying this relation, predicted values of GRG, MRR and Ra at the optimum conditions are calculated as: 1. ñGRG = 0.5652 + [ (0.6575 - 0.5652) + (0.6429 – 0.5652) + (0.5983 - 0.5652) ] = 0.7683 2. ñRa = 0.9222 + [ (1.0067 – 0.9222) + (0.8217 – 0.9222) + (0.8200 – 0.9222 ] Fig 3 Main effect plot for means of GRG = 0.8040 µm. 434 | P a g e
  • 7. Pankaj Sharma, Kamaljeet Bhambri / International Journal of Engineering Research and Applications (IJERA) ISSN: 2248-9622 www.ijera.com Vol. 3, Issue 2, March -April 2013, pp.429-436 OL-Optimum Levels of Parameters 3. ñMRR = 438.4 + [ (497.9 – 438.4) + (436.0 – POV-Predicted Optimum value 438.4) + (416.2 – 438.4) ] EOV-Experimental Optimum Value = 473.3 mm³/sec. OR-Optimum Range of MRR and Surface Roughness The robustness of this parameter optimization is verified experimentally. This requires the 9. Conclusions confirmation run at the predicted optimum In this study, the Grey relational based Taguchi conditions. The experiment is conducted twice at the method was applied for the multiple performance predicted optimum conditions. characteristics of turning operations. A grey relational analysis of the Material removal Verifications rate and the surface roughness obtained from the 1. For Material Removal Rate (MRR) Taguchi method reduced from the multiple The calculated value of MRR at the optimum performance characteristics to a single performance condition (V5-F1-D1) is 488.8 mm³/sec. The error in characteristic which is called the grey relational the predicted optimum value (473.3) and the grade. Therefore, the optimization of the complicated calculated value (488.8) is only 3.2%. multiple performance characteristics of the processes can be greatly simplified using the Grey relational 2. For Surface Roughness (Ra) based Taguchi method. It is also shown that the The average of two measured values (0.82, 0.86) of performance characteristics of the turning operations, the response at the optimum condition (V5-F1-D1) is such as the material removal rate and the surface 0.84 μm. The error in the predicted optimum value roughness are greatly enhanced by using this method. (0.8040) and experimental value (0.84) is only 4.4%. References Hence, so good agreement between the actual and the [1] Akhyar, G. et al. (2008), “Application of predicted results is observed. Since the percentage Taguchi method in the optimization of turning error is less than 5%, it confirms excellent parameters for surface roughness”, International reproducibility of the results. The results show that Journal of Science Engineering and using the optimal parameter setting (V5-F1-D1) a Technology, vol.1, no.3, pp. 60-66. higher material removal rate is achieved with lower [2] Chakradhar, D. and Venu Gopal, A. (2011), surface roughness. “Multi-objective optimization of electrochemical machining of en31 steel by 8. Results grey relational analysis”, International Journal The effect of three machining parameters i.e. Cutting of Modeling and optimization, vol. 1, no.2, pp. speed, Feed rate and Depth of cut and their 113-117. interactions are evaluated using ANOVA. The [3] David Pye et al. “Chromiun Steel Article for purpose of the ANOVA in this study is to identify the AISI H13 Hot Work Tool Steel by Pye important turning parameters in prediction of Metallurgical consulting” at Material Removal Rate and Surface roughness. Some http://www.heattreatonline.com/ important results come from ANOVA and plots are ChromiumSteelArticle.pdf given here. Table 16 shown below shows that optimal [4] Datta, R. and Majumdar, A. (2010), values of surface roughness and material removal rate “Optimization of turning process parameters that lie between the optimal ranges. using multi-objective evolutionary algorithm” Institute of electrical and electronics engineers Table 16 Optimal values of machining and (IEEE), vol. 2010, article id 978-1-4244-8126- response parameters 2/10. CP OV OL POV EOV OR [5] Dhanabalan, S. et al. (2011), “Optimization of EDM process parameters with multiple CS 270 V5- MRR= MRR= 473.3 performance characteristics for titanium grades” 473.3 488.8 <MRR> European Journal of Scientific research, vol. 68, F 0.1 F1- 488.8 no. 3, pp. 297-305. [6] Gonzalez, L.W.H. et al. (2011), “Study of D 0.5 D1 Ra= Ra= 0.8040 performance of high speed turning of AISI1045 0.8040 0.84 < Ra > using the volumetric dimension of cutting tool 0.84 life” International journal of advances in machining and forming operations, vol. 3, no.1, Where, pp.19-32. CP-Cutting Parameters OV-Optimal Values of Parameters 435 | P a g e
  • 8. Pankaj Sharma, Kamaljeet Bhambri / International Journal of Engineering Research and Applications (IJERA) ISSN: 2248-9622 www.ijera.com Vol. 3, Issue 2, March -April 2013, pp.429-436 [7] Ghani, M.U. et al. (2007), “An investigation of Response Surface Methodology and Taguchi heat partition and tool wear in hard turning of Approach” International journal of industrial H13 tool steel with CBN cutting tools” engineering computations, vol. 2, pp. 819-830. International Journal of Advance [12] Sathiya, P. and Jaleel, M.Y.A. (2010), “Grey Manufacturing and Technology, article id 170- Based Taguchi method for optimization of bead 007-1282-7. geometry in laser bead on plate welding” [8] Hassan, K. et al. (2012) “Experimental Advances in Production Engineering and investigation of Material removal rate in CNC Management, vol. 5, no. 4, pp. 225-234. turning using Taguchi method” International [13] Solhjoei, N. et al. (2012), “Investigation in Journal of Engineering Research and electric discharge machining”Research Journal application, vol. 2, no. 2, pp. 1581-1590 of Applied Science, Engineering and [14] Jaharah, A.G. et al. (2009), “Surface integrity of echnology, vol. 4, no. 14, pp. 3005-3014. AISI H13 tool steel in end milling process” [14] Thamizhmani, S. et al. (2007), “Analysis of International Journal of Mechanical and surface Roughness by using Taguchi Method”, Materials Engineering (IJMME), vol. 4, no. 1, Achievements in materials and manufacturing pp. 88 -92. engineering, vol. 20, no. 1, pp. 503-505. [9] Mahapatra, S.S. et al. (2006), “Parametric [15] Velibor, M. and Milos, M. (2011), analysis and optimization of cutting parameters “Optimization of surface roughness in turning for turning operations based on taguchi alloy steel by using taguchi method” Scientific method” Proceedings of the international research and essays, vol. 6, no. 16, pp. 3474- conference on global manufacturing and 3484. innovation, - July 27-29/2006, pp. 1-9. [17] Modh, N.R. et al. (2009), “An experimental investigation to optimize the process parameters of AISI 52100 steel in hot machining” International journal of engineering research and applications, vol. 1, no. 3, pp.483-489. [18] Natarajan, C. et al. (2011), “Investigation of cutting parameters of surface roughness for a non ferrous material using artificial neural network in cnc turning”, Journal of mechanical engineering, vol. 3, no. 1, pp. 1-14. [19] Ojel, T. and Karpat, Y. (2004), “Predictive modeling of surface roughness and tool wear in hard turning using regression and neural networks” International Journal of Machine Tools and Manufacture, vol. 45, pp. 467–479. [10] Pawade, R.S. and Joshi, S.S. (2011), “Multi- objective optimization of surface roughness and cutting forces in high speed turning of Inconel 718 using taguchi grey relational analysis (TGRA)” International Journal of Advance Manufacturing technology, vol. 56, pp. 47-62. [19] Qamar, S.Z. et al. (2009), “Effect of heat treatment on mechanical properties of H13 steel” 13th international research/expert conference „Trends in the development of machinery and associated technology‟, TMT2009, Hammamet, Tunisia, 16-21 October, 2009 . [20] Ramanujam, R. et al. (2011), “Optimization of cutting parameters for turning Al-SiC(10p) MMC using ANOVA and grey relational analysis” International Journal of precision engineering and manufacturing, vol. 12, no.4, pp. 651-656. [11] Sahoo, A.K. and Sahoo, B. (2011), “Surface Roughness model and parametric optimization in finish turning using coated carbide insert: 436 | P a g e