Unblocking The Main Thread Solving ANRs and Frozen Frames
A43040105
1. K. Sureka et al Int. Journal of Engineering Research and Applications www.ijera.com
ISSN : 2248-9622, Vol. 4, Issue 3( Version 4), March 2014, pp.01-05
www.ijera.com 1 | P a g e
A Vessel Tracking System for the Robust Extraction of Vascular
Network Connectivity in Retinal Fundus Images
K. Sureka1
, M.E., R. Vignesh2
, M.E
1
Student/Dept. of Applied Electronics
2
Assistant Professor/ECE Jayam College of Engineering and Technology, Dharmapuri DT, India.
Abstract
Blood vessel morphology is an important indicator for diseases like cardiovascular, hypertension and diabetic
retinopathy. The wrong identification of vessels may result in a large variation of these measurements, leading
to a wrong clinical diagnosis. The problem of identifying true vessels as a post- processing step to vascular
structure segmentation. The segmented vascular structure as a vessel segment graph and formulate the problem
of identifying vessels as one of finding the optimal forest in the graph given a set of constraints. Automatic
method to detect blood vessel crossovers and bifurcations simultaneously. Detection is performed by interactive
segmentation using graph cut algorithm to find all potential abnormalities. Vessel segmentation is the most
important step for accurate and efficient vascular feature analysis to achieve high pixel precision of the true
vessels for clean segmented retinal images.
Index Terms: retinal image analysis, vascular structure, vessel identification, segmentation
I. INTRODUCTION
A Retinal image provides a snapshot of what
is happening inside the human body. In practice, the
state of the retinal vessels has been shown to reflect
the cardiovascular condition of the body.
Measurements to quantify retinal vascular structure
and properties have shown to provide good
diagnostic capabilities for the risk of cardiovascular
diseases. The central retinal artery equivalent
(CRAE) and the central retinal vein equivalent
(CRVE) are measurements of the diameters of the six
largest arteries and veins in the retinal image
respectively. These measurements are found to have
good correlation with hypertension, coronary heart
diseases and stroke. However, they require the
accurate extraction of distinct vessels from a retinal
image. This is a challenging problem due to
ambiguities caused by vessel bifurcations and
crossovers.
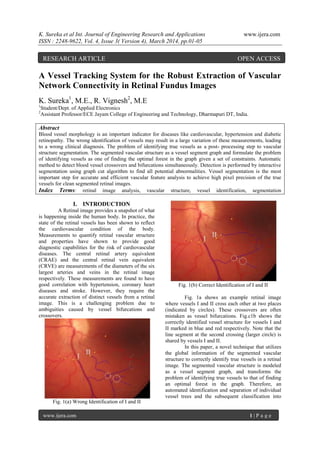
Fig. 1(a) Wrong Identification of I and II
Fig. 1(b) Correct Identification of I and II
Fig. 1a shows an example retinal image
where vessels I and II cross each other at two places
(indicated by circles). These crossovers are often
mistaken as vessel bifurcations. Fig.c1b shows the
correctly identified vessel structure for vessels I and
II marked in blue and red respectively. Note that the
line segment at the second crossing (larger circle) is
shared by vessels I and II.
In this paper, a novel technique that utilizes
the global information of the segmented vascular
structure to correctly identify true vessels in a retinal
image. The segmented vascular structure is modeled
as a vessel segment graph, and transforms the
problem of identifying true vessels to that of finding
an optimal forest in the graph. Therefore, an
automated identification and separation of individual
vessel trees and the subsequent classification into
RESEARCH ARTICLE OPEN ACCESS
2. K. Sureka et al Int. Journal of Engineering Research and Applications www.ijera.com
ISSN : 2248-9622, Vol. 4, Issue 3( Version 4), March 2014, pp.01-05
www.ijera.com 2 | P a g e
Vessel
Segmentation
arteries and veins may be requires for vessel specific
morphology analysis.
II. PROPOSED METHOD
An automated method is introduced for
structural mapping of retinal vessels by modeling the
vessel segmentation into a vessel segment map and
identifying the vessel trees based on graph search.
Retinal vessel extraction involves segmentation of
vascular structure and identification of distinct
vessels by linking up segments in the vascular
structure to give complete vessels. One branch of
work, termed vessel tracking, performs vessel
segmentation and identification at the same time.
These methods require the start points of vessels to
be predetermined. Each vessel is tracked individually
by repeatedly finding the next vessel point with a
scoring function that considers the pixel intensity and
orientation in the vicinity of the current point in the
image. Bifurcations and crossovers are detected using
some intensity profile. This approach of tracking
vessels one at a time does not provide sufficient
information for disambiguating vessels at
bifurcations and crossovers.
Another branch of works treat vessel
identification as a post-processing step to
segmentation. A graph formulation was used with
dijkstra’s shortest path algorithm to identify the
central vein. Similarly, Dijkstra’s algorithm used to
identify vessels one at a time and evaluated their
method on a set of 15 images. However, these
methods may lead to incorrect vessel identification
because choosing the correct vessel segment to
connect at a bifurcation or crossover requires
information from other nearby vessels. Our approach
differs from existing works in that we identify
multiple vessels simultaneously and use global
structure information to figure out if linking a vessel
segment to one vessel will lead to an overlapping or
adjacent vessel being wrongly identified.
Fig. 2. Block diagram of proposed method
2.1 Vessel Segmentation and Image Preprocessing
The retinal vessels are segmented using the
standard approach (supervised pixel classification
approach using a Gaussian filter set and classification
by a k-nearest neighbor classifier).The binary vessel
image is generated from the vessel probability image
using Otsu’s thresholding method. The Otsu
threshold minimizes the intra-class variance for the
foreground (vessel) and background (non-vessel
region) classes. Next, the vessel skeleton is obtained
by applying mathematical morphology reducing the
vessel to a centerline of single pixel width.
Fig. 3. (a) Vessel probability (b) Binary image
2.2 Localization of branch points and crossing
points
The vessel skeletons have to be converted
into vessel segments separated by interruptions at the
branch and crossing points. Their start and end points
are determined by the centerline pixels on the vessel
skeleton is analyzes for its 3x3 neighborhood, and
branch and crossing points are detected as centerline
pixels with more than 2 neighbors. The detection of
Preprocessing
Localization
of branching
and crossover
Structural
separation with
Dijkstra’s graph
search
Identification
of AV
crossing
AV
classification
using graph
cut algorithm
Performance
evaluation
3. K. Sureka et al Int. Journal of Engineering Research and Applications www.ijera.com
ISSN : 2248-9622, Vol. 4, Issue 3( Version 4), March 2014, pp.01-05
www.ijera.com 3 | P a g e
vessel end points is required for the graph search and
it is determined as the centerline pixels with only one
neighbor.
Fig. 4. (a) Vessel network (b) Vessel tree
2.3 Structural separation with Dijkstra’s graph
search
A vessel consists of number of smaller
vessel segments linked together. Three attributes are
orientation, width, and intensity of vessel segments
corresponding to a single vessel, have similar
characteristics within a vessel tree. A vessel subtree
is identified by selecting a group of segments from
the vessel segment map, based on the similarity
between these segments. Three features a)
Orientation is expressed as the angle (in radian) the
segment end region makes with the positive direction
of X-axis, a measurement between [0,π], b) Width (in
pixel) is measured as a median value, and passing
through the skeleton pixels of the end region,
Intensity is measured as a median value of the width
and the intensity measured for each vessel segment
obtained across the vessel tree.
Fig. 5. (a)Vessel segment map (b) Graph structure
To convert the vessel segment map into
connected graph structure, connecting neighboring
vessel segments are identified using the branch and
crossing point information. Dijkstra’s algorithm is
utilized to identify a vessel subtree. It is a shortest
path algorithm to identify the central vein. Similarly,
used Dijkstra’s algorithm to identify vessels one at a
time and evaluated their method on a set of 15
images.
2.4 Identification of artery-venous crossing
I proposed an automated AV separation
algorithm based on structural mapping, which
classifies the vessel trees into arteries and veins,
using vessel color features as well as the anatomic
property of arteries-venous (AV) crossing. This
property proposes that the crossing of two retinal
blood vessels imaged on a two dimensional fundus
image, signifies high probability of one vessel being
an artery and other one being a vein. The vessel
segments are skeletonized to obtain the vessel
centerlines. For the centerline extraction,
significantly large vessel width segments in a vessel
tree are selected to avoid the inclusion of smaller,
peripheral or single pixel width segments and is
determined as the width more than 60% of the
maximum vessel width obtained in that vessel tree.
Fig. 6. (a) Vessel probability map (b) Structural
mapping
A feature vector consisting of four features mean
(MG) and standard deviation (SG) of green channel
and hue channel respectively, from 3x3
neighborhood of each vessel centerline pixel.
Arteries appear brighter (higher green channel
intensity) than veins because oxygenated
hemoglobin is less absorbent than the de-oxygenated
blood between 600-800 nm.
2.5 Artery-venous classification of retinal vessel
The centerline pixels obtained from any two vessel
trees are collected and classified to detect the AV
status of respective vessel trees. Based on feature
vector, the algorithm classifies the centerline pixels
obtained from a pair of vessel trees, into two
clusters/classes.
Fig. 7. (a) Structural mapping (b) Artery-venous
classification
III. RESULTS
To evaluate the accuracy of the proposed
method, the automated labeling was compared with
the expert annotation in terms of a segment color
value. Two metrics were utilized to quantify the
accuracy of the method. The first metric calculates
the mis-classification rate (%) for vessel segments as
a function of vessel segment width, over the dataset.
The mis-classification rates (%) for various vessel
segment sizes were categorized in table. The average
mis-classification rate (%) for vessel width above 4
4. K. Sureka et al Int. Journal of Engineering Research and Applications www.ijera.com
ISSN : 2248-9622, Vol. 4, Issue 3( Version 4), March 2014, pp.01-05
www.ijera.com 4 | P a g e
pixels was 3.58%. The second metric shows the
histogram of pixel mis-classification (%) per image
in the dataset. For each image the mis-classification
(%) was calculated as the fraction of total number of
vessel pixels which was mis-classified, representing
its impact on the vessel network. The average mis-
classification of 8.56% or the accuracy of 91.44%
correctly classified vessel pixels was obtained over
the dataset.
Fig. 8. (a) Fundus image (b) Structural mapping (c) manual AV labeling (d) Automated AV classification
IV. DISCUSSION AND CONCLUSION
I developed an automated method for
identifying and separating the retinal vessel trees in
color fundus images, which provides the mapping of
primary vessels, and their branches. The image with
highest mis-classification of 44.26% was partially
contributed by both false structural mapping and
false AV classification. This approach has the
potential to impact the diagnostically important
morphologic analysis of individual retinal vessels.
Vessel size Vessel width Vessel Segment mis-classification (%)
Small/Peripheral 1≤width<4 4.07
Medium 4≤width≤6 3.78
Major 6<width≤9 0.00
Table 1: Proportion of mis-classified vessel segments
Fig. 9. Quantitative results (a) Proportion of mis-classified vessel segments (b) percentage mis-classification
per image
5. K. Sureka et al Int. Journal of Engineering Research and Applications www.ijera.com
ISSN : 2248-9622, Vol. 4, Issue 3( Version 4), March 2014, pp.01-05
www.ijera.com 5 | P a g e
REFERENCES
[1] Lau Q, Lee M, Hsu W, Wong T (2013)
Simultaneously identifying all true vessels
from segmented retinal images. IEEE
Transactions on Biomedical Engineering
60(7): 1851–58.
[2] Rothaus K, Jiang X, Rhiem P (2009)
Separation of the retinal vascular graph in
arteries and veins based upon structural
knowledge. Image and Vision Computing
27(7): 864–875.
[3] Joshi V, Garvin M, Reinhardt J, Abramoff
M (2011) Identification and reconnection of
interrupted vessels in retinal vessel
segmentation. In: IEEE, ISBI, Image
Segmentation Methods. Volume FR-PS3a.7,
pp. 1416–1420.
[4] Vickerman M, Keith P, Mckay T Vesgen
(2009) 2d: Automated, user-interactive
software for quantification and mapping of
angiogenic and lymphangiogenic trees and
networks. The Anatomical record 292.
[5] Kondermann C, Kondermann D, Yan M
(2007) Blood vessel classification into
arteries and veins in retinal images. In: Med.
Imag. Image Process. Volume 6512, p.
651247651249.
[6] Abramoff M, Niemeijer M, Suttorp-Schulten
M, Viergever M, Russell S, et al.(2008)
Evaluation of a system for automatic
detection of diabetic retinopathy from color
fundus photographs in a large population of
patients with diabetes. Diabetes Care 31:
193–198.
[7] Witt N, Wong T, Hughes (2006)
Abnormalities of retinal microvascular
structure and risk of mortality from ischemic
heart disease and stroke. Hypertension
47(5): 975–981.
[8] Sukkaew L, Makhanov B, Barman S,
Panguthipong S (2008) Automatic
tortuosity-based retinopathy of prematurity
screening system. IEICE transactions on
information and systems 12.
[9] Koreen S, Gelman R, Martinez-Perez M
2007) Evaluation of a computer-based 399
system for plus disease diagnosis in
retinopathy of prematurity. Ophthalmology
114(12): e59–e67.
[10] Y. Yin et al., “A probabilistic based method
for tracking vessels in retinal images,” in
IEEE ICIP, sept. 2010, pp. 4081–4084.
[11] T. Y. Wong et al., “Retinal vascular caliber,
cardiovascular risk factors, and
inflammation: the multi-ethnic study of
atherosclerosis (mesa).” Invest Ophthalmol
Vis Sci, vol. 47, no. 6, pp. 2341–2350, 2006.
[12] H. Li et al., “Automatic grading of retinal
vessel caliber,” IEEE Trans. on Biomed.
Eng., vol. 52, no. 7, pp. 1352–1355, 2005.
[13] J. Cousty et al., “Watershed cuts: Minimum
spanning forests and the drop of water
principle,” IEEE Trans. on Pattern Anal.
And Mach. Intell., vol. 31, no. 8, pp. 1362–
1374, 2009.
doing her ME in Applied Electronics at Jayam
College of Engineering and Technology,
Dharmapuri. Presently she is involving in
developing a automated method for identification
and classification of retinal blood vessels to
identify the diseases in retina. She has published
more than two research papers in national and
international conferences. Her special areas of
interest are Image processing, Control system and
Measurements & Instruments.
Applied Electronics from Jayam College of
Engineering and Technology. He published more
than four research papers in various national and
international conferences/journals. At present he is
working as Assistant Professor in the department of
Electronics and Communication Engineering in
Jayam College of Engineering and Technology,
Dharmapuri. He has participated in various
national level workshops and seminars at various
colleges.
Sureka. K has obtained her BE
degree in Electronics and
Instrumentation Engineering from
Velammal Engineering College,
Chennai in 2011. Currently she is
Engineering and
Vignesh. R has obtained his BE
degree in Electronics and
Communication Engineering from
Jayam College of Engineering and
Technology. He received his ME in