Office property clock
•
0 likes•7,534 views

l'ultimo rapporto di Jones Lang Lasalle sul mercato degli uffici in europa

Recommended
Recommended
More Related Content
Viewers also liked
Similar to Office property clock
Similar to Office property clock (20)
Recently uploaded
Recently uploaded (20)
Office property clock
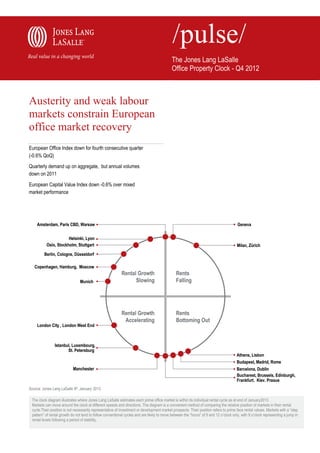
- 1. The Jones Lang LaSalle Office Property Clock - Q4 2012 Austerity and weak labour markets constrain European office market recovery European Office Index down for fourth consecutive quarter (-0.6% QoQ) Quarterly demand up on aggregate, but annual volumes down on 2011 European Capital Value Index down -0.6% over mixed market performance Amsterdam, Paris CBD, Warsaw Geneva Helsinki, Lyon Oslo, Stockholm, Stuttgart Milan, Zürich Berlin, Cologne, Düsseldorf Copenhagen, Hamburg, Moscow Rental Growth Rents Munich Slowing Falling Rental Growth Rents Accelerating Bottoming Out London City , London West End Istanbul, Luxembourg, St. Petersburg Athens, Lisbon Budapest, Madrid, Rome Manchester Barcelona, Dublin Bucharest, Brussels, Edinburgh, Frankfurt, Kiev, Prague Source: Jones Lang LaSalle IP, January 2013 The clock diagram illustrates where Jones Lang LaSalle estimates each prime office market is within its individual rental cycle as at end of January2013. Markets can move around the clock at different speeds and directions. The diagram is a convenient method of comparing the relative position of markets in their rental cycle.Their position is not necessarily representative of investment or development market prospects. Their position refers to prime face rental values. Markets with a “step pattern” of rental growth do not tend to follow conventional cycles and are likely to move between the “hours” of 9 and 12 o’clock only, with 9 o’clock representing a jump in rental levels following a period of stability.
- 2. Pulse • The Jones Lang LaSalle Office Property Clock • Q4 2012 2 volumes in Western Europe stagnated on aggregate (+1%) over the European Office fourth quarter as volumes fell 30% in Paris, Europe’s largest office market. Occupational Markets The still challenging economic environment, particularly in Southern Europe, did however impact annual performance. As expected – and The speed of recovery in the European office market continues to be despite the solid Q4 results – gross take-up for 2012 for Europe as a constrained by the ongoing weakness in economic fundamentals . whole reached only 10.3 million sq. m, down 9% on 2011 volumes. Strict austerity measures in the wake of the Eurozone debt crisis, The slowdown in take-up activity compared to 2011 was most particularly in Southern Europe, continues to limit growth and weigh pronounced in the CEE region (-18%), heavily impacted by the down on European labour markets with unemployment numbers decline in Moscow (- 21%). Warsaw was the only exception in the continuing to edge upwards. There are signs of the crisis easing, region, exceeding 2011 take-up volumes by 5%. Activity in Western following some encouraging policy developments, in particular the Europe was slightly more resilient on average (-7%) with take-up in ECB’s bond-buying plan and the Greek debt agreement at the end of London and Paris remaining almost unchanged (-1% / -3%). last year. However, uncertainty remains evident and translates in However a couple of larger markets, notably the Southern European muted business confidence while economic growth prospects remain markets of Barcelona (-25%), Milan (-22%) and Madrid (- subdued for the year ahead. 21%)showed slowing occupier activity, while some of the German markets witnessed reduced momentum. Prime Office Rents mirror this trend and continued to soften on aggregate. The European Office Index decreased for the fourth Given current conditions, lease events and renegotiations are consecutive quarter, recording a fall of -0.6% over the quarter, expected to dominate trading going forward, as occupiers across the standing now 1.5% lower than a year ago. On a market by market whole region remain focused on cost savings and efficiency gains or level, changes in prime rents did however again nearly cancel each seizing opportunities to upgrade. Occupiers continue to carefully other out. Prime office rental increases in Lyon (+5.6%), Düsseldorf examine options and transactions are taking longer to complete. (+4.0%) and Munich (+1.6%) were off-set by decreases in Moscow (- Take-up volumes for the year ahead are therefore expected to 4.2%), Milan (-3.8%) and Paris (-3.1%) that ultimately pushed the remain at current levels before the anticipated economic and job Index down. Prime rents in all other index markets remained stable. market recovery will translate into more expansionary demand in Nine markets now record prime rents below levels at the end of last 2014. There might be however a couple of occupiers who – if year including crisis-ridden Dublin (-6.3%), Madrid (-5.8%) and Milan confidence levels improve – could be first movers going ahead with (-5.7%) but in Paris too, rents softened (-7.2%). Over the year, eight plans to secure modern space to enable workplace change. Index markets saw prime rents increase led by Düsseldorf (+8.3%), Lyon (+5.6%) and Luxembourg (+5.3%), whereas rents elsewhere Annual net absorption for the region as a whole remained positive including London remained stable. On the Jones Lang LaSalle office (3.4 million sq. m). Absorption levels remained high in CEE driven by clock, polarisation continues as markets continue to move towards Moscow and Warsaw, whereas aggregate results in Western Europe 12 o’clock and 6 o’clock. London however is the first market, that has were boosted by the German markets together with healthy demand returned to the “rental growth accelerating quadrant” based on in Lyon, Luxembourg and Stockholm. However ,levels in Paris renewed rental growth in the City and strong rental growth forecasts. continue to decline and remain particularly low in London. Going Other markets could follow, though this could take some time: For forward, net absorption is expected to increase gradually throughout 2013, prime rents on aggregate are forecast to show only moderate the year to around 10-15% above 2012 by the end of 2013. growth if any. Growth in relatively healthy economies such as Germany or the Nordics is expected to lose further momentum Overall vacancy for the region continues to decline, albeit very leaving rents in markets in the centre of the Eurozone debt crisis slowly. The European vacancy rate dropped by -10bps over the subject to further rental decline. quarter (-30 bps y-on-y) to 9.6%. Changes in vacancy levels remain gradual, though Frankfurt (-120bps), Stockholm (-110bps) and On the demand side, as in previous years, the fourth quarter was the Madrid (+70bps) proved exceptions showing strong q-on-q changes. strongest quarter for office take-up of the year. Take-up in Q4 2012 Vacancy rates in Paris and London remained static (+10 bps / -10 reached 2.9 million sq. m, an increase of 11% over the third quarter. bps) and increased slightly in Moscow (+20 bps). Looking back, 13 On a regional level, gross take-up over the quarter was particular of the 24 Index markets now record vacancy rates below their Q4 strong in Central and Eastern Europe (+49%), driven by a buoyant 2011 levels, led by Frankfurt (-200 bps). Modern office space in good Moscow market where take-up nearly doubled (+93%), while Prague locations is in demand and is quickly absorbed, but vacancy levels also saw volumes up 32%. In contrast, and despite three quarters of remain impacted by further releases of second hand space onto the the Western European Index markets showing improvements over market. Going forward, vacancy rates for the region overall are Q3 led by Amsterdam (+112%), Dublin (+90%) and Brussels (+84%), forecast to remain at current levels with a slight upward tendency.
- 3. Pulse • The Jones Lang LaSalle Office Property Clock • Q4 2012 3 Current vacancy rates and robust absorption levels remain 2013 is expected to increase by 30% on 2012 volumes fuelled by supported by ( in some markets historically) low levels of construction activity in Moscow, London and Paris. Overall, much of completions as debt for speculative development remains tight. the new supply is already pre-let, but as occupiers are mostly looking Volumes for 2012 grew only 7% compared to 2011 and remain more for like-for-like changes in terms of total space requirements, than 30% below the long term average. However, completions of vacancy levels are expected to edge up slightly when second hand new space continue to increase quickly with volumes in Q4 2012 space is released back into the markets. Nevertheless, occupiers increasing by 50% over the quarter. Given the subdued economic increasingly also seek transformational potential to drive productivity. outlook for 2013, completion numbers are expected to decrease due Hence, vacancy rates for modern, flexible office space are expected to inevitable cancellations or postponements. Yet, future supply in to remain low. Prime European Office Rental Index 425 % Change Q4 2012 400 YoY QoQ -1.5 -0.6 375 350 325 300 275 2002 2003 2004 2005 2006 2007 2008 2009 2010 2011 2012 Weighted Nominal Rental Trend, 1980 = 100 Source: Jones Lang LaSalle Annual Office Net-Absorption 8,500 sq m ('000) 7,500 6,500 5,500 4,500 3,500 2,500 1,500 500 -500 Q4 2005 Q4 2006 Q4 2007 Q4 2008 Q4 2009 Q4 2010 Q4 2011 Q4 2012 Western Europe CEE Total Source: Jones Lang LaSalle
- 4. Pulse • The Jones Lang LaSalle Office Property Clock • Q4 2012 4 Prime Office Rents Q4 2012 (EUR / sqm pa) Prime Office Rents and Rental Change Q4 2012 EUR / sqm pa % Q-o-Q % Y-o-Y 0 200 400 600 800 1,000 1,200 Europe -0.6 ▼ -1.5 ▼ Amsterdam 335 0.0 ► 0.0 ► London West End Athens 204 -4.7 ▼ -20.0 ▼ Moscow Barcelona 216 0.0 ► -2.7 ▼ Geneva Berlin 264 0.0 ► 2.3 ▲ Zurich Brussels 285 0.0 ► -5.0 ▼ Paris CBD Bucharest 222 0.0 ▼ -5.1 ▼ London City Budapest 240 0.0 ► 0.0 ► Oslo Cologne 264 0.0 ► 2.3 ▲ Stockholm Copenhagen 241 0.0 ► 0.0 ► Milan Dublin 323 0.0 ► -6.3 ▼ Luxembourg Dusseldorf 312 4.0 ► 8.3 ▲ Istanbul Edinburgh 358 0.0 ► 0.0 ► St. Petersburg Frankfurt/M 396 0.0 ► 0.0 ► Rome Geneva 849 -2.4 ▼ -2.4 ▼ Manchester Hamburg 288 0.0 ► 2.1 ▲ Frankfurt/M Helsinki 300 0.0 ► 0.0 ► Munich Istanbul 420 16.7 ▲ 16.7 ▲ Edinburgh Kiev 319 0.0 ► 0.0 ► Amsterdam Lisbon 222 0.0 ► 0.0 ► Dublin London City 756 3.6 ▲ 3.6 ▲ Kiev London West End 1,261 0.0 ► 0.0 ► Dusseldorf Luxembourg 480 0.0 ► 5.3 ▲ Warsaw Lyon 285 5.6 ▲ 5.6 ▲ Helsinki Madrid 291 0.0 ► -5.8 ▼ Madrid Manchester 398 0.0 ► 0.0 ► Hamburg Milan 500 -3.8 ▼ -5.7 ▼ Lyon Moscow 872 -4.2 ▼ -4.2 ▼ Brussels Munich 372 1.6 ▲ 3.3 ▲ Cologne Oslo 545 0.0 ► 5.3 ▲ Berlin Paris CBD 770 -3.1 ▼ 1.3 ▲ Prague Prague 252 0.0 ► 0.0 ► Copenhagen Rome 400 0.0 ► -4.8 ▼ Budapest St. Petersburg 417 0.0 ► 0.0 ► Stuttgart Stockholm 513 0.0 ► 4.8 ▲ Lisbon Stuttgart 222 0.0 ► 2.8 ▲ Bucharest Warsaw 300 0.0 ► 0.0 ► Barcelona Zurich 812 -6.7 ▼ -10.9 ▼ Athens Note: Q-o-Q and Y-o-Y rental change is based on the local currency. Source: Jones Lang LaSalle Source: Jones Lang LaSalle
- 5. Pulse • The Jones Lang LaSalle Office Property Clock • Q4 2012 5 Selective yield compression and rental growth over the quarter European Office Capital could however not offset the yield compression and rental declines in other parts. Overall, the European Capital Values Index Values decreased over the quarter by -0.6%, but remained stable (+0.1%) in comparison to the level a year ago. Out of the 24 Index markets, European investment volume numbers showed a strong finish to the eight markets saw capital values fall. In Milan, Paris and Moscow year, resulting in full year volumes exceeding expectations. Volumes falls were based on prime rental decreases, whereas in Amsterdam, for the region across all sectors reached EUR 46.4 bn, an increase The Hague, Utrecht, Barcelona and Madrid, capital values of 76% over the quarter. Offices accounted for 50% of total volumes, decreases as a result of outward moving yields. Six markets totalling EUR 23.1 bn, an increase of 73% over the quarter. Office recorded capital value increases over the quarter based on prime investment activity in the last quarter of 2012 was particularly strong rental increases (Düsseldorf, Lyon and Munich) whereas capital in France and Germany (+134% / +98%) supported by a couple of values increased in Berlin and Dublin as a result of yield large scale transactions, whereas the UK maintained its strong compression. Whereas in Rotterdam rental increases compensated momentum (+11%). Overall, the UK, Germany and France for slight outward yield shifts. Compared to a year ago, accounted for two thirds of the overall regional volumes, based on performance across the region remains mixed. 11 out of the 24 investors preference for core product in the highly liquid markets Index markets recorded capital value decreases compared to only such as London, Paris and German centres. For 2012 as a whole, seven markets that saw capital value gains. investment volumes showed a slight increase (+3%) over 2011 and reached EUR 123 bn of which offices accounted for more than half Prime rents have been the main driver for capital value increases. (53%), an increase of 24% compared to 2011 results. However, This is expected to continue, as yields for the majority of markets despite the increased volumes in Q4 2012, the challenging debt are now forecast to show stability. There remains however the risk market conditions continue to place constraints on activity. Little of upward pressure for markets at the centre of the European debt change is anticipated for 2013 but the postponement of Basel III crisis. could have a positive effect here allowing banks more flexibility. The market remains dominated by investors seeking core, low risk Prime European Office Capital Value Clock Q4 2012* assets and consequently the three major markets (UK, Germany Amsterdam and France), were most active in Q4 2012. Paris CBD The weighted European office yield decompressed by just 1bps over Stockholm Berlin the quarter to stand at 5.23%, based on mixed performance at an individual market level. Yields moved outwards in the Dutch markets Milan as well as in Spain mirroring the soft economic and investment Capital Value Capital Value Growth Slowing Falling market conditions. Yields compressed however in Munich and Moscow Dusseldorf (-10 bps and -15 bps respectively) as a result of strong investor demand as well as in Dublin (-25bps), which showed initial London signs of increased investor attention despite relatively weak Capital Value Capital Value Growth Bottoming occupier market conditions for the time being. Over the year Frankfurt Accelerating Out however, yield levels remained rather static: Only seven out of the 24 Index markets show prime yields below Q4 2011 levels led by Munich (-35bps), whereas in the majority of markets yields remained stable. Six markets recorded outward movement over the year, led *selected markets Madrid by crisis-ridden Barcelona (+75bps) and Madrid (+50bps). Brussels Weighted European Prime Office Yield % 6.50 6.00 5.50 5.00 4.50 4.00 2002 2003 2004 2005 2006 2007 2008 2009 2010 2011 2012 Source: Jones Lang LaSalle
- 6. Pulse • The Jones Lang LaSalle Office Property Clock • Q4 2012 6 Prime European Office Capital Values Index Q4 2012 Prime Office Capital Value Drivers: 12 months to Q4 2012 650 % % Change Q4 12 600 YoY QoQ 20 0.1 -0.6 15 550 10 500 5 0 450 -5 400 -10 350 -15 Rotterdam Munich Amsterdam Hamburg Lyon Frankfurt/M Milan Stockholm Berlin London Prague Dublin Madrid Edinburgh The Hague Barcelona Luxembourg Utrecht Dusseldorf Budapest Paris CBD Warsaw Moscow Brussels 300 2002 2003 2004 2005 2006 2007 2008 2009 2010 2011 2012 Rents Yields CV Weighted Nominal Capital Value Trend, 1980=100 Source: Jones Lang LaSalle Source: Jones Lang LaSalle 1 Prime Office Capital Values Q4 2012 (EUR / sqm) Prime Office Capital Values and Capital Value Change Q4 2012 EUR / sqm % Q-o-Q % Y-o-Y 0 5,000 10,000 15,000 20,000 25,000 30,000 Europe -0.6 ▼ 0.1 ▲ Amsterdam 5,982 -0.9 ► -0.9 ▼ London Barcelona 3,200 -3.7 ▼ -13.5 ▼ Paris CBD Berlin 5,500 3.1 ► 5.5 ▲ Stockholm Brussels 4,750 0.0 ► -5.0 ▼ Milan Budapest 3,200 0.0 ► 0.0 ► Moscow Dublin 4,452 3.4 ► -3.0 ▼ Munich Dusseldorf 6,638 4.0 ► 14.1 ▲ Luxembour Edinburgh 5,733 0.0 ► -4.0 ▼ Frankfurt/M Frankfurt/M 8,250 0.0 ► 0.0 ► Dusseldorf Hamburg 6,194 0.0 ► 6.5 ▲ Hamburg London 31,520 0.0 ► 0.0 ► Amsterdam Luxembourg 8,348 0.0 ► 5.3 ▲ Edinburgh Lyon 4,750 5.6 ► 5.6 ▲ Madrid 4,477 -3.8 ▼ -13.1 ▼ Berlin Milan 10,000 -3.8 ▼ -5.7 ▼ Warsaw Moscow 9,692 -4.2 ► -4.2 ▼ Lyon Munich 8,455 3.9 ▲ 11.6 ▲ Brussels Paris CBD 17,111 -3.1 ▲ 6.9 ▲ Madrid Prague 3,877 0.0 ► 0.0 ► Dublin Rotterdam 3,565 0.7 ► 0.7 ▲ Prague Stockholm 11,400 0.0 ▲ 10.6 ▲ Rotterdam The Hague 3,475 -1.7 ▼ -6.5 ▼ Utrecht Utrecht 3,554 -1.7 ▼ -6.3 ▼ The Hague Warsaw 4,800 0.0 ► 0.0 ► Budapest Q-o-Q and Y-o-Y rental change is based on the local currency. Barcelona Source: Jones Lang LaSalle Source: Jones Lang LaSalle
- 7. Pulse • The Jones Lang LaSalle Office Property Clock • Q4 2012 7 Definitions Prime Rent Represents the top open-market rent that could be expected for a notional office unit of the highest quality and specification in the best location in a market, as at the survey date. The rent quoted normally reflects prime units of over 500 m² of lettablefloorspace, which excludes rents that represent a premium level paid for a small quantity of space. The Prime Rent reflects an occupational lease that is standard for the local market. It is a face rent that does not reflect the financial impact of tenant incentives, and excludes service charges and local taxes. The Prime Rent represents Jones Lang LaSalle’s market view and is based on an analysis/review of actual transactions for prime office space, excluding any unrepresentative deals. Where an insufficient number of deals have been made for prime office space, an assessment of rental value is provided by reference to transactions generally in that market adjusted accordingly to equate to prime. Prime Yield Represents the best (i.e. lowest) “rack-rented” yield estimated to be achievable for a notional office property of the highest quality and specification in the best location in a market, as at the survey date. The property should be let at the prevailing market rent to a first class tenant with an occupational lease that is standard for the local market. The prime initial net yield is quoted, i.e., the initial net income at the date of purchase, expressed as a percentage of the total purchase price, which includes acquisition costs and transfer taxes. The Prime Office Yield represents Jones Lang LaSalle’s “market view”, based on a combination of market evidence where available and a survey of expert opinion. Prime Capital Value Represents the top open-market capital value (per square metre) that could be expected for a notional office property of the highest quality and specification in the best location, as at the survey date. Prime capital values are derived from prime office rents and prime office yields (net initial): Capital Value = (Prime Annual Rent / Prime Yield) * 100. This method will provide notional gross capital values, i.e. purchase price including acquisition costs and transfer taxes. Annual Net-Absorption Represents the change in the occupied stock within a market during one year. Net Absorption is calculated on the basis of “top-down” estimates of occupied stock derived by subtracting vacant office stock from the total office stock of that market. Mothballed stock, i.e. floorspace held vacant and not being offered for letting, usually pending redevelopment or refurbishment, is excluded.
- 8. Oliver Kummerfeldt Dr Lee Elliott Senior Analyst Director EMEA Research Head of EMEA Research London London +44 20 3147 1170 +44 20 3147 1206 oliver.kummerfeldt@eu.jll.com lee.elliott@eu.jll.com The Jones Lang LaSalle Office Property Clocks – Q4 2012 Pulsereports from Jones Lang LaSalle arefrequent updates on real estate market dynamics. www.joneslanglasalle.eu COPYRIGHT © JONES LANG LASALLE IP, INC. 2013. All rights reserved. No part of this publication may be reproduced or transmitted in any form or by any means without prior written consent of Jones Lang LaSalle. It is based on material that we believe to be reliable. Whilst every effort has been made to ensure its accuracy, we cannot offer any warranty that it contains no factual errors. We would like to be told of any such errors in order to correct them.