SlideShare ist ein Scribd-Unternehmen logo
1 von 3
Downloaden Sie, um offline zu lesen
144/2013 - 10 October 2013

Second quarter 2013 compared with second quarter 2012

Euro area house prices down by 2.2%
EU down by 1.3%
1

2

3

House prices, as measured by the House Price Index (HPI), fell by 2.2% in the euro area and by 1.3% in the EU
in the second quarter of 2013 compared with the same quarter of the previous year, according to data published by
Eurostat, the statistical office of the European Union.

Compared with the first quarter of 2013, house prices rose by 0.3% in the euro area and by 0.4% in the EU in the
second quarter of 2013.

House price indices - euro area and EU
2010 = 100
105

100

95

90

85

Source: Eurostat

Q2

2013 Q1

Q4

Q3

Q2

2012 Q1

Q4

Q3

Q2

Q4

2011 Q1

Q3

Q2

Q4

2010 Q1

EU

Q3

Q2

Q4

2009 Q1

Q3

Q2

2008 Q1

Q4

Q3

Q2

2007 Q1

Q4

Q3

Q2

2006 Q1

Q4

Q3

Q2

80

2005 Q1

Euro area
House price developments in the EU Member States
Among the EU Member States for which data are available, the highest annual increases in house prices in the
second quarter of 2013 were recorded in Latvia (+8.8%), Estonia (+8.1%) and Luxembourg (+5.1%), and the
largest falls in Croatia (-19.7%), Spain (-10.6%) and the Netherlands (-7.5%).
The highest quarterly increases in the second quarter of 2013 were recorded in Latvia (+5.1%), Estonia (+3.7%)
and Denmark (+3.1%), and the largest falls in Croatia (-6.5%), the Netherlands (-2.0%) and Hungary (-0.9%).

Quarterly and annual house price developments
Percentage change compared with the
previous quarter
2012
Q3

Percentage change compared with the
same quarter of the previous year

2013
Q4

Q1

2012
Q2

Q3

2013
Q4

Q1

Q2

Belgium

1.1

-0.8

0.0

0.0

1.8

1.1

0.4

0.4

Germany

1.4

1.4

:

:

4.3

5.0

:

:

Estonia

2.5

-1.4

3.1

3.7

8.3

5.8

7.7

8.1

-9.6

-4.5

-3.0

1.2

Ireland

1.5

0.0

-2.6

2.3

Greece

:

:

:

:

:

:

:

:

Spain

-3.7

-1.4

-5.1

-0.8

-16.1

-12.8

-12.8

-10.6

France

0.6

-1.4

-1.0

0.7

-1.6

-2.0

-1.8

-1.1

Italy

-1.7

-2.2

-1.5

-0.6

-3.7

-5.2

-6.1

-5.9

Cyprus

-1.3

0.5

-4.8

:

-0.1

5.4

-0.4

:

0.3

2.9

-0.9

2.8

4.4

3.8

4.3

5.1

0.3

2.1

0.3

1.2

0.7

5.4

3.9

3.9

-3.8

0.8

-2.7

-2.0

-8.9

-6.4

-7.0

-7.5

p

Luxembourg*
Malta
Netherlands
Austria

:

:

:

:

:

:

:

:

-0.9

-1.1

-3.2

0.9

-7.7

-6.0

-7.3

-4.3

Slovenia

-2.6

-3.5

0.7

0.8

-6.0

-8.8

-4.3

-4.6

Slovakia

0.7

-2.0

2.3

0.3

-2.3

-2.9

0.0

1.2

Finland

0.2

0.0

0.7

0.5

2.1

3.1

2.1

1.4

-0.5

-0.6

-1.4

0.3

-2.5

-1.9

-2.4

-2.2

-0.1

-1.7

-0.9

0.5

-1.0

-1.3

-2.2

-2.2

-0.2

-0.1

-0.7

0.3

-1.6

-0.7

-1.0

-0.8

0.3

-0.5

0.5

3.1

-1.8

1.3

1.8

3.5

Croatia

-4.1

-2.9

-7.7

-6.5

-0.2

-4.4

-15.3

-19.7

Latvia

2.1

1.2

0.1

5.1

0.1

7.4

5.0

8.8

Portugal

p

Euro area
Bulgaria

p

p

Czech Republic
Denmark

Lithuania

-0.5

0.7

0.7

1.5

-1.2

-1.2

-0.1

2.4

Hungary

-0.8

-2.0

-0.9

-0.9

-3.8

-5.3

-6.9

-4.5

c

c

c

c

c

c

c

c

Romania

-4.2

-0.1

4.3

-0.8

-5.6

-1.3

-0.8

-1.0

Sweden

0.7

0.5

1.7

1.6

0.8

3.8

4.1

4.6

United Kingdom

Poland

1.8

-0.7

-0.1

1.8

1.9

2.3

2.2

2.9

p

-0.2

-0.6

-0.9

0.4

-1.9

-1.2

-1.5

-1.3

Iceland

1.3

0.1

0.7

2.7

6.7

4.7

4.2

4.9

Norway**

1.3

-0.4

2.9

2.0

8.4

8.3

7.7

5.8

EU

* only flats
** only existing dwellings
: data not available
p provisional
c confidential
Source: Eurostat
1. The House Price Indices (HPIs) describe the price developments of all residential properties purchased by households (flats,
detached houses, terraced houses, etc.), both newly built and existing, independently of their final use and independently of
their previous owners. The Member States’ HPIs are compiled by the National Statistical Institutes. The euro area and the
EU aggregate HPIs are compiled by Eurostat. HPIs are computed as annual chain indices allowing weights to be changed
each year. The European HPI aggregates are currently calculated as weighted averages of the national HPIs using as
weights the GDP at market prices (based on millions PPS) of the countries concerned.
Missing country data is estimated by Eurostat using data from non-harmonised sources. These estimates are not published
but are used to calculate euro area and EU aggregates.
The Member States’ HPIs are compiled following a harmonised methodology. The methodology is summarised in the
Handbook on Residential Property Price Indices, just published in the full 2013 edition on the homepage of Eurostat and in
the Housing Price Statistics dedicated page:
http://epp.eurostat.ec.europa.eu/portal/page/portal/hicp/methodology/hps/rppi_handbook
and in a Methodological Manual:
http://epp.eurostat.ec.europa.eu/portal/page/portal/hicp/methodology/hps/owner_occupied_housing
This quarterly News Release is complemented by a Statistics Explained article on the Eurostat website:
http://epp.eurostat.ec.europa.eu/statistics_explained/index.php/Housing_price_statistics_-_house_price_index
2. The euro area initially included Belgium, Germany, Ireland, Spain, France, Italy, Luxembourg, the Netherlands, Austria,
Portugal and Finland. Greece was included from 1 January 2001, Slovenia from 1 January 2007, Cyprus and Malta from 1
January 2008, Slovakia from 1 January 2009 and Estonia from 1 January 2011.
3. The EU included 15 Member States until April 2004, 25 Member States from May 2004 until December 2006 and 27
Member States from January 2007. Croatia joined the EU on 1 July 2013 and will be included in the calculation of the
EU HPI aggregate with the index for the third quarter of 2013.

Issued by: Eurostat Press Office

For further information on data and methodology:

Tim ALLEN
Tel: +352-4301-33 444
eurostat-pressoffice@ec.europa.eu

Bogdan MAROLA
Tel: +352-4301-34 955
estat-real-estate@ec.europa.eu

Eurostat News Releases on the internet: http://ec.europa.eu/eurostat
Selected Principal European Economic Indicators: http://ec.europa.eu/eurostat/euroindicators

Weitere ähnliche Inhalte

Ähnlich wie Eurostat 2q 2013

Показники інфляції в Євросоюзі та зоні євро в січні 2017 року
Показники інфляції в Євросоюзі та зоні євро в січні 2017 рокуПоказники інфляції в Євросоюзі та зоні євро в січні 2017 року
Показники інфляції в Євросоюзі та зоні євро в січні 2017 рокуtsnua
 
Eurostatinflation2 17042019-ap-en
Eurostatinflation2 17042019-ap-enEurostatinflation2 17042019-ap-en
Eurostatinflation2 17042019-ap-enPaperjam_redaction
 
Industrial production down by 0.8% in euro area
Industrial production down by 0.8% in euro areaIndustrial production down by 0.8% in euro area
Industrial production down by 0.8% in euro areaGiuseppe Fumagalli
 
Volume of retail trade down by 0.2% in both euro area and EU28
Volume of retail trade down by 0.2% in both euro area and EU28Volume of retail trade down by 0.2% in both euro area and EU28
Volume of retail trade down by 0.2% in both euro area and EU28Giuseppe Fumagalli
 
051.812.955.17 folder to Tax Return
051.812.955.17 folder to Tax Return051.812.955.17 folder to Tax Return
051.812.955.17 folder to Tax ReturnSandro Suzart
 
Production in construction down by 0.9% in euro area
Production in construction down by 0.9% in euro areaProduction in construction down by 0.9% in euro area
Production in construction down by 0.9% in euro areaGiuseppe Fumagalli
 
Eurostat book smarter, greener, more inclusive indicators to support the eur...
Eurostat book  smarter, greener, more inclusive indicators to support the eur...Eurostat book  smarter, greener, more inclusive indicators to support the eur...
Eurostat book smarter, greener, more inclusive indicators to support the eur...Mario Verissimo
 
Key Figures on Europe: Eurostat Pocketbook 2013
Key Figures on Europe: Eurostat Pocketbook 2013Key Figures on Europe: Eurostat Pocketbook 2013
Key Figures on Europe: Eurostat Pocketbook 2013Miqui Mel
 
Eurostat renewable energy in the eu28
Eurostat renewable energy in the eu28Eurostat renewable energy in the eu28
Eurostat renewable energy in the eu28GeminiWindpark
 
FoodDrinkEurope _ Boletín económico 1Q 2013
FoodDrinkEurope _ Boletín económico 1Q 2013 FoodDrinkEurope _ Boletín económico 1Q 2013
FoodDrinkEurope _ Boletín económico 1Q 2013 FIAB
 
10 Slides on the World Economy in February 2014
10 Slides on the World Economy in February 201410 Slides on the World Economy in February 2014
10 Slides on the World Economy in February 2014Hannah Thomas
 
Desempleo Regional - Eurostat
Desempleo Regional - EurostatDesempleo Regional - Eurostat
Desempleo Regional - EurostatPepeCarles
 
2 28112018-ap-en
2 28112018-ap-en2 28112018-ap-en
2 28112018-ap-enLaLibre
 
The tax-to-GDP ratio in 2015 in Eu
The tax-to-GDP ratio in 2015 in EuThe tax-to-GDP ratio in 2015 in Eu
The tax-to-GDP ratio in 2015 in EuGiuseppe Fumagalli
 
Salarios mínimos nacionales en la ue 2017
Salarios mínimos nacionales en la ue 2017Salarios mínimos nacionales en la ue 2017
Salarios mínimos nacionales en la ue 2017angel ayach massa
 
EMEA Economic Insight October 2010
EMEA Economic Insight October 2010EMEA Economic Insight October 2010
EMEA Economic Insight October 2010Manpower EMEA
 
EMEA Economic Insight November 2010
EMEA Economic Insight November 2010EMEA Economic Insight November 2010
EMEA Economic Insight November 2010Manpower EMEA
 
44650180 euro-start
44650180 euro-start44650180 euro-start
44650180 euro-startMirzam86
 

Ähnlich wie Eurostat 2q 2013 (20)

Показники інфляції в Євросоюзі та зоні євро в січні 2017 року
Показники інфляції в Євросоюзі та зоні євро в січні 2017 рокуПоказники інфляції в Євросоюзі та зоні євро в січні 2017 року
Показники інфляції в Євросоюзі та зоні євро в січні 2017 року
 
Eurostatinflation2 17042019-ap-en
Eurostatinflation2 17042019-ap-enEurostatinflation2 17042019-ap-en
Eurostatinflation2 17042019-ap-en
 
Eurostat Estimate of Q1 GDP for Eurozone
Eurostat Estimate of Q1 GDP for EurozoneEurostat Estimate of Q1 GDP for Eurozone
Eurostat Estimate of Q1 GDP for Eurozone
 
Industrial production down by 0.8% in euro area
Industrial production down by 0.8% in euro areaIndustrial production down by 0.8% in euro area
Industrial production down by 0.8% in euro area
 
Volume of retail trade down by 0.2% in both euro area and EU28
Volume of retail trade down by 0.2% in both euro area and EU28Volume of retail trade down by 0.2% in both euro area and EU28
Volume of retail trade down by 0.2% in both euro area and EU28
 
051.812.955.17 folder to Tax Return
051.812.955.17 folder to Tax Return051.812.955.17 folder to Tax Return
051.812.955.17 folder to Tax Return
 
Production in construction down by 0.9% in euro area
Production in construction down by 0.9% in euro areaProduction in construction down by 0.9% in euro area
Production in construction down by 0.9% in euro area
 
Eurostat book smarter, greener, more inclusive indicators to support the eur...
Eurostat book  smarter, greener, more inclusive indicators to support the eur...Eurostat book  smarter, greener, more inclusive indicators to support the eur...
Eurostat book smarter, greener, more inclusive indicators to support the eur...
 
Key Figures on Europe: Eurostat Pocketbook 2013
Key Figures on Europe: Eurostat Pocketbook 2013Key Figures on Europe: Eurostat Pocketbook 2013
Key Figures on Europe: Eurostat Pocketbook 2013
 
Eurostat renewable energy in the eu28
Eurostat renewable energy in the eu28Eurostat renewable energy in the eu28
Eurostat renewable energy in the eu28
 
FoodDrinkEurope _ Boletín económico 1Q 2013
FoodDrinkEurope _ Boletín económico 1Q 2013 FoodDrinkEurope _ Boletín económico 1Q 2013
FoodDrinkEurope _ Boletín económico 1Q 2013
 
10 Slides on the World Economy in February 2014
10 Slides on the World Economy in February 201410 Slides on the World Economy in February 2014
10 Slides on the World Economy in February 2014
 
Desempleo Regional - Eurostat
Desempleo Regional - EurostatDesempleo Regional - Eurostat
Desempleo Regional - Eurostat
 
2 28112018-ap-en
2 28112018-ap-en2 28112018-ap-en
2 28112018-ap-en
 
The tax-to-GDP ratio in 2015 in Eu
The tax-to-GDP ratio in 2015 in EuThe tax-to-GDP ratio in 2015 in Eu
The tax-to-GDP ratio in 2015 in Eu
 
Salarios mínimos nacionales en la ue 2017
Salarios mínimos nacionales en la ue 2017Salarios mínimos nacionales en la ue 2017
Salarios mínimos nacionales en la ue 2017
 
EMEA Economic Insight October 2010
EMEA Economic Insight October 2010EMEA Economic Insight October 2010
EMEA Economic Insight October 2010
 
Property index 2016 raport Deloitte
Property index 2016   raport Deloitte Property index 2016   raport Deloitte
Property index 2016 raport Deloitte
 
EMEA Economic Insight November 2010
EMEA Economic Insight November 2010EMEA Economic Insight November 2010
EMEA Economic Insight November 2010
 
44650180 euro-start
44650180 euro-start44650180 euro-start
44650180 euro-start
 

Kürzlich hochgeladen

Explore Dual Citizenship in Africa | Citizenship Benefits & Requirements
Explore Dual Citizenship in Africa | Citizenship Benefits & RequirementsExplore Dual Citizenship in Africa | Citizenship Benefits & Requirements
Explore Dual Citizenship in Africa | Citizenship Benefits & Requirementsmarketingkingdomofku
 
Call Girls in Maurice Nagar (Delhi) ꧁8447779280꧂ Female Escorts Service in De...
Call Girls in Maurice Nagar (Delhi) ꧁8447779280꧂ Female Escorts Service in De...Call Girls in Maurice Nagar (Delhi) ꧁8447779280꧂ Female Escorts Service in De...
Call Girls in Maurice Nagar (Delhi) ꧁8447779280꧂ Female Escorts Service in De...asmaqueen5
 
Best Interior Design Services in Haldwani
Best Interior Design Services in HaldwaniBest Interior Design Services in Haldwani
Best Interior Design Services in HaldwaniGeomatrix
 
construction material procurement in India
construction material procurement in Indiaconstruction material procurement in India
construction material procurement in Indiarohanindosup
 
Top tourism places in Dubai - Inch & Brick Realty
Top tourism places in Dubai - Inch & Brick RealtyTop tourism places in Dubai - Inch & Brick Realty
Top tourism places in Dubai - Inch & Brick Realtypunitranainchbrick02
 
Low Rate Call girls in Sant Nagar{Delhi }8447779280} Service Escorts In South...
Low Rate Call girls in Sant Nagar{Delhi }8447779280} Service Escorts In South...Low Rate Call girls in Sant Nagar{Delhi }8447779280} Service Escorts In South...
Low Rate Call girls in Sant Nagar{Delhi }8447779280} Service Escorts In South...asmaqueen5
 
The Gale at Godrej Park World Hinjewadi Pune Brochure.pdf
The Gale at Godrej Park World Hinjewadi Pune Brochure.pdfThe Gale at Godrej Park World Hinjewadi Pune Brochure.pdf
The Gale at Godrej Park World Hinjewadi Pune Brochure.pdfPrachiRudram
 
Low Density Living New Project in BPTP THE AMAARIO Sector 37D Gurgaon Haryana...
Low Density Living New Project in BPTP THE AMAARIO Sector 37D Gurgaon Haryana...Low Density Living New Project in BPTP THE AMAARIO Sector 37D Gurgaon Haryana...
Low Density Living New Project in BPTP THE AMAARIO Sector 37D Gurgaon Haryana...ApartmentWala1
 
BPTP THE AMAARIO For The Royals Of Tomorrow in Sector 37D Gurgaon Dwarka Expr...
BPTP THE AMAARIO For The Royals Of Tomorrow in Sector 37D Gurgaon Dwarka Expr...BPTP THE AMAARIO For The Royals Of Tomorrow in Sector 37D Gurgaon Dwarka Expr...
BPTP THE AMAARIO For The Royals Of Tomorrow in Sector 37D Gurgaon Dwarka Expr...ApartmentWala1
 
Kalpataru Exquisite Wakad Pune E-Brochure.pdf
Kalpataru Exquisite Wakad Pune  E-Brochure.pdfKalpataru Exquisite Wakad Pune  E-Brochure.pdf
Kalpataru Exquisite Wakad Pune E-Brochure.pdfManishSaxena95
 
Yedi Mavi TOBB Zeytinburnu - Listing Turkey
Yedi Mavi TOBB Zeytinburnu - Listing TurkeyYedi Mavi TOBB Zeytinburnu - Listing Turkey
Yedi Mavi TOBB Zeytinburnu - Listing TurkeyListing Turkey
 
Cheap Rate ✨➥9582086666▻✨Call Girls In Gurgaon Sector 1 (Gurgaon)
Cheap Rate ✨➥9582086666▻✨Call Girls In Gurgaon Sector 1 (Gurgaon)Cheap Rate ✨➥9582086666▻✨Call Girls In Gurgaon Sector 1 (Gurgaon)
Cheap Rate ✨➥9582086666▻✨Call Girls In Gurgaon Sector 1 (Gurgaon)delhi24hrs1
 
Rohan Harita Tathawade Pune Brochure.pdf
Rohan Harita Tathawade Pune Brochure.pdfRohan Harita Tathawade Pune Brochure.pdf
Rohan Harita Tathawade Pune Brochure.pdfabbu831446
 
Ganga Platinum Kharadi Pune brochure.pdf
Ganga Platinum Kharadi Pune brochure.pdfGanga Platinum Kharadi Pune brochure.pdf
Ganga Platinum Kharadi Pune brochure.pdfsabhyara24
 
Kohinoor Courtyard One Wakad Pune | Elegant Living Spaces
Kohinoor Courtyard One Wakad Pune | Elegant Living SpacesKohinoor Courtyard One Wakad Pune | Elegant Living Spaces
Kohinoor Courtyard One Wakad Pune | Elegant Living Spacesaidasheikh47
 
Nyati Elite NIBM Road Pune E Brochure.pdf
Nyati Elite NIBM Road Pune E Brochure.pdfNyati Elite NIBM Road Pune E Brochure.pdf
Nyati Elite NIBM Road Pune E Brochure.pdfabbu831446
 
SVN Live 5.6.24 Weekly Property Broadcast
SVN Live 5.6.24 Weekly Property BroadcastSVN Live 5.6.24 Weekly Property Broadcast
SVN Live 5.6.24 Weekly Property BroadcastSVN International Corp.
 
Vanam At Purva Soukhyam Guduvanchery.pdf.pdf
Vanam At Purva Soukhyam Guduvanchery.pdf.pdfVanam At Purva Soukhyam Guduvanchery.pdf.pdf
Vanam At Purva Soukhyam Guduvanchery.pdf.pdfkratirudram
 
Eldeco Dwarka Project In Delhi-brochure.pdf.pdf
Eldeco Dwarka Project In Delhi-brochure.pdf.pdfEldeco Dwarka Project In Delhi-brochure.pdf.pdf
Eldeco Dwarka Project In Delhi-brochure.pdf.pdfkratirudram
 
Madhugiri Boucher Managed Farmland (knx)
Madhugiri Boucher Managed Farmland (knx)Madhugiri Boucher Managed Farmland (knx)
Madhugiri Boucher Managed Farmland (knx)knoxdigital1
 

Kürzlich hochgeladen (20)

Explore Dual Citizenship in Africa | Citizenship Benefits & Requirements
Explore Dual Citizenship in Africa | Citizenship Benefits & RequirementsExplore Dual Citizenship in Africa | Citizenship Benefits & Requirements
Explore Dual Citizenship in Africa | Citizenship Benefits & Requirements
 
Call Girls in Maurice Nagar (Delhi) ꧁8447779280꧂ Female Escorts Service in De...
Call Girls in Maurice Nagar (Delhi) ꧁8447779280꧂ Female Escorts Service in De...Call Girls in Maurice Nagar (Delhi) ꧁8447779280꧂ Female Escorts Service in De...
Call Girls in Maurice Nagar (Delhi) ꧁8447779280꧂ Female Escorts Service in De...
 
Best Interior Design Services in Haldwani
Best Interior Design Services in HaldwaniBest Interior Design Services in Haldwani
Best Interior Design Services in Haldwani
 
construction material procurement in India
construction material procurement in Indiaconstruction material procurement in India
construction material procurement in India
 
Top tourism places in Dubai - Inch & Brick Realty
Top tourism places in Dubai - Inch & Brick RealtyTop tourism places in Dubai - Inch & Brick Realty
Top tourism places in Dubai - Inch & Brick Realty
 
Low Rate Call girls in Sant Nagar{Delhi }8447779280} Service Escorts In South...
Low Rate Call girls in Sant Nagar{Delhi }8447779280} Service Escorts In South...Low Rate Call girls in Sant Nagar{Delhi }8447779280} Service Escorts In South...
Low Rate Call girls in Sant Nagar{Delhi }8447779280} Service Escorts In South...
 
The Gale at Godrej Park World Hinjewadi Pune Brochure.pdf
The Gale at Godrej Park World Hinjewadi Pune Brochure.pdfThe Gale at Godrej Park World Hinjewadi Pune Brochure.pdf
The Gale at Godrej Park World Hinjewadi Pune Brochure.pdf
 
Low Density Living New Project in BPTP THE AMAARIO Sector 37D Gurgaon Haryana...
Low Density Living New Project in BPTP THE AMAARIO Sector 37D Gurgaon Haryana...Low Density Living New Project in BPTP THE AMAARIO Sector 37D Gurgaon Haryana...
Low Density Living New Project in BPTP THE AMAARIO Sector 37D Gurgaon Haryana...
 
BPTP THE AMAARIO For The Royals Of Tomorrow in Sector 37D Gurgaon Dwarka Expr...
BPTP THE AMAARIO For The Royals Of Tomorrow in Sector 37D Gurgaon Dwarka Expr...BPTP THE AMAARIO For The Royals Of Tomorrow in Sector 37D Gurgaon Dwarka Expr...
BPTP THE AMAARIO For The Royals Of Tomorrow in Sector 37D Gurgaon Dwarka Expr...
 
Kalpataru Exquisite Wakad Pune E-Brochure.pdf
Kalpataru Exquisite Wakad Pune  E-Brochure.pdfKalpataru Exquisite Wakad Pune  E-Brochure.pdf
Kalpataru Exquisite Wakad Pune E-Brochure.pdf
 
Yedi Mavi TOBB Zeytinburnu - Listing Turkey
Yedi Mavi TOBB Zeytinburnu - Listing TurkeyYedi Mavi TOBB Zeytinburnu - Listing Turkey
Yedi Mavi TOBB Zeytinburnu - Listing Turkey
 
Cheap Rate ✨➥9582086666▻✨Call Girls In Gurgaon Sector 1 (Gurgaon)
Cheap Rate ✨➥9582086666▻✨Call Girls In Gurgaon Sector 1 (Gurgaon)Cheap Rate ✨➥9582086666▻✨Call Girls In Gurgaon Sector 1 (Gurgaon)
Cheap Rate ✨➥9582086666▻✨Call Girls In Gurgaon Sector 1 (Gurgaon)
 
Rohan Harita Tathawade Pune Brochure.pdf
Rohan Harita Tathawade Pune Brochure.pdfRohan Harita Tathawade Pune Brochure.pdf
Rohan Harita Tathawade Pune Brochure.pdf
 
Ganga Platinum Kharadi Pune brochure.pdf
Ganga Platinum Kharadi Pune brochure.pdfGanga Platinum Kharadi Pune brochure.pdf
Ganga Platinum Kharadi Pune brochure.pdf
 
Kohinoor Courtyard One Wakad Pune | Elegant Living Spaces
Kohinoor Courtyard One Wakad Pune | Elegant Living SpacesKohinoor Courtyard One Wakad Pune | Elegant Living Spaces
Kohinoor Courtyard One Wakad Pune | Elegant Living Spaces
 
Nyati Elite NIBM Road Pune E Brochure.pdf
Nyati Elite NIBM Road Pune E Brochure.pdfNyati Elite NIBM Road Pune E Brochure.pdf
Nyati Elite NIBM Road Pune E Brochure.pdf
 
SVN Live 5.6.24 Weekly Property Broadcast
SVN Live 5.6.24 Weekly Property BroadcastSVN Live 5.6.24 Weekly Property Broadcast
SVN Live 5.6.24 Weekly Property Broadcast
 
Vanam At Purva Soukhyam Guduvanchery.pdf.pdf
Vanam At Purva Soukhyam Guduvanchery.pdf.pdfVanam At Purva Soukhyam Guduvanchery.pdf.pdf
Vanam At Purva Soukhyam Guduvanchery.pdf.pdf
 
Eldeco Dwarka Project In Delhi-brochure.pdf.pdf
Eldeco Dwarka Project In Delhi-brochure.pdf.pdfEldeco Dwarka Project In Delhi-brochure.pdf.pdf
Eldeco Dwarka Project In Delhi-brochure.pdf.pdf
 
Madhugiri Boucher Managed Farmland (knx)
Madhugiri Boucher Managed Farmland (knx)Madhugiri Boucher Managed Farmland (knx)
Madhugiri Boucher Managed Farmland (knx)
 

Eurostat 2q 2013

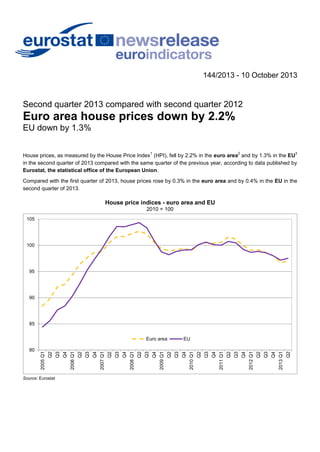
  • 1. 144/2013 - 10 October 2013 Second quarter 2013 compared with second quarter 2012 Euro area house prices down by 2.2% EU down by 1.3% 1 2 3 House prices, as measured by the House Price Index (HPI), fell by 2.2% in the euro area and by 1.3% in the EU in the second quarter of 2013 compared with the same quarter of the previous year, according to data published by Eurostat, the statistical office of the European Union. Compared with the first quarter of 2013, house prices rose by 0.3% in the euro area and by 0.4% in the EU in the second quarter of 2013. House price indices - euro area and EU 2010 = 100 105 100 95 90 85 Source: Eurostat Q2 2013 Q1 Q4 Q3 Q2 2012 Q1 Q4 Q3 Q2 Q4 2011 Q1 Q3 Q2 Q4 2010 Q1 EU Q3 Q2 Q4 2009 Q1 Q3 Q2 2008 Q1 Q4 Q3 Q2 2007 Q1 Q4 Q3 Q2 2006 Q1 Q4 Q3 Q2 80 2005 Q1 Euro area
  • 2. House price developments in the EU Member States Among the EU Member States for which data are available, the highest annual increases in house prices in the second quarter of 2013 were recorded in Latvia (+8.8%), Estonia (+8.1%) and Luxembourg (+5.1%), and the largest falls in Croatia (-19.7%), Spain (-10.6%) and the Netherlands (-7.5%). The highest quarterly increases in the second quarter of 2013 were recorded in Latvia (+5.1%), Estonia (+3.7%) and Denmark (+3.1%), and the largest falls in Croatia (-6.5%), the Netherlands (-2.0%) and Hungary (-0.9%). Quarterly and annual house price developments Percentage change compared with the previous quarter 2012 Q3 Percentage change compared with the same quarter of the previous year 2013 Q4 Q1 2012 Q2 Q3 2013 Q4 Q1 Q2 Belgium 1.1 -0.8 0.0 0.0 1.8 1.1 0.4 0.4 Germany 1.4 1.4 : : 4.3 5.0 : : Estonia 2.5 -1.4 3.1 3.7 8.3 5.8 7.7 8.1 -9.6 -4.5 -3.0 1.2 Ireland 1.5 0.0 -2.6 2.3 Greece : : : : : : : : Spain -3.7 -1.4 -5.1 -0.8 -16.1 -12.8 -12.8 -10.6 France 0.6 -1.4 -1.0 0.7 -1.6 -2.0 -1.8 -1.1 Italy -1.7 -2.2 -1.5 -0.6 -3.7 -5.2 -6.1 -5.9 Cyprus -1.3 0.5 -4.8 : -0.1 5.4 -0.4 : 0.3 2.9 -0.9 2.8 4.4 3.8 4.3 5.1 0.3 2.1 0.3 1.2 0.7 5.4 3.9 3.9 -3.8 0.8 -2.7 -2.0 -8.9 -6.4 -7.0 -7.5 p Luxembourg* Malta Netherlands Austria : : : : : : : : -0.9 -1.1 -3.2 0.9 -7.7 -6.0 -7.3 -4.3 Slovenia -2.6 -3.5 0.7 0.8 -6.0 -8.8 -4.3 -4.6 Slovakia 0.7 -2.0 2.3 0.3 -2.3 -2.9 0.0 1.2 Finland 0.2 0.0 0.7 0.5 2.1 3.1 2.1 1.4 -0.5 -0.6 -1.4 0.3 -2.5 -1.9 -2.4 -2.2 -0.1 -1.7 -0.9 0.5 -1.0 -1.3 -2.2 -2.2 -0.2 -0.1 -0.7 0.3 -1.6 -0.7 -1.0 -0.8 0.3 -0.5 0.5 3.1 -1.8 1.3 1.8 3.5 Croatia -4.1 -2.9 -7.7 -6.5 -0.2 -4.4 -15.3 -19.7 Latvia 2.1 1.2 0.1 5.1 0.1 7.4 5.0 8.8 Portugal p Euro area Bulgaria p p Czech Republic Denmark Lithuania -0.5 0.7 0.7 1.5 -1.2 -1.2 -0.1 2.4 Hungary -0.8 -2.0 -0.9 -0.9 -3.8 -5.3 -6.9 -4.5 c c c c c c c c Romania -4.2 -0.1 4.3 -0.8 -5.6 -1.3 -0.8 -1.0 Sweden 0.7 0.5 1.7 1.6 0.8 3.8 4.1 4.6 United Kingdom Poland 1.8 -0.7 -0.1 1.8 1.9 2.3 2.2 2.9 p -0.2 -0.6 -0.9 0.4 -1.9 -1.2 -1.5 -1.3 Iceland 1.3 0.1 0.7 2.7 6.7 4.7 4.2 4.9 Norway** 1.3 -0.4 2.9 2.0 8.4 8.3 7.7 5.8 EU * only flats ** only existing dwellings : data not available p provisional c confidential Source: Eurostat
  • 3. 1. The House Price Indices (HPIs) describe the price developments of all residential properties purchased by households (flats, detached houses, terraced houses, etc.), both newly built and existing, independently of their final use and independently of their previous owners. The Member States’ HPIs are compiled by the National Statistical Institutes. The euro area and the EU aggregate HPIs are compiled by Eurostat. HPIs are computed as annual chain indices allowing weights to be changed each year. The European HPI aggregates are currently calculated as weighted averages of the national HPIs using as weights the GDP at market prices (based on millions PPS) of the countries concerned. Missing country data is estimated by Eurostat using data from non-harmonised sources. These estimates are not published but are used to calculate euro area and EU aggregates. The Member States’ HPIs are compiled following a harmonised methodology. The methodology is summarised in the Handbook on Residential Property Price Indices, just published in the full 2013 edition on the homepage of Eurostat and in the Housing Price Statistics dedicated page: http://epp.eurostat.ec.europa.eu/portal/page/portal/hicp/methodology/hps/rppi_handbook and in a Methodological Manual: http://epp.eurostat.ec.europa.eu/portal/page/portal/hicp/methodology/hps/owner_occupied_housing This quarterly News Release is complemented by a Statistics Explained article on the Eurostat website: http://epp.eurostat.ec.europa.eu/statistics_explained/index.php/Housing_price_statistics_-_house_price_index 2. The euro area initially included Belgium, Germany, Ireland, Spain, France, Italy, Luxembourg, the Netherlands, Austria, Portugal and Finland. Greece was included from 1 January 2001, Slovenia from 1 January 2007, Cyprus and Malta from 1 January 2008, Slovakia from 1 January 2009 and Estonia from 1 January 2011. 3. The EU included 15 Member States until April 2004, 25 Member States from May 2004 until December 2006 and 27 Member States from January 2007. Croatia joined the EU on 1 July 2013 and will be included in the calculation of the EU HPI aggregate with the index for the third quarter of 2013. Issued by: Eurostat Press Office For further information on data and methodology: Tim ALLEN Tel: +352-4301-33 444 eurostat-pressoffice@ec.europa.eu Bogdan MAROLA Tel: +352-4301-34 955 estat-real-estate@ec.europa.eu Eurostat News Releases on the internet: http://ec.europa.eu/eurostat Selected Principal European Economic Indicators: http://ec.europa.eu/eurostat/euroindicators