SlideShare ist ein Scribd-Unternehmen logo
1 von 3
PASQUA PROFIT&LOSS(QUARTER PERIOD)2015
MAY JUNE JULY
FOOD SALES 826320 848640 717960
BEVERAGE SALES 425680 399360 440040
TOTAL 1252000 1248000 1158000 3658000
cost of sales
FOOD COST 264422.4 288537.6 236926.8
BEVERAGE COST 80879.2 71884.8 92408.4
TOTAL 345301.6 360422.4 329335.2 1035059.2
GROSS PROFIT 2622940.8
payroll
salaries 187800 187200 187200 562200
operating expenses(direct operating expenses)
cleaning supplies 250.4 249.6 231.6 731.6
decorations 626 624 579 1829
glassware 1126.8 1123.2 1042.2 3292.2
kitchen utensils/supplies 11268 11232 10422 32922
menu /uniform 7500 12000 6899 26399
total 65173.8
utilities
gas 8400 8000 7800 24200
electricity 54367 53879 51833 160079
internet 880 880 880 2640
phone 676 518 712 1906
water 1254 1365 915 3534
192359
general and administrative expenses
sales taxes 2504 2496 2316 7316
MUSIC&ENTERTAINMENT 1448 1448 1448 4344
transportations 2013 3548 1865 7426
social media/advertising 10000 10000 10000 30000
marketing 8900 8900 8900 26700
75786
non controlable costs
depreciation 126000 126000 126000 378000
rent 325000 325000 325000 975000
others(salary) 41000 41000 41000 123000
1476000
repair and maintenance
furniture 12000 0 0 12000
equipement 9600 7400 5200 22200
34200
total expenses 2405718.8
net income before taxes 217222

Weitere ähnliche Inhalte

Ähnlich wie p&l 2015 pasqua

Cisco Systems Excel Workbook
Cisco Systems Excel WorkbookCisco Systems Excel Workbook
Cisco Systems Excel Workbookh_bodduna
 
ICC Ukraine kraine world region import_export_(all products)_24052016
ICC Ukraine kraine world region import_export_(all products)_24052016ICC Ukraine kraine world region import_export_(all products)_24052016
ICC Ukraine kraine world region import_export_(all products)_24052016Elizaveta Gavrilenko
 
Valuation of Indian hospitality industry
Valuation of Indian hospitality industryValuation of Indian hospitality industry
Valuation of Indian hospitality industryShivani Chaluvadi
 
Diesel Production: Cost Estimation
Diesel Production: Cost EstimationDiesel Production: Cost Estimation
Diesel Production: Cost EstimationPratik Patel
 
Energy Analysis - Growth Rate 1984 - 2000 - 2019
Energy Analysis - Growth Rate 1984 - 2000 - 2019Energy Analysis - Growth Rate 1984 - 2000 - 2019
Energy Analysis - Growth Rate 1984 - 2000 - 2019Calvin Korponai
 
Cp gp day04 pineapple qausntification and costing 2
Cp gp day04 pineapple qausntification and costing 2Cp gp day04 pineapple qausntification and costing 2
Cp gp day04 pineapple qausntification and costing 2zubeditufail
 
mar 2008 sayed abdall
mar  2008 sayed abdallmar  2008 sayed abdall
mar 2008 sayed abdallSayed Helal
 
Financial management VN
Financial management VNFinancial management VN
Financial management VNTài Đinh
 
Ec 14 employed population by occupation, income and sex
Ec 14 employed population by occupation, income and sexEc 14 employed population by occupation, income and sex
Ec 14 employed population by occupation, income and sexEllis Jesurun
 
July 2015 - Market Snapshot - General Overview
July 2015  - Market Snapshot - General OverviewJuly 2015  - Market Snapshot - General Overview
July 2015 - Market Snapshot - General OverviewMLSListings Inc
 
Productivity and the Northern Ireland Economy
Productivity and the Northern Ireland Economy Productivity and the Northern Ireland Economy
Productivity and the Northern Ireland Economy NevinInstitute
 

Ähnlich wie p&l 2015 pasqua (20)

CRONY GROUP
CRONY GROUPCRONY GROUP
CRONY GROUP
 
Cisco Systems Excel Workbook
Cisco Systems Excel WorkbookCisco Systems Excel Workbook
Cisco Systems Excel Workbook
 
delaura 02 restaurant-projections 1
delaura 02 restaurant-projections 1delaura 02 restaurant-projections 1
delaura 02 restaurant-projections 1
 
FORECAST DETAILS CHFLCR 2017
FORECAST DETAILS CHFLCR 2017FORECAST DETAILS CHFLCR 2017
FORECAST DETAILS CHFLCR 2017
 
FORECAST DETAILS CHLCR 2017
FORECAST DETAILS CHLCR 2017FORECAST DETAILS CHLCR 2017
FORECAST DETAILS CHLCR 2017
 
ICC Ukraine kraine world region import_export_(all products)_24052016
ICC Ukraine kraine world region import_export_(all products)_24052016ICC Ukraine kraine world region import_export_(all products)_24052016
ICC Ukraine kraine world region import_export_(all products)_24052016
 
Gsdp all states[1]
Gsdp all states[1]Gsdp all states[1]
Gsdp all states[1]
 
Valuation of Indian hospitality industry
Valuation of Indian hospitality industryValuation of Indian hospitality industry
Valuation of Indian hospitality industry
 
Diesel Production: Cost Estimation
Diesel Production: Cost EstimationDiesel Production: Cost Estimation
Diesel Production: Cost Estimation
 
Energy Analysis - Growth Rate 1984 - 2000 - 2019
Energy Analysis - Growth Rate 1984 - 2000 - 2019Energy Analysis - Growth Rate 1984 - 2000 - 2019
Energy Analysis - Growth Rate 1984 - 2000 - 2019
 
Cp gp day04 pineapple qausntification and costing 2
Cp gp day04 pineapple qausntification and costing 2Cp gp day04 pineapple qausntification and costing 2
Cp gp day04 pineapple qausntification and costing 2
 
mar 2008 sayed abdall
mar  2008 sayed abdallmar  2008 sayed abdall
mar 2008 sayed abdall
 
SOHO Package Analysis
SOHO Package AnalysisSOHO Package Analysis
SOHO Package Analysis
 
Financial management VN
Financial management VNFinancial management VN
Financial management VN
 
delaura 01 restaurant-projections 1
delaura 01 restaurant-projections 1delaura 01 restaurant-projections 1
delaura 01 restaurant-projections 1
 
Ec 14 employed population by occupation, income and sex
Ec 14 employed population by occupation, income and sexEc 14 employed population by occupation, income and sex
Ec 14 employed population by occupation, income and sex
 
OFC BUDGET.V5
OFC BUDGET.V5OFC BUDGET.V5
OFC BUDGET.V5
 
July 2015 - Market Snapshot - General Overview
July 2015  - Market Snapshot - General OverviewJuly 2015  - Market Snapshot - General Overview
July 2015 - Market Snapshot - General Overview
 
Productivity and the Northern Ireland Economy
Productivity and the Northern Ireland Economy Productivity and the Northern Ireland Economy
Productivity and the Northern Ireland Economy
 
delaura 03 restaurant-projections 1
delaura 03 restaurant-projections 1delaura 03 restaurant-projections 1
delaura 03 restaurant-projections 1
 

p&l 2015 pasqua

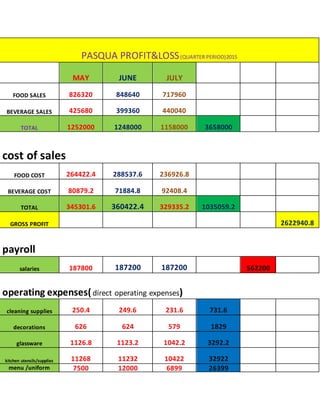
  • 1. PASQUA PROFIT&LOSS(QUARTER PERIOD)2015 MAY JUNE JULY FOOD SALES 826320 848640 717960 BEVERAGE SALES 425680 399360 440040 TOTAL 1252000 1248000 1158000 3658000 cost of sales FOOD COST 264422.4 288537.6 236926.8 BEVERAGE COST 80879.2 71884.8 92408.4 TOTAL 345301.6 360422.4 329335.2 1035059.2 GROSS PROFIT 2622940.8 payroll salaries 187800 187200 187200 562200 operating expenses(direct operating expenses) cleaning supplies 250.4 249.6 231.6 731.6 decorations 626 624 579 1829 glassware 1126.8 1123.2 1042.2 3292.2 kitchen utensils/supplies 11268 11232 10422 32922 menu /uniform 7500 12000 6899 26399
  • 2. total 65173.8 utilities gas 8400 8000 7800 24200 electricity 54367 53879 51833 160079 internet 880 880 880 2640 phone 676 518 712 1906 water 1254 1365 915 3534 192359 general and administrative expenses sales taxes 2504 2496 2316 7316 MUSIC&ENTERTAINMENT 1448 1448 1448 4344 transportations 2013 3548 1865 7426 social media/advertising 10000 10000 10000 30000 marketing 8900 8900 8900 26700 75786 non controlable costs depreciation 126000 126000 126000 378000 rent 325000 325000 325000 975000
  • 3. others(salary) 41000 41000 41000 123000 1476000 repair and maintenance furniture 12000 0 0 12000 equipement 9600 7400 5200 22200 34200 total expenses 2405718.8 net income before taxes 217222