

Empfohlen
Weitere ähnliche Inhalte
Was ist angesagt?
Was ist angesagt? (20)
Andere mochten auch
Ähnlich wie Circular flow
Ähnlich wie Circular flow (20)
Mehr von Marvin Morales
Mehr von Marvin Morales (20)
Circular flow
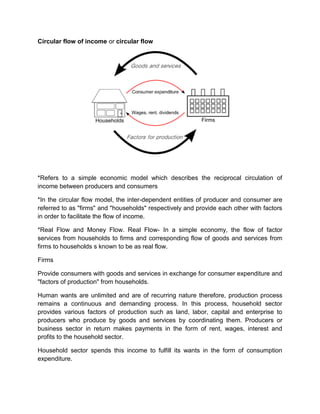
- 1. Circular flow of income or circular flow *Refers to a simple economic model which describes the reciprocal circulation of income between producers and consumers *In the circular flow model, the inter-dependent entities of producer and consumer are referred to as "firms" and "households" respectively and provide each other with factors in order to facilitate the flow of income. *Real Flow and Money Flow. Real Flow- In a simple economy, the flow of factor services from households to firms and corresponding flow of goods and services from firms to households s known to be as real flow. Firms Provide consumers with goods and services in exchange for consumer expenditure and "factors of production" from households. Human wants are unlimited and are of recurring nature therefore, production process remains a continuous and demanding process. In this process, household sector provides various factors of production such as land, labor, capital and enterprise to producers who produce by goods and services by coordinating them. Producers or business sector in return makes payments in the form of rent, wages, interest and profits to the household sector. Household sector spends this income to fulfill its wants in the form of consumption expenditure.
- 2. Business sector supplies those goods and services produced and get income in return of it. Thus expenditure of one sector becomes the income of the other and supply of goods and services by one section of the community becomes demand for the other. A continuous flow of production, income and expenditure is known as circular flow of income. It is circular because it has neither any beginning nor an end. The circular flow of income involves two basic assumptions 1. In any exchange process, the seller or producer receives the same amount what buyer or consumer spends. 2. Goods and services flow in one direction and money payment to get these flow in return direction, causes a circular flow. Money Flow- In a modern two sector economy, money acts as a medium of exchange between goods and factor services. Money flow of income refers to a monetary payment from firms to households for their factor services and in return monetary payments from households to firms against their goods and services. Household sector gets monetary reward for their services in the form of rent, wages, interest, and profit form firm sector and spends it for obtaining various types of goods to satisfy their wants. Money acts as a helping agent in such an exchange. Two Sector Model In the simple two sector circular flow of income model the state of equilibrium is defined as a situation in which there is no tendency for the levels of income (Y), expenditure (E) and output (O) to change, Y=E=O This means that the expenditure of buyers (households) becomes income for sellers (firms). The firms then spend this income on factors of production such as labour, capital and raw materials, "transferring" their income to the factor owners. The factor owners spend this income on goods which leads to a circular flow of income. Three Sector Model It includes household sector, producing sector and government sector.
- 3. It will study a circular flow income in these sectors excluding rest of the world i.e. closed economy income. Here flows from household sector and producing sector to government sector are in the form of taxes. The income received from the government sector flows to producing and household sector in the form of payments for government purchases of goods and services as well as payment of subsides and transfer payments. Every payment has a receipt in response of it by which aggregate expenditure of an economy becomes identical to aggregate income and makes this circular flow and unending. Four Sector Model A modern monetary economy comprises a network of four sector economies this are- 1.Household sector 2.Firms or producing sector 3.Government sector 4.Rest of the world sector. Each of the above sectors receives some payments from the other in lieu of goods and services which makes a regular flow of goods and physical services. Money facilitates such an exchange smoothly. A residual of each market comes in capital market as saving which inturn is invested in firms and government sector. Five sector model LEAKAGES INJECTION Saving (S) Investment (I) Taxes (T) Government Spending (G) Imports (M) Exports (X) The five sector model of the circular flow of income is a more realistic representation of the economy. The first is the Financial Sector that consists of banks and non-bank intermediaries who engage in the borrowing (savings from households) and lending of money. In terms of the circular flow of income model the leakage that financial institutions provide in the economy is the option for households to save their money.
- 4. This is a leakage because the saved money cannot be spent in the economy and thus is an idle asset that means not all output will be purchased. The injection that the financial sector provides into the economy is investment (I) into the business/firms sector. The leakage that the Government sector provides is through the collection of revenue through Taxes (T) that is provided by households and firms to the government. For this reason they are a leakage because it is a leakage out of the current income thus reducing the expenditure on current goods and services. The injection provided by the government sector is Government spending (G) that provides collective services and welfare payments to the community. An example of a tax collected by the government as a leakage is income tax and an injection into the economy can be when the government redistributes this income in the form of welfare payments that is a form of government spending back into the economy. The final sector in the circular flow of income model is the overseas sector which transforms the model from a closed economy to an open economy. The main leakage from this sector are imports (M), which represent spending by residents into the rest of the world. The main injection provided by this sector is the exports of goods and services which generate income for the exporters from overseas residents. In terms of the five sector circular flow of income model the state of equilibrium occurs when the total leakages are equal to the total injections that occur in the economy. This can be shown as: Savings + Taxes + Imports = Investment + Government Spending + Exports S + T + M = I + G + X. This can be further illustrated through the fictitious economy of Noka where: S + T + M = I + G + X $100 + $150 + $50 = $50 + $100 + $150 $300 = $300 Therefore since the leakages are equal to the injections the economy is in a stable state of equilibrium. This state can be contrasted to the state of disequilibrium where unlike that of equilibrium the sum of total leakages does not equal the sum of total injections. By giving values to the leakages and injections the circular flow of income can be used to show the state of disequilibrium. Disequilibrium can be shown as: S+T+M≠I+G+X
- 5. Therefore it can be shown as one of the below equations where: Total leakages > Total injections P150 (S) + P250 (T) + P150 (M) >P75 (I) + P200 (G) + 150 (X) Or Total Leakages < Total injections P50 (S) + P200 (T) + $125 (M) <P75 (I) + P200 (G) + P150 (X) The effects of disequilibrium vary according to which of the above equations they belong to. If S + T + M > I + G + X the levels of income, output, expenditure and employment will fall causing a recession or contraction in the overall economic activity. But if S + T + M < I + G + X the levels of income, output, expenditure and employment will rise causing a boom or expansion in economic activity. To manage this problem, if disequilibrium were to occur in the five sector circular flow of income model, changes in expenditure and output will lead to equilibrium being regained. An example of this is if: S + T + M > I + G + X the levels of income, expenditure and output will fall causing a contraction or recession in the overall economic activity. As the income falls (Figure 4) households will cut down on all leakages such as saving, they will also pay less in taxation and with a lower income they will spend less on imports. This will lead to a fall in the leakages until they equal the injections and a lower level of equilibrium will be the result. The other equation of disequilibrium, if S + T + M < I + G + X in the five sector model the levels of income, expenditure and output will greatly rise causing a boom in economic activity. As the households income increases there will be a higher opportunity to save therefore saving in the financial sector will increase, taxation for the higher threshold will increase and they will be able to spend more on imports. In this case when the leakages increase they will continue to rise until they are equal to the level injections. The end result of this disequilibrium situation will be a higher level of equilibrium. Significance of Study of Circular Flow of Income 1.Measurement of National Income- National income is an estimation of aggregation of any of economic activity of the circular flow. It is either the income of all the factors of production or the expenditure of various sectors of economy. However, aggregate amount of each of the activity is identical to each other.
- 6. 2.Knowledge of Interdependence- Circular flow of income signifies the interdependence of each of activity upon one another. If there is no consumption, there will be no demand and expenditure which infacts restricts the amount of production and income. 3.Unending Nature of Economic Activities- It signifies that production, income and expenditure are of unending nature, therefore, economic activities in an economy can never come to a halt. National income is also bound to rise in future. 4.Injections and Leakages Reference- A General Approach to Macroeconomic Policy. Difference between Real Flow and Money Flow 1. Real flow is the exchange of goods and services between household and firms whereas money flow is the monetary exchange between two sectors. 2. In real flow household sector supplies raw material, land, labour, capital and enterprise to firms and in return firms sector provides finished goods and services to household sector. Whereas in money flow, firm sector gives remuneration in the form of money to household sector a wages and salaries, rent, interest etc. 3. Difficulties of barter system for the exchange of goods and factor services between households and firms sector in real flow, whereas no such difficulty or inconvenience arise in money flow. 4. When goods and services flow from one sector of the economy to another, it is known as real flow. Phases or Stages of Circular Flow of Income Production, consumption expenditure and generation of income are the three basic economic activities of an economy that go on endlessly and are titled as circular flow of income. Production gives rise to income, income gives rise to demand for goods and services ; such a demand gives rise to expenditure and expenditure induces for further production. The whole process forms the basis for circular flow of income and related activities- production, income and expenditure are known as phases or stages of circular flow of income. Production → Income → Expenditure → Production. 1. Production Phase- Production means creation of utility to satisfy human wants. It involves the co-ordination of all the factors of production in some desired ratio. This job is performed by a producer or firm who takes an initiative with the motive of earning profits. He hires land, labour, capital and an organization and makes them payment in the form of rent, wages and salaries and interest. This phase is to produce goods and services and after selling them, it generates income.
- 7. 2. Income Phase- Producing firms earn revenue from the sale of goods and services produced by them. Whole of the earning is divided between factors provided by household sector in the form of rent, wages, interest and profits. Such an income is classified into three parts:- •Compensation of employees- Wages, salaries, commission, bonus etc. •Operating Surplus- Profits, rent, interest, royalty etc. •Mixed Income- Income of self- employed Thus production takes the shape of income of household sector. 3. Expenditure Phase- Household sector spends its income to satisfy unlimited and recurring human wants. Any saving out of total income takes the shape of investment on capital goods that helps in generating the income of the economy. Expenditure becomes the income of producing sector that promotes further the uninterrupted flow of income. Gross national income The Gross national income (GNI) consists of: the personal consumption expenditure, the gross private investment, the government consumption expenditures, the net income from assets abroad (net income receipts), and the gross exports of goods and services, after deducting two components: the gross imports of goods and services, and the indirect business taxes. The GNI is similar to the gross national product (GNP), except that in measuring the GNP one does not deduct the indirect business taxes. GNI versus GDP For example, the profits of a Philippines-owned company operating in the UK will only count towards PHL GNI and UK GDP. If a country becomes heavily indebted, and pays large amounts of interest to service this debt, this will be reflected in a decreased GNI but not a decreased GDP. If a country sells off its resources to entities outside their country this will also be reflected over time in decreased GNI, but not decreased GDP. Therefore, the GDP appears more attractive for countries with increasing national debt and decreasing assets. GNP is a concept that goes hand in hand with GNI, GDP, and NNI. In contrast to the GNI, the GNP does not account for the balance of cross-country income, such as interest and dividends. In contrast to the GDP, the GNP account for the values of products and services based on citizenship of the owners rather than the territory of the activity How to Calculate the GNI GNI is an add up of Net Income from abroad and the GDP, one can calculate the GNI by the following formula.
- 8. Measures of national income and output A variety of measures of national income and output are used in economics to estimate total economic activity in a country or region, including gross domestic product (GDP), gross national product (GNP), net national income (NNI), and adjusted national income (NNI* adjusted for natural resource depletion). All are especially concerned with counting the total amount of goods and services produced within some "boundary” The boundary is usually defined by geography or citizenship, and may also restrict the goods and services that are counted. For instance, some measures count only goods and services that are exchanged for money, excluding bartered goods, while other measures may attempt to include bartered goods by imputing monetary values to them. National accounts Arriving at a figure for the total production of goods and services in a large region like a country entails a large amount of data-collection and calculation. Although some attempts were made to estimate national incomes as long ago as the 17th century, The systematic keeping of national accounts, of which these figures are a part, only began in the 1930s, in the United States and some European countries. The impetus for that major statistical effort was the Great Depression and the rise of Keynesian economics, which prescribed a greater role for the government in managing an economy, and made it necessary for governments to obtain accurate information so that their interventions into the economy could proceed as well-informed as possible. Market value In order to count a good or service, it is necessary to assign value to it. The value that the measures of national income and output assign to a good or service is its market value – the price it fetches when bought or sold. The actual usefulness of a product (its use-value) is not measured – assuming the use- value to be any different from its market value. Three strategies have been used to obtain the market values of all the goods and services produced: the product (or output) method, the expenditure method, and the income method. The product method looks at the economy on an industry-by-industry basis. The total output of the economy is the sum of the outputs of every industry. However, since an output of one industry may be used by another industry and become part of the
- 9. output of that second industry, to avoid counting the item twice we use not the value output by each industry, but the value-added; that is, the difference between the value of what it puts out and what it takes in. The total value produced by the economy is the sum of the values-added by every industry. The expenditure method is based on the idea that all products are bought by somebody or some organisation. Therefore we sum up the total amount of money people and organisations spend in buying things. This amount must equal the value of everything produced. Usually expenditures by private individuals, expenditures by businesses, and expenditures by government are calculated separately and then summed to give the total expenditure. Also, a correction term must be introduced to account for imports and exports outside the boundary. The income method works by summing the incomes of all producers within the boundary. Since what they are paid is just the market value of their product, their total income must be the total value of the product. Wages, proprieter's incomes, and corporate profits are the major subdivisions of income. The output approach The output approach focuses on finding the total output of a nation by directly finding the total value of all goods and services a nation produces. Because of the complication of the multiple stages in the production of a good or service, only the final value of a good or service is included in the total output. This avoids an issue often called 'double counting', wherein the total value of a good is included several times in national output, by counting it repeatedly in several stages of production. In the example of meat production, the value of the good from the farm may be P10, then P30 from the butchers, and then P60 from the supermarket. The value that should be included in final national output should be P60, not the sum of all those numbers, P100. The values added at each stage of production over the previous stage are respectively P10, P20, and P30. Their sum gives an alternative way of calculating the value of final output. Formulae: GDP(gross domestic product) at market price = value of output in an economy in the particular year - intermediate consumption
- 10. NNP at factor cost = GDP at market price - depreciation + NFIA (net factor income from abroad) - net indirect taxes The income approach The income approach equates the total output of a nation to the total factor income received by residents or citizens of the nation. The main types of factor income are: Employee compensation (cost of fringe benefits, including unemployment, health, and retirement benefits); Interest received net of interest paid; Rental income (mainly for the use of real estate) net of expenses of landlords; Royalties paid for the use of intellectual property and extractable natural resources. All remaining value added generated by firms is called the residual or profit. If a firm has stockholders, they own the residual, some of which they receive as dividends. Profit includes the income of the entrepreneur - the businessman who combines factor inputs to produce a good or service. Formula NDP at factor cost = Compensation of employees + Net interest + Rental & royalty income + Profit of incorporated and unincorporated NDP at factor cost. The expenditure approach The expenditure approach is basically an output accounting method. It focuses on finding the total output of a nation by finding the total amount of money spent. This is acceptable, because like income, the total value of all goods is equal to the total amount of money spent on goods. The basic formula for domestic output takes all the different areas in which money is spent within the region, and then combines them to find the total output. Where: C = household consumption expenditures / personal consumption expenditures I = gross private domestic investment G = government consumption and gross investment expenditures X = gross exports of goods and services M = gross imports of goods and services Note: (X - M) is often written as XN, which stands for "net exports"
- 11. GDP and Gross domestic product (GDP) is defined as "the value of all final goods and services produced in a country in 1 year". Gross National Product (GNP) is defined as "the market value of all goods and services produced in one year by labour and property supplied by the residents of a country." As an example, the table below shows some GDP and GNP, and NNI data for the United States: National income and output (Billions of dollars) Period Ending 2003 Gross national product 11,063.3 Net U.S. income receipts from rest of the world 55.2 U.S. income receipts 329.1 U.S. income payments -273.9 Gross domestic product 11,008.1 Private consumption of fixed capital 1,135.9 Government consumption of fixed capital 218.1 Statistical discrepancy 25.6 National Income 9,679. NDP: Net domestic product is defined as "gross domestic product (GDP) minus depreciation of capital",[ similar to NNP. GDP per capita: Gross domestic product per capita is the mean value of the output produced per person, which is also the mean income. National income and welfare GDP per capita (per person) is often used as a measure of a person's welfare. Countries with higher GDP may be more likely to also score highly on other measures of welfare, such as life expectancy. However, there are serious limitations to the usefulness of GDP as a measure of welfare: Measures of GDP typically exclude unpaid economic activity, most importantly domestic work such as childcare. This leads to distortions; for example, a paid nanny's income contributes to GDP, but an unpaid parent's time spent caring for children will not, even though they are both carrying out the same economic activity. GDP takes no account of the inputs used to produce the output. For example, if everyone worked for twice the number of hours, then GDP might roughly double, but this does not necessarily mean that workers are better off as they would have
- 12. less leisure time. Similarly, the impact of economic activity on the environment is not measured in calculating GDP. Comparison of GDP from one country to another may be distorted by movements in exchange rates. Measuring national income at purchasing power parity may overcome this problem at the risk of overvaluing basic goods and services, for example subsistence farming. GDP does not measure factors that affect quality of life, such as the quality of the environment (as distinct from the input value) and security from crime. This leads to distortions - for example, spending on cleaning up an oil spill is included in GDP, but the negative impact of the spill on well-being (e.g. loss of clean beaches) is not measured. GDP is the mean (average) wealth rather than median (middle-point) wealth. Countries with a skewed income distribution may have a relatively high per- capita GDP while the majority of its citizens have a relatively low level of income, due to concentration of wealth in the hands of a small fraction of the population. Because of this, other measures of welfare such as the Human Development Index (HDI), Index of Sustainable Economic Welfare (ISEW), Genuine Progress Indicator (GPI), gross national happiness (GNH), and sustainable national income (SNI) are used. Difficulties in Measurement of National Income There are many difficulties when it comes to measuring national income, however these can be grouped into conceptual difficulties and practical difficulties. Conceptual Difficulties Inclusion of Services: There has been some debate about whether to include services in the counting of national income, and if it counts as output. Marxian economists are of the belief that services should be excluded from national income, most other economists though are in agreement that services should be included. Identifying Intermediate Goods: The basic concept of national income is to only include final goods, intermediate goods are never included, but in reality it is very hard to draw a clear cut line as to what intermediate goods are. Many goods can be justified as intermediate as well as final goods depending on their use. Identifying Factor Incomes: Separating factor incomes and non factor incomes is also a huge problem. Factor incomes are those paid in exchange for factor services like wages, rent, interest etc. Non factor are sale of shares selling old cars property etc., but these are made to look like factor incomes and hence are mistakenly included in national income. Services of Housewives and other similar services: National income includes those goods and services for which payment has been made, but there are scores of jobs, for which money as such is not paid, also there are jobs which people do themselves like maintain the gardens etc., so if they hired someone
- 13. else to do this for them, then national income would increase, the argument then is why are these acts not accounted for now, but the bigger issue would be how to keep a track of these activities and include them in national income. Practical Difficulties Unreported Illegal Income: Sometimes, people don't provide all the right information about their incomes to evade taxes so this obviously causes disparities in the counting of national income. Non Monetized Sector: In many developing nations, there is this issue that goods and services are traded through barter, i.e. without any money. Such goods and services should be included in accounting of national income, but the absence of data makes this inclusion difficult.