
Empfohlen
Weitere ähnliche Inhalte
Was ist angesagt?
Was ist angesagt? (20)
Andere mochten auch
Andere mochten auch (20)
Ähnlich wie Pre Algebra chapter 1 notes
Ähnlich wie Pre Algebra chapter 1 notes (20)
Pre Algebra chapter 1 notes
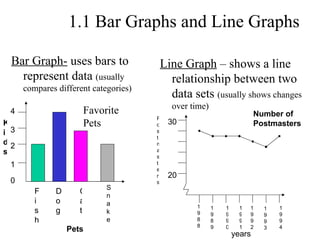
- 1. 1.1 Bar Graphs and Line Graphs Bar Graph- uses bars to represent data (usually compares different categories) Line Graph – shows a line relationship between two data sets (usually shows changes over time) Fish Dog Snake Cat 4 3 2 1 0 20 30 1988 1989 1990 1991 1992 1993 1994 Number of Postmasters Postmasters years Kids Pets Favorite Pets
- 2. 1.1 Histograms Frequency Table- shows classes of things, a tally, and the frequency at which they occur Example – Hours watching TV 0, 1, 5, 4, 0, 1, 4, 1, 3 Histogram – are useful when displaying intervals 0-1 2-3 4-5 Hours Students Hours watching TV 6 5 4 3 2 1 Hours Tally Frequency 0-1 IIII 5 2-3 I 1 4-5 III 3
- 4. 1.3 Writing Algebraic Expressions Examples : 6 more than a number -> 6 + n 8 less than twice a number -> 2t – x M7D2.2.1; M8D2.2.1; M8D2.2.2 addition subtraction multiplication division Plus Minus Times Divided by Sum Difference Product Quotient More than Less than Double Half of Increased by Decreased by By Separate equally Gain of Less of per
- 6. 1.4 Powers and Exponents 5 3 is a way to show repeated multiplication. 5 - is the base 3 - is the exponent , or the power 5 3 = 5 x 5 x 5 = 125 -2(9-6) 2 + 15 = -2(3) 2 +15 = -2(9)+15 = -18 + 15 = -3 Expanded form Evaluated form M8A1.1.1 M8A1.1.2 M8A2.1.1 M7A2.1.1
- 8. 1.6 Perimeter and Area