SlideShare ist ein Scribd-Unternehmen logo
1 von 14
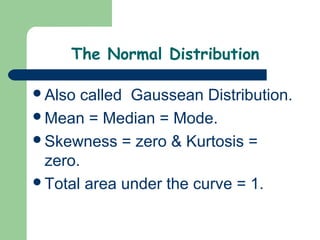
The Normal Distribution

Also called Gaussean Distribution.
Mean = Median = Mode.
Skewness = zero & Kurtosis =
 zero.
Total area under the curve = 1.
The Normal Distribution
The Normal Distribution, cont.

 68%  of observations lie between minus & plus
  one SD. ( -1Z & +1Z ).
 95% of observations lie between minus 1.96 &
  plus 1.96 SD units.
 99% of observations lie between minus 2.58 &
  plus 2.58 SD units.
 99.7% of observations lie between minus 3 &
  plus 3 SD units.
Confidence interval for a mean

 The  range with in which the population mean
 is likely to lie.
                        s.d.
 95% C.I. = X ± 1.96
                       √n
                       s.d.
 99% C.I. = X ± 2.58
                       √n
Confidence interval for a mean

If n ≤ 30
                s.d.
 C.I. = X ± t
                √n
Steps of testing the statistical
            hypothesis

*Assumption
   We assume that our population(s) are
  normally distributed.
*Hypothesis
   We put null hypothesis (Ho) &
alternative hypothesis (HA).
*Levels of significance (alpha)
Alpha = the probability of rejecting a true
  null hypothesis.
 Usually alpha = 0.05 or 0.01
*Degrees of freedom (d.f.): Depends on
  the type of the statistical test.
*The statistics
Depends on type of data.
*Statistical decision
Whether to reject or not to reject Ho.

*P value
Whether < or > 0.05
(or whether P < or > 0.01)
Tests of Statistical Significance

Depending  on the type of data, an
 appropriate test will be used.
Generally speaking, Data are either
 numerical or categorical data.
•   For Numerical data; we usually compute
    the mean & it’s standard deviation.


•   In order to test whether there is a
    significant difference between two means
    related to two different groups, we use
    the student (t) test.
       The t test is also used to compare
    between two sets of data within the same
    group ie. To compare between two readings
    for the same person but on two occasions,
    eg. Before & after treatment.
*To compare between several means; we
 use the analysis of variance (ANOVA, or
 called the F test); & when we have
 several numerical variables & one of
 them is dependent on the others
 (independent variables) then we use the
 multiple regression.
*In order to examine the nature & strength of
  the relationship between two variables ( e.g..
  Blood pressure & age), simple linear regression
  & correlation tests are used.
*The objective of regression analysis is to
  predict (estimate) the value of one variable
  corresponding to a given value of another
  variable.
*Correlation analysis is concerned with measuring
  the strength of the relationship between
  variables.

Weitere ähnliche Inhalte

Was ist angesagt?

Analysis of Variance - Meaning and Types
Analysis of Variance - Meaning and TypesAnalysis of Variance - Meaning and Types
Analysis of Variance - Meaning and TypesSundar B N
 
Tests of significance
Tests of significanceTests of significance
Tests of significanceAkhilaNatesan
 
Contingency table
Contingency tableContingency table
Contingency tableWeam Banjar
 
Chi square tests using spss
Chi square tests using spssChi square tests using spss
Chi square tests using spssParag Shah
 
parameter Estimation and effect size
parameter Estimation and effect size parameter Estimation and effect size
parameter Estimation and effect size hannantahir30
 
Emil Pulido on Quantitative Research: Inferential Statistics
Emil Pulido on Quantitative Research: Inferential StatisticsEmil Pulido on Quantitative Research: Inferential Statistics
Emil Pulido on Quantitative Research: Inferential StatisticsEmilEJP
 
Aron chpt 11 ed (2)
Aron chpt 11 ed (2)Aron chpt 11 ed (2)
Aron chpt 11 ed (2)Sandra Nicks
 
Anova (f test) and mean differentiation
Anova (f test) and mean differentiationAnova (f test) and mean differentiation
Anova (f test) and mean differentiationSubramani Parasuraman
 
Analysis of variance (anova)
Analysis of variance (anova)Analysis of variance (anova)
Analysis of variance (anova)Sadhana Singh
 
The chi – square test
The chi – square testThe chi – square test
The chi – square testMajesty Ortiz
 
Chi square test final
Chi square test finalChi square test final
Chi square test finalHar Jindal
 
Analysis of Variance
Analysis of VarianceAnalysis of Variance
Analysis of VarianceKashif Latif
 
Statistical inference: Statistical Power, ANOVA, and Post Hoc tests
Statistical inference: Statistical Power, ANOVA, and Post Hoc testsStatistical inference: Statistical Power, ANOVA, and Post Hoc tests
Statistical inference: Statistical Power, ANOVA, and Post Hoc testsEugene Yan Ziyou
 

Was ist angesagt? (20)

Inferential statistics correlations
Inferential statistics correlationsInferential statistics correlations
Inferential statistics correlations
 
Z-Test with Examples
Z-Test with ExamplesZ-Test with Examples
Z-Test with Examples
 
Analysis of Variance - Meaning and Types
Analysis of Variance - Meaning and TypesAnalysis of Variance - Meaning and Types
Analysis of Variance - Meaning and Types
 
Tests of significance
Tests of significanceTests of significance
Tests of significance
 
Contingency table
Contingency tableContingency table
Contingency table
 
Chi square tests using spss
Chi square tests using spssChi square tests using spss
Chi square tests using spss
 
T test
T testT test
T test
 
parameter Estimation and effect size
parameter Estimation and effect size parameter Estimation and effect size
parameter Estimation and effect size
 
Emil Pulido on Quantitative Research: Inferential Statistics
Emil Pulido on Quantitative Research: Inferential StatisticsEmil Pulido on Quantitative Research: Inferential Statistics
Emil Pulido on Quantitative Research: Inferential Statistics
 
Chi square Test
Chi square TestChi square Test
Chi square Test
 
The Sign Test
The Sign TestThe Sign Test
The Sign Test
 
Aron chpt 11 ed (2)
Aron chpt 11 ed (2)Aron chpt 11 ed (2)
Aron chpt 11 ed (2)
 
Anova (f test) and mean differentiation
Anova (f test) and mean differentiationAnova (f test) and mean differentiation
Anova (f test) and mean differentiation
 
Contingency tables
Contingency tables  Contingency tables
Contingency tables
 
Chi square
Chi squareChi square
Chi square
 
Analysis of variance (anova)
Analysis of variance (anova)Analysis of variance (anova)
Analysis of variance (anova)
 
The chi – square test
The chi – square testThe chi – square test
The chi – square test
 
Chi square test final
Chi square test finalChi square test final
Chi square test final
 
Analysis of Variance
Analysis of VarianceAnalysis of Variance
Analysis of Variance
 
Statistical inference: Statistical Power, ANOVA, and Post Hoc tests
Statistical inference: Statistical Power, ANOVA, and Post Hoc testsStatistical inference: Statistical Power, ANOVA, and Post Hoc tests
Statistical inference: Statistical Power, ANOVA, and Post Hoc tests
 

Andere mochten auch

Communication for health_education_2010
Communication for health_education_2010Communication for health_education_2010
Communication for health_education_2010Forensic Pathology
 
Pericardial dis.&cardiactumors 5
Pericardial dis.&cardiactumors 5Pericardial dis.&cardiactumors 5
Pericardial dis.&cardiactumors 5Forensic Pathology
 
1 thinking about research & nature of research2
1 thinking about research & nature of research21 thinking about research & nature of research2
1 thinking about research & nature of research2Forensic Pathology
 
Stat3 central tendency & dispersion
Stat3 central tendency & dispersionStat3 central tendency & dispersion
Stat3 central tendency & dispersionForensic Pathology
 

Andere mochten auch (8)

Stat 1 variables & sampling
Stat 1 variables & samplingStat 1 variables & sampling
Stat 1 variables & sampling
 
Communication for health_education_2010
Communication for health_education_2010Communication for health_education_2010
Communication for health_education_2010
 
Exercise 1 12 no solution
Exercise 1 12 no solutionExercise 1 12 no solution
Exercise 1 12 no solution
 
Pericardial dis.&cardiactumors 5
Pericardial dis.&cardiactumors 5Pericardial dis.&cardiactumors 5
Pericardial dis.&cardiactumors 5
 
Infectious disease p1
Infectious disease p1Infectious disease p1
Infectious disease p1
 
1 thinking about research & nature of research2
1 thinking about research & nature of research21 thinking about research & nature of research2
1 thinking about research & nature of research2
 
Stat6 chi square test
Stat6 chi square testStat6 chi square test
Stat6 chi square test
 
Stat3 central tendency & dispersion
Stat3 central tendency & dispersionStat3 central tendency & dispersion
Stat3 central tendency & dispersion
 

Ähnlich wie Stat 4 the normal distribution & steps of testing hypothesis

Stat 4 the normal distribution & steps of testing hypothesis
Stat 4 the normal distribution & steps of testing hypothesisStat 4 the normal distribution & steps of testing hypothesis
Stat 4 the normal distribution & steps of testing hypothesisForensic Pathology
 
1.1 course notes inferential statistics
1.1 course notes inferential statistics1.1 course notes inferential statistics
1.1 course notes inferential statisticsDjamel Bob
 
Testing hypothesis
Testing hypothesisTesting hypothesis
Testing hypothesisAmit Sharma
 
Parametric tests seminar
Parametric tests seminarParametric tests seminar
Parametric tests seminardrdeepika87
 
Review & Hypothesis Testing
Review & Hypothesis TestingReview & Hypothesis Testing
Review & Hypothesis TestingSr Edith Bogue
 
Statistical data handling
Statistical data handling Statistical data handling
Statistical data handling Rohan Jagdale
 
Point Estimate, Confidence Interval, Hypotesis tests
Point Estimate, Confidence Interval, Hypotesis testsPoint Estimate, Confidence Interval, Hypotesis tests
Point Estimate, Confidence Interval, Hypotesis testsUniversity of Salerno
 
Biostatistics
BiostatisticsBiostatistics
Biostatisticspriyarokz
 
RMH Concise Revision Guide - the Basics of EBM
RMH Concise Revision Guide -  the Basics of EBMRMH Concise Revision Guide -  the Basics of EBM
RMH Concise Revision Guide - the Basics of EBMAyselTuracli
 
ChandanChakrabarty_1.pdf
ChandanChakrabarty_1.pdfChandanChakrabarty_1.pdf
ChandanChakrabarty_1.pdfDikshathawait
 
Basics of biostatistic
Basics of biostatisticBasics of biostatistic
Basics of biostatisticNeurologyKota
 
Statistics for Medical students
Statistics for Medical studentsStatistics for Medical students
Statistics for Medical studentsANUSWARUM
 

Ähnlich wie Stat 4 the normal distribution & steps of testing hypothesis (20)

Stat 4 the normal distribution & steps of testing hypothesis
Stat 4 the normal distribution & steps of testing hypothesisStat 4 the normal distribution & steps of testing hypothesis
Stat 4 the normal distribution & steps of testing hypothesis
 
Inferential statistics-estimation
Inferential statistics-estimationInferential statistics-estimation
Inferential statistics-estimation
 
1.1 course notes inferential statistics
1.1 course notes inferential statistics1.1 course notes inferential statistics
1.1 course notes inferential statistics
 
Testing hypothesis
Testing hypothesisTesting hypothesis
Testing hypothesis
 
Chi2 Anova
Chi2 AnovaChi2 Anova
Chi2 Anova
 
Parametric tests seminar
Parametric tests seminarParametric tests seminar
Parametric tests seminar
 
Statistics
StatisticsStatistics
Statistics
 
Review & Hypothesis Testing
Review & Hypothesis TestingReview & Hypothesis Testing
Review & Hypothesis Testing
 
Statistical data handling
Statistical data handling Statistical data handling
Statistical data handling
 
FandTtests.ppt
FandTtests.pptFandTtests.ppt
FandTtests.ppt
 
Point Estimate, Confidence Interval, Hypotesis tests
Point Estimate, Confidence Interval, Hypotesis testsPoint Estimate, Confidence Interval, Hypotesis tests
Point Estimate, Confidence Interval, Hypotesis tests
 
Biostatistics
BiostatisticsBiostatistics
Biostatistics
 
RMH Concise Revision Guide - the Basics of EBM
RMH Concise Revision Guide -  the Basics of EBMRMH Concise Revision Guide -  the Basics of EBM
RMH Concise Revision Guide - the Basics of EBM
 
ChandanChakrabarty_1.pdf
ChandanChakrabarty_1.pdfChandanChakrabarty_1.pdf
ChandanChakrabarty_1.pdf
 
hypothesis.pptx
hypothesis.pptxhypothesis.pptx
hypothesis.pptx
 
Basics of biostatistic
Basics of biostatisticBasics of biostatistic
Basics of biostatistic
 
Statistics for Medical students
Statistics for Medical studentsStatistics for Medical students
Statistics for Medical students
 
lecture-2.ppt
lecture-2.pptlecture-2.ppt
lecture-2.ppt
 
Basic statistics
Basic statisticsBasic statistics
Basic statistics
 
Data analysis
Data analysis Data analysis
Data analysis
 

Mehr von Forensic Pathology (20)

Exercise 1 12 no solution
Exercise 1 12 no solutionExercise 1 12 no solution
Exercise 1 12 no solution
 
Writing a research protocol 2011
Writing a research protocol 2011Writing a research protocol 2011
Writing a research protocol 2011
 
Some statistical defenition
Some statistical defenitionSome statistical defenition
Some statistical defenition
 
Prac excises 3[1].5
Prac excises 3[1].5Prac excises 3[1].5
Prac excises 3[1].5
 
Analysis of variance
Analysis of varianceAnalysis of variance
Analysis of variance
 
Stat3 central tendency & dispersion
Stat3 central tendency & dispersionStat3 central tendency & dispersion
Stat3 central tendency & dispersion
 
Stat 2 data presentation2
Stat 2 data presentation2Stat 2 data presentation2
Stat 2 data presentation2
 
Correlation 3rd
Correlation 3rdCorrelation 3rd
Correlation 3rd
 
Pancreas 2
Pancreas 2Pancreas 2
Pancreas 2
 
Pancreas 1
Pancreas 1Pancreas 1
Pancreas 1
 
Liver 3
Liver 3Liver 3
Liver 3
 
Liver 2
Liver 2Liver 2
Liver 2
 
Liver 1
Liver 1Liver 1
Liver 1
 
The biliary tract
The biliary tractThe biliary tract
The biliary tract
 
Valvular heart diseases 4
Valvular heart diseases 4Valvular heart diseases 4
Valvular heart diseases 4
 
Ischemic heart diseases 2
Ischemic heart diseases 2Ischemic heart diseases 2
Ischemic heart diseases 2
 
Hypertensive hd, and cardiomyopathy 3
Hypertensive hd, and cardiomyopathy 3Hypertensive hd, and cardiomyopathy 3
Hypertensive hd, and cardiomyopathy 3
 
Congenital heart diseases 1
Congenital heart diseases 1Congenital heart diseases 1
Congenital heart diseases 1
 
Arteriosclerosis 6
Arteriosclerosis 6Arteriosclerosis 6
Arteriosclerosis 6
 
Aneurysms & dissection 7
Aneurysms & dissection 7Aneurysms & dissection 7
Aneurysms & dissection 7
 

Stat 4 the normal distribution & steps of testing hypothesis

  • 1. The Normal Distribution Also called Gaussean Distribution. Mean = Median = Mode. Skewness = zero & Kurtosis = zero. Total area under the curve = 1.
  • 2.
  • 4. The Normal Distribution, cont.  68% of observations lie between minus & plus one SD. ( -1Z & +1Z ).  95% of observations lie between minus 1.96 & plus 1.96 SD units.  99% of observations lie between minus 2.58 & plus 2.58 SD units.  99.7% of observations lie between minus 3 & plus 3 SD units.
  • 5. Confidence interval for a mean  The range with in which the population mean is likely to lie. s.d. 95% C.I. = X ± 1.96 √n s.d. 99% C.I. = X ± 2.58 √n
  • 6. Confidence interval for a mean If n ≤ 30 s.d. C.I. = X ± t √n
  • 7. Steps of testing the statistical hypothesis *Assumption We assume that our population(s) are normally distributed. *Hypothesis We put null hypothesis (Ho) & alternative hypothesis (HA).
  • 8. *Levels of significance (alpha) Alpha = the probability of rejecting a true null hypothesis. Usually alpha = 0.05 or 0.01 *Degrees of freedom (d.f.): Depends on the type of the statistical test. *The statistics Depends on type of data.
  • 9. *Statistical decision Whether to reject or not to reject Ho. *P value Whether < or > 0.05 (or whether P < or > 0.01)
  • 10. Tests of Statistical Significance Depending on the type of data, an appropriate test will be used. Generally speaking, Data are either numerical or categorical data.
  • 11. For Numerical data; we usually compute the mean & it’s standard deviation. • In order to test whether there is a significant difference between two means related to two different groups, we use the student (t) test. The t test is also used to compare between two sets of data within the same group ie. To compare between two readings for the same person but on two occasions, eg. Before & after treatment.
  • 12. *To compare between several means; we use the analysis of variance (ANOVA, or called the F test); & when we have several numerical variables & one of them is dependent on the others (independent variables) then we use the multiple regression.
  • 13. *In order to examine the nature & strength of the relationship between two variables ( e.g.. Blood pressure & age), simple linear regression & correlation tests are used. *The objective of regression analysis is to predict (estimate) the value of one variable corresponding to a given value of another variable.
  • 14. *Correlation analysis is concerned with measuring the strength of the relationship between variables.