SlideShare ist ein Scribd-Unternehmen logo
1 von 16
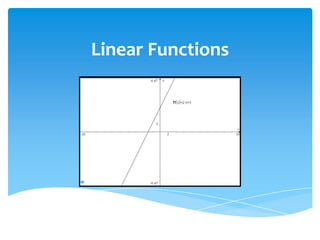
Linear Functions
Standard:  Ax + By = C Point Slope: y - y₁ = m(x-x₁) Slope-Intercept: y = mx + b Slope: m = 𝑦 −𝑦₁𝑥 −𝑥₁   Linear Function Expressions and Forms
Converting between Forms Standard to Slope-Intercept 	Ax + By = C By = -Ax + C y = −𝐴𝑥+𝐶𝐵 y = −𝐴𝑥𝐵 + C Let −𝐴𝐵 = m Let C = b y = mx + b   Point-Slope to Slope y - y₁ = m( x - x₁) 𝑦 −𝑦₁𝑥 −𝑥₁ = m m = 𝑦−𝑦₁𝑥−𝑥₁  
Graphing Linear FunctionsUsing Points Use two points ( x, y) and  ( x₁, y₁) Find these points on the graph For example: Let ( x, y) = ( 1, 2) and ( x₁, y₁) = ( 3, 4)
Graphing Linear FunctionsUsing points To find Slope Count 𝑹𝒊𝒔𝒆𝑹𝒖𝒏 on graph   Or Use point-slope form Y - y₁ = m( x - x₁) 2 - 4 = m( 1 - 3) 𝟐 −𝟒𝟏 −𝟑 = m m = −𝟐−𝟐 m = 1 Slope is 1  
Graph 3y – 9x = 3 First solve equation for y 3y – 9x = 3 3y + 9x – 9x = 3 + 9x 𝟏𝟑 ∙ 3y = 3 + 9x ∙ 𝟏𝟑 y = 1 + 3x y = 3x + 1 Equation is now in slope-intercept form   Graphing Linear FunctionsMaking a Table
Graphing Linear FunctionsMaking a Table Now select some values for domain Plug values into y = 3x + 1
Graphing Linear FunctionsMaking a Table Graph ordered pairs Draw line through points
Graphing Linear FunctionsUsing intercepts Find x-intercept of           7x + y = -4 Replace y with zero 7x + 0 = -4 𝟏𝟕 ∙ 7x + 0 = -4 ∙ 𝟏𝟕 x = −𝟒𝟕   Find y-intercept of          7x + y = -4 Replace x with zero 7(0) + y = -4 y = -4
Graphing Linear FunctionsUsing intercepts X-intercept is −𝟒𝟕 Line intersects x-axis at    ( −𝟒𝟕, 0) Y-intercept is -4 Line intersects y-axis at    ( 0, -4)  
Find Equation of Function Using GraphsSlope-Intercept Find where line intersects y-axis This value is b Find slope of line by 𝑹𝒊𝒔𝒆𝑹𝒖𝒏 This value is m y = mx + b  
Find Equation of Function Using GraphsPoint-Slope Plug given point into         ( x₁, y₁ ) y – 2 = m( x – 3) Find slope by 𝑹𝒊𝒔𝒆𝑹𝒖𝒏 in graph Plug slope into m y – 2 = 𝟏𝟐( x – 3)  
Parallel Linear Functions y = 𝟑𝟐 x + 1 y = 𝟑𝟐 x + 4 Are these functions parallel? Graph them They are parallel  
Perpendicular Linear Functions y = −𝟑𝟒x + 2 y = 𝟒𝟑 x + 3 Are these functions perpendicular? Graph them They are Perpendicular  
Parallel and Perpendicular Linear Functions Parallel Functions with equal slopes are parallel y = mx + b y = 𝟑𝟐 x + 1 y = 𝟑𝟐 x + 4 m = 𝟑𝟐   Perpendicular Functions with reciprocal slopes are perpendicular Y = mx + b Y = −𝟑𝟒 x + 2 Y = 𝟒𝟑 x + 3 M = −𝟑𝟒 and m = 𝟒𝟑  
TI-Nspire CAS Student Software, All TI-Nspire CAS Calculator images, September 22, 2010, Copy Righted Texas Instruments. Citations

Weitere ähnliche Inhalte

Was ist angesagt?

Absolute value functions
Absolute value functionsAbsolute value functions
Absolute value functionsJessica Garcia
 
Lecture 15 section 5.4 graph of sin & cos
Lecture 15   section 5.4 graph of sin & cosLecture 15   section 5.4 graph of sin & cos
Lecture 15 section 5.4 graph of sin & cosnjit-ronbrown
 
Graph of linear function
Graph of linear functionGraph of linear function
Graph of linear functionMartinGeraldine
 
Quadratics Final
Quadratics FinalQuadratics Final
Quadratics Finalpelican24
 
Apoyo guía-12-2°-medio-ppt.-parábola
Apoyo guía-12-2°-medio-ppt.-parábolaApoyo guía-12-2°-medio-ppt.-parábola
Apoyo guía-12-2°-medio-ppt.-parábolaliceo
 
Quadratic functions
Quadratic functionsQuadratic functions
Quadratic functionsAlexisGood1
 
2.6.1 Translations and Reflections
2.6.1 Translations and Reflections2.6.1 Translations and Reflections
2.6.1 Translations and Reflectionssmiller5
 
Lecture 16 graphing - section 4.3
Lecture 16   graphing - section 4.3Lecture 16   graphing - section 4.3
Lecture 16 graphing - section 4.3njit-ronbrown
 
IB Maths SL Transformations of functions
IB Maths SL Transformations of functionsIB Maths SL Transformations of functions
IB Maths SL Transformations of functionsestelav
 
Obj. 30 Reflections and Translations
Obj. 30 Reflections and TranslationsObj. 30 Reflections and Translations
Obj. 30 Reflections and Translationssmiller5
 
Coordinate geometr - Area under curve
Coordinate geometr - Area under curveCoordinate geometr - Area under curve
Coordinate geometr - Area under curve2IIM
 
Linear equations
Linear equationsLinear equations
Linear equationscathyguyer
 
Trigonometric graphs
Trigonometric graphsTrigonometric graphs
Trigonometric graphsShaun Wilson
 
Introduction to coordinate geometry
Introduction to coordinate geometryIntroduction to coordinate geometry
Introduction to coordinate geometryjoannahstevens
 
Ch 7 tutoring notes quadratics
Ch 7 tutoring notes quadraticsCh 7 tutoring notes quadratics
Ch 7 tutoring notes quadraticssrobbins4
 
2.8 Absolute Value Functions
2.8 Absolute Value Functions2.8 Absolute Value Functions
2.8 Absolute Value Functionshisema01
 
Horizontal Shifts of Quadratic Functions
Horizontal Shifts of Quadratic Functions Horizontal Shifts of Quadratic Functions
Horizontal Shifts of Quadratic Functions MarkBredin
 
rational expression
rational expressionrational expression
rational expressionrey castro
 
Drawing trigonometric graphs.
Drawing trigonometric graphs.Drawing trigonometric graphs.
Drawing trigonometric graphs.RoseBlakeney
 

Was ist angesagt? (20)

Absolute value functions
Absolute value functionsAbsolute value functions
Absolute value functions
 
Lecture 15 section 5.4 graph of sin & cos
Lecture 15   section 5.4 graph of sin & cosLecture 15   section 5.4 graph of sin & cos
Lecture 15 section 5.4 graph of sin & cos
 
Graph of linear function
Graph of linear functionGraph of linear function
Graph of linear function
 
Quadratics Final
Quadratics FinalQuadratics Final
Quadratics Final
 
Apoyo guía-12-2°-medio-ppt.-parábola
Apoyo guía-12-2°-medio-ppt.-parábolaApoyo guía-12-2°-medio-ppt.-parábola
Apoyo guía-12-2°-medio-ppt.-parábola
 
Quadratic functions
Quadratic functionsQuadratic functions
Quadratic functions
 
2.6.1 Translations and Reflections
2.6.1 Translations and Reflections2.6.1 Translations and Reflections
2.6.1 Translations and Reflections
 
Lecture 16 graphing - section 4.3
Lecture 16   graphing - section 4.3Lecture 16   graphing - section 4.3
Lecture 16 graphing - section 4.3
 
IB Maths SL Transformations of functions
IB Maths SL Transformations of functionsIB Maths SL Transformations of functions
IB Maths SL Transformations of functions
 
Obj. 30 Reflections and Translations
Obj. 30 Reflections and TranslationsObj. 30 Reflections and Translations
Obj. 30 Reflections and Translations
 
Coordinate geometr - Area under curve
Coordinate geometr - Area under curveCoordinate geometr - Area under curve
Coordinate geometr - Area under curve
 
Linear equations
Linear equationsLinear equations
Linear equations
 
Trigonometric graphs
Trigonometric graphsTrigonometric graphs
Trigonometric graphs
 
Introduction to coordinate geometry
Introduction to coordinate geometryIntroduction to coordinate geometry
Introduction to coordinate geometry
 
Ch 7 tutoring notes quadratics
Ch 7 tutoring notes quadraticsCh 7 tutoring notes quadratics
Ch 7 tutoring notes quadratics
 
2.8 Absolute Value Functions
2.8 Absolute Value Functions2.8 Absolute Value Functions
2.8 Absolute Value Functions
 
Horizontal Shifts of Quadratic Functions
Horizontal Shifts of Quadratic Functions Horizontal Shifts of Quadratic Functions
Horizontal Shifts of Quadratic Functions
 
Curve fitting
Curve fittingCurve fitting
Curve fitting
 
rational expression
rational expressionrational expression
rational expression
 
Drawing trigonometric graphs.
Drawing trigonometric graphs.Drawing trigonometric graphs.
Drawing trigonometric graphs.
 

Ähnlich wie Linear functions

WRITING AND GRAPHING LINEAR EQUATIONS 1.pptx
WRITING AND GRAPHING LINEAR EQUATIONS 1.pptxWRITING AND GRAPHING LINEAR EQUATIONS 1.pptx
WRITING AND GRAPHING LINEAR EQUATIONS 1.pptxKristenHathcock
 
February 18 2016
February 18 2016February 18 2016
February 18 2016khyps13
 
April 10, 2015
April 10, 2015April 10, 2015
April 10, 2015khyps13
 
02.21.2020 Algebra I Quadraic Functions.ppt
02.21.2020  Algebra I Quadraic Functions.ppt02.21.2020  Algebra I Quadraic Functions.ppt
02.21.2020 Algebra I Quadraic Functions.pptjannelewlawas
 
Graphing Quadratics
Graphing QuadraticsGraphing Quadratics
Graphing Quadraticsswartzje
 
April 9, 2015
April 9, 2015April 9, 2015
April 9, 2015khyps13
 
G9_Q2_W2_L2_GraphsofQUadraticFunction.pdf
G9_Q2_W2_L2_GraphsofQUadraticFunction.pdfG9_Q2_W2_L2_GraphsofQUadraticFunction.pdf
G9_Q2_W2_L2_GraphsofQUadraticFunction.pdfDaniloFrondaJr
 
Quadratic Equations Graphing
Quadratic Equations   GraphingQuadratic Equations   Graphing
Quadratic Equations Graphingkliegey524
 
Graphing quadratics
Graphing quadraticsGraphing quadratics
Graphing quadraticslothomas
 
Notes on 3.2 properties of linear frunction graphs
Notes on 3.2   properties of linear frunction graphsNotes on 3.2   properties of linear frunction graphs
Notes on 3.2 properties of linear frunction graphsjoannahstevens
 
Mathematics 8 Linear Functions
Mathematics 8 Linear FunctionsMathematics 8 Linear Functions
Mathematics 8 Linear FunctionsJuan Miguel Palero
 
20200830230859_PPT4-Lines, Parabolas and Systems.pptx
20200830230859_PPT4-Lines, Parabolas and Systems.pptx20200830230859_PPT4-Lines, Parabolas and Systems.pptx
20200830230859_PPT4-Lines, Parabolas and Systems.pptxConanEdogawaShinichi
 
PPT (01-13-21).pptx
PPT (01-13-21).pptxPPT (01-13-21).pptx
PPT (01-13-21).pptxSeanCulla
 
Graphing quadratic equations
Graphing quadratic equationsGraphing quadratic equations
Graphing quadratic equationsswartzje
 

Ähnlich wie Linear functions (20)

WRITING AND GRAPHING LINEAR EQUATIONS 1.pptx
WRITING AND GRAPHING LINEAR EQUATIONS 1.pptxWRITING AND GRAPHING LINEAR EQUATIONS 1.pptx
WRITING AND GRAPHING LINEAR EQUATIONS 1.pptx
 
February 18 2016
February 18 2016February 18 2016
February 18 2016
 
Graphs Of Equations
Graphs Of EquationsGraphs Of Equations
Graphs Of Equations
 
identities1.2
identities1.2identities1.2
identities1.2
 
April 10, 2015
April 10, 2015April 10, 2015
April 10, 2015
 
02.21.2020 Algebra I Quadraic Functions.ppt
02.21.2020  Algebra I Quadraic Functions.ppt02.21.2020  Algebra I Quadraic Functions.ppt
02.21.2020 Algebra I Quadraic Functions.ppt
 
Graphing Quadratics
Graphing QuadraticsGraphing Quadratics
Graphing Quadratics
 
April 9, 2015
April 9, 2015April 9, 2015
April 9, 2015
 
G9_Q2_W2_L2_GraphsofQUadraticFunction.pdf
G9_Q2_W2_L2_GraphsofQUadraticFunction.pdfG9_Q2_W2_L2_GraphsofQUadraticFunction.pdf
G9_Q2_W2_L2_GraphsofQUadraticFunction.pdf
 
Quadratic Equations Graphing
Quadratic Equations   GraphingQuadratic Equations   Graphing
Quadratic Equations Graphing
 
Graphing quadratics
Graphing quadraticsGraphing quadratics
Graphing quadratics
 
Functions
FunctionsFunctions
Functions
 
Notes on 3.2 properties of linear frunction graphs
Notes on 3.2   properties of linear frunction graphsNotes on 3.2   properties of linear frunction graphs
Notes on 3.2 properties of linear frunction graphs
 
Mathematics 8 Linear Functions
Mathematics 8 Linear FunctionsMathematics 8 Linear Functions
Mathematics 8 Linear Functions
 
20200830230859_PPT4-Lines, Parabolas and Systems.pptx
20200830230859_PPT4-Lines, Parabolas and Systems.pptx20200830230859_PPT4-Lines, Parabolas and Systems.pptx
20200830230859_PPT4-Lines, Parabolas and Systems.pptx
 
PPT (01-13-21).pptx
PPT (01-13-21).pptxPPT (01-13-21).pptx
PPT (01-13-21).pptx
 
1538 graphs & linear equations
1538 graphs & linear equations1538 graphs & linear equations
1538 graphs & linear equations
 
Graphing quadratic equations
Graphing quadratic equationsGraphing quadratic equations
Graphing quadratic equations
 
คาบ2 2
คาบ2 2คาบ2 2
คาบ2 2
 
Line and its slope
Line and its slopeLine and its slope
Line and its slope
 

Linear functions

  • 2. Standard: Ax + By = C Point Slope: y - y₁ = m(x-x₁) Slope-Intercept: y = mx + b Slope: m = 𝑦 −𝑦₁𝑥 −𝑥₁   Linear Function Expressions and Forms
  • 3. Converting between Forms Standard to Slope-Intercept Ax + By = C By = -Ax + C y = −𝐴𝑥+𝐶𝐵 y = −𝐴𝑥𝐵 + C Let −𝐴𝐵 = m Let C = b y = mx + b   Point-Slope to Slope y - y₁ = m( x - x₁) 𝑦 −𝑦₁𝑥 −𝑥₁ = m m = 𝑦−𝑦₁𝑥−𝑥₁  
  • 4. Graphing Linear FunctionsUsing Points Use two points ( x, y) and ( x₁, y₁) Find these points on the graph For example: Let ( x, y) = ( 1, 2) and ( x₁, y₁) = ( 3, 4)
  • 5. Graphing Linear FunctionsUsing points To find Slope Count 𝑹𝒊𝒔𝒆𝑹𝒖𝒏 on graph   Or Use point-slope form Y - y₁ = m( x - x₁) 2 - 4 = m( 1 - 3) 𝟐 −𝟒𝟏 −𝟑 = m m = −𝟐−𝟐 m = 1 Slope is 1  
  • 6. Graph 3y – 9x = 3 First solve equation for y 3y – 9x = 3 3y + 9x – 9x = 3 + 9x 𝟏𝟑 ∙ 3y = 3 + 9x ∙ 𝟏𝟑 y = 1 + 3x y = 3x + 1 Equation is now in slope-intercept form   Graphing Linear FunctionsMaking a Table
  • 7. Graphing Linear FunctionsMaking a Table Now select some values for domain Plug values into y = 3x + 1
  • 8. Graphing Linear FunctionsMaking a Table Graph ordered pairs Draw line through points
  • 9. Graphing Linear FunctionsUsing intercepts Find x-intercept of 7x + y = -4 Replace y with zero 7x + 0 = -4 𝟏𝟕 ∙ 7x + 0 = -4 ∙ 𝟏𝟕 x = −𝟒𝟕   Find y-intercept of 7x + y = -4 Replace x with zero 7(0) + y = -4 y = -4
  • 10. Graphing Linear FunctionsUsing intercepts X-intercept is −𝟒𝟕 Line intersects x-axis at ( −𝟒𝟕, 0) Y-intercept is -4 Line intersects y-axis at ( 0, -4)  
  • 11. Find Equation of Function Using GraphsSlope-Intercept Find where line intersects y-axis This value is b Find slope of line by 𝑹𝒊𝒔𝒆𝑹𝒖𝒏 This value is m y = mx + b  
  • 12. Find Equation of Function Using GraphsPoint-Slope Plug given point into ( x₁, y₁ ) y – 2 = m( x – 3) Find slope by 𝑹𝒊𝒔𝒆𝑹𝒖𝒏 in graph Plug slope into m y – 2 = 𝟏𝟐( x – 3)  
  • 13. Parallel Linear Functions y = 𝟑𝟐 x + 1 y = 𝟑𝟐 x + 4 Are these functions parallel? Graph them They are parallel  
  • 14. Perpendicular Linear Functions y = −𝟑𝟒x + 2 y = 𝟒𝟑 x + 3 Are these functions perpendicular? Graph them They are Perpendicular  
  • 15. Parallel and Perpendicular Linear Functions Parallel Functions with equal slopes are parallel y = mx + b y = 𝟑𝟐 x + 1 y = 𝟑𝟐 x + 4 m = 𝟑𝟐   Perpendicular Functions with reciprocal slopes are perpendicular Y = mx + b Y = −𝟑𝟒 x + 2 Y = 𝟒𝟑 x + 3 M = −𝟑𝟒 and m = 𝟒𝟑  
  • 16. TI-Nspire CAS Student Software, All TI-Nspire CAS Calculator images, September 22, 2010, Copy Righted Texas Instruments. Citations