SlideShare ist ein Scribd-Unternehmen logo
1 von 12
Downloaden Sie, um offline zu lesen
Journal of Structural Geology 27 (2005) 2159–2170
                                                                                                                            www.elsevier.com/locate/jsg


The development of subgrain misorientations with strain in dry synthetic
                    NaCl measured using EBSD
                                            G.M. Pennock*, M.R. Drury, C.J. Spiers
                             Faculty of Geosciences, Utrecht University, Postbus 80.021, 3508 TA Utrecht, The Netherlands

                                Received 7 February 2005; received in revised form 3 June 2005; accepted 29 June 2005
                                                        Available online 13 September 2005


Abstract
   The development of subgrain boundary misorientations with strain in dry, synthetic NaCl polycrystals, deformed at elevated temperature,
has been investigated using electron backscattered diffraction (EBSD). At low natural strains, up to 0.5, average misorientations of subgrain
boundaries increase with strain and a power law relationship exists between strain and average misorientations. The average misorientations
are strongly influenced by grain orientation, suggesting that the misorientation–strain relationship may also be texture dependent in materials
with high plastic anisotropy, like NaCl. A slight grain size dependency of the average misorientations was observed. The results indicate that
with suitable calibration, average subgrain boundary misorientations may offer a method for estimating the strain accommodated by
dislocation creep in NaCl and thus perhaps in other geological materials, although current theories for polycrystalline plasticity imply that
misorientations may also depend on stress in some situations.
q 2005 Elsevier Ltd. All rights reserved.

Keywords: Dry NaCl; Subgrain; Misorientation; Strain; Grain size; EBSD


1. Introduction                                                               dislocation creep has occurred, only small strains are needed
                                                                              to produce a high density of free dislocations, and subgrains
   The rheological behaviour of naturally deformed rocks is                   form by 0.10 strain (Carter and Heard, 1970). This means
generally controlled by several different mechanisms that                     that other less easily recognized processes, such as pressure
can operate simultaneously or consecutively and can affect                    solution creep (Spiers et al., 1990) or crack seal mechanisms
the microstructure. Estimating strain from microstructures                    may also have contributed to grain elongation processes and
can therefore be difficult, especially when more than one                      together with phenomena such as grain boundary sliding,
deformation mechanism is operative (Passchier and Trouw,                      may even be the major contributor to the bulk strain during
1996). For instance, deformation at temperatures in the                       deformation. The same argument applies equally to other
range 100–200 8C of synthetic NaCl, dried to contain only a                   rock types, such as quartz tectonites (Mitra, 1976; Harrison
few ppm of water, is dominated by dislocation creep and                       and Onasch, 2000).
microstructures contain elongated grains and subgrains                           As the presence of subgrains is sufficient only for
(Trimby et al., 2000; Watanabe and Peach, 2002; Ter Heege                     establishing that dislocation activity has occurred, quantify-
et al., 2005). When water is present, microstructures are                     ing any systematic trends in subgrain development with
dominated by grain boundary migration recrystallization                       strain in a given material may be useful for establishing a
(Spiers et al., 1986; Urai et al., 1986) but elongated grains,                strain gauge for dislocation creep deformation, as well as
subgrains and free dislocations may still be present (Spiers                  providing insight into the role of subgrain rotation in
and Carter, 1998). Although these microstructures show that                   dynamic recrystallization (Pennock et al., 2004). One
                                                                              potential method of assessing dislocation creep strain is to
 * Corresponding author. Tel.: C31 30 2535109; fax: C31 30 2537725.           measure how the subgrain misorientation angle increases
   E-mail address: gpennock@geo.uu.nl (G.M. Pennock).                         with strain. A small number of misorientations have been
0191-8141/$ - see front matter q 2005 Elsevier Ltd. All rights reserved.      measured in various deformed materials using both light
doi:10.1016/j.jsg.2005.06.013                                                                          ´
                                                                              microscopy (LM) (Ave Lallement, 1985) and transmission
2160                             G.M. Pennock et al. / Journal of Structural Geology 27 (2005) 2159–2170

electron microscopy (TEM) (Hughes et al., 1997). More                  2. Materials and methods
recently, many more subgrain misorientations have been
measured with EBSD mapping in metals and NaCl (Randle
                                                                       2.1. Sample preparation
and Engler, 2000; Humphreys, 2001; Pennock et al., 2002;
Hurley and Humphreys, 2003; Pennock and Drury, 2005).
                                                                          Cylinders, 3 cm in diameter, were prepared from
The average misorientation of subgrain boundaries, qav, is
frequently reported to show a power law relationship with              synthetic NaCl by cold pressing and annealing to a final
strain, 3, of the form:                                                density of w99.5% (Peach and Spiers, 1996; Ter Heege,
                                                                       2002). To minimize the occurrence of grain boundary
                                                                       migration recrystallization (Trimby et al., 2000) samples
qav f 3n                                                     (1)       were dried in flowing argon, mostly to a water content of
                                                                       5G2 ppm (Watanabe and Peach, 2002) (Table 1). This
where nZ4–6, depending on the type of subgrain boundary                procedure gave initial average grain sizes ranging from 300
(Hughes et al., 1997; Pennock et al., 2002; Pennock and                to 400 mm, although variations in the drying sequence
Drury, 2005).                                                          resulted in some variations in grain size between batches.
   Using EBSD, Pennock et al. (2002) and Pennock and                   The cylinders were deformed in axi-symmetric compression
Drury (2005) showed that individual subgrains in dry                   using a triaxial testing machine under a confining pressure
synthetic NaCl deformed in the dislocation creep regime                of 50 MPa at 165G10 8C (w0.4 Tm) and at constant
were surrounded by segments of subgrain boundaries with a              displacement rate, equivalent to a final strain rate of w6!
wide range of misorientations. Subgrain boundaries were                10K7 sK1 (Peach and Spiers, 1996; Ter Heege, 2002; Ter
separated into three types, depending on the boundary                  Heege et al., 2005). Under these conditions dry NaCl does
misorientation and spatial distribution. Equiaxed subgrain             not undergo dynamic recrystallization by grain boundary
boundaries were ubiquitous, and generally had lower                    migration and continues to work harden (Ter Heege et al.,
misorientations, whereas long straight subgrain boundaries             2005). The samples deformed relatively homogeneously,
had higher misorientations and extended between several                although there was some minor barrelling at higher strains.
subgrains: extended subgrains were often associated with               Final natural strains ranged from 0.07 to 0.54 (Fig. 1). The
either triple points or dissected grains. A weak core–mantle           0.15 strain sample (PK119a) showed lower stress values,
development of subgrains and subgrain boundaries was also              related to the slightly higher water content of this sample
noted. The formation of new grains by subgrain rotation                (11 ppm). Samples were cooled to room temperature
recrystallization was limited in these materials at strains of         (approximately 1.5 8C/min) and sectioned soon after
0.5 (Pennock et al., 2004).                                            deformation; sections were made of the central portion of
   Many variables, including strain, influence subgrain                 the cylinder, parallel to the compression direction, and
development and may influence misorientation values,                    polished in a dry room (Urai et al., 1987). All sections were
such as deformation conditions (confining pressure,                     lightly etched for 10 s, either in saturated salt solution
temperature and strain rate), material properties (grain               containing ferric chloride, or in methanol, and finally
orientation, neighbouring grain orientation, grain size and            washed with either hexane or ether.
fluid content). The angular resolution of the technique
used to measure misorientations (LM, TEM, EBSD) may
also influence the range of misorientations that can be
measured. Pennock et al. (2002) found that EBSD
mapping variables, such as ‘noise’ caused by angular
resolution limits, step size, processing of non-indexed
pixels and filtering data to remove noise (Pennock and
Drury, 2005), all influenced average misorientation
values in NaCl, particularly using etched NaCl samples.
However, the average misorientation parameter may still
provide useful data on the state of a material, including
the dislocation creep strain magnitude, depending on the
scatter in the data produced by other effects and on
whether the qav versus 3 relationship is reproducible for
all EBSD systems (Pennock and Drury, 2005). This
paper examines the effect strain, grain orientation, texture
and grain size have on the average misorientation values,
with the aim of assessing the potential of qav versus 3
relationships for estimating dislocation creep strain in               Fig. 1. Stress–strain curves for deformed NaCl (see Table 1, unsmoothed
geological materials.                                                  data, corrected for change in area and specimen length).
G.M. Pennock et al. / Journal of Structural Geology 27 (2005) 2159–2170                                    2161

Table 1
Information on samples used in deformation experiments

Sample                  Drying procedure                                                Water (ppm)             Grain sizea (mm)   Natural strain
PK67                    0.2 8C/min to 350 8C/16 h; 0.2 8C/min to 530 8C/68 h            –                       310                Undeformed
PK67h                   As for PK67                                                         3                                      0.28
PK67m                   As for PK67                                                         6                                      0.54
PK73                    1.5 8C/min to 560 8C/25 h                                       –                       126                Undeformed
PK73a                   As for PK73                                                       7                                        0.5
PK119b                  2 8C/min to 700 8C/1 h; 0.5 8C/min to 530 8C/44 h                 7                     329                0.07
PK119a                  As for PK119a                                                   11b                     412                0.15
 a
     Grain sizes of undeformed material were determined using linear intercept of at least 100 grains from light micrographs.
 b
     Argon gas ran out during drying.

2.2. Microscopy and EBSD                                                          was often not possible and these boundaries were not
                                                                                  included in the average misorientation calculation. In many
   The microstructures of deformed and undeformed                                 instances, segments of the subgrain boundary developed
material were examined using LM and orientation contrast                          misorientations O168, and these were included in the
in the scanning electron microscopy (SEM). Conditions                             calculation of average misorientations, as the boundary
used for EBSD mapping NaCl, 12 kV, 2 nA, were mostly                              segments did not completely surround a region to form a
the same as in previous work (Pennock et al., 2002; Pennock                       new grain. The arithmetic average of the grain average
and Drury, 2005). EBSD data were collected and analysed                           distributions, qav-grains, was determined for each strain.
using HKL Channel 5 software and either a Philips XL30                            Frequency distributions based on grain averages gave a
SEM with a SIT camera, or a Philips XL30 SFEG SEM and                             good insight into the standard deviations and spread of
a Nordlys CCD camera.                                                             average misorientations on a grain basis for a given strain.
   In all EBSD work, a 4 mm step was used to determine                            With knowledge of the standard errors, it was possible to
misorientations of subgrains, which gave a reasonable                             assess the influence of grain size on average misorientation
representation of the subgrain microstructures (average                           values.
subgrain size 12 mm) and misorientations; smaller step sizes
required more time to comprehensively map grain mis-
orientations and increased the relative number of non-                            3. Results
indexed pixels along etched boundaries, whereas large step
sizes cumulated orientations across several subgrains                             3.1. Microstructure
(Pennock et al., 2002). Smaller step sizes of 1–3 mm were
used to examine details of subgrain microstructures.                                 The undeformed material (Table 1) contained mostly
   The quality of the EBSD maps was good, as subgrain                             polygonal recrystallized grains and the occasional square-
misorientations of 0.58 were resolved and showed good                             shaped grain (Fig. 2a). One batch had a slightly lower
correlation with etched microstructures (Pennock and                              original grain size of 126G12 mm (PK73). A few grains
Drury, 2005). Maps were filtered to remove orientation                             contained subgrains with low misorientations, !28,
noise using VMAP (in-house software, courtesy of F.J.                             measured with EBSD. Sometimes larger grains contained
Humphreys, Manchester University) (Humphreys et al.,                              remnant internal grains; the volume fraction of these grains
2001). Filtering removed many of the low misorientations                          was quite small, up to about 1% of the area in the 0.07
caused by orientation noise and poor pattern quality along                        strained sample.
boundaries. Filtering to remove low angle misorientations                            In the deformed samples grains became flattened with
caused by noise allowed resolution of misorientations to                          increasing strain and most grain boundaries remained
better than 0.58 and gave a good representation of the etched                     smooth (Fig. 2b). Boundaries were preferentially etched
microstructures. All EBSD maps are shown after filtering.                          and some porosity, mostly inter-granular, was observed,
   The frequency distribution of subgrain boundary length                         especially after cleaning samples with ether. There was
per unit area as a function of misorientation angle was                           evidence for a small amount of slow grain boundary
determined from nearest neighbour pixel misorientations                           migration in deformed samples in the form of micron-scale
after replacing most non-indexed pixels with an average of                        grain boundary serrations, which occurred at the intersec-
nearest neighbour pixel orientations. The average misor-                          tion of subgrains with grain boundaries throughout materials
ientations of subgrains O0.58 of individual grains were also                      with higher water contents (PK119a). All samples contained
calculated. At higher strains of about 0.5, a few subgrain                        subgrains, although a few grains in each sample, usually
boundaries completely enclosed regions to create new                              with a grain size less than 100 mm, contained relatively few
grains with grain boundary misorientations O168. Dis-                             subgrains.
tinguishing these boundaries from original grain boundaries                          Qualitative assessment of the subgrain boundary
2162                                   G.M. Pennock et al. / Journal of Structural Geology 27 (2005) 2159–2170


Fig. 2. Light micrographs showing typical grain shapes of: (a) undeformed (PK73) and (b) deformed material (PK73a). Arrow shows remnant, internal grains.

misorientations in EBSD mapped microstructures (Fig. 3                          The log–frequency distribution clearly shows that the
shows typical details as a function of strain) showed that                      majority of subgrain boundary misorientations have low
there was considerable variation in the subgrain misorienta-                    misorientations !58 even at strains of about 0.5.
tions, both within individual grains and between grains.                           Many extended subgrain boundaries were associated
Individual segments of subgrain boundaries differed                             with triple junctions at all strains, others occurred in grains
significantly in misorientation and it was unusual for an                        that split into widely differing orientations, often with a
individual subgrain to be surrounded by misorientations O                       banded appearance. Grains, containing predominantly
58 at strains of 0.5. The micrographs show that equiaxed                        equiaxed or both equiaxed and extended subgrain bound-
subgrains were ubiquitous at all strains and generally                          aries, were selected (Table 2). The grains containing
surrounded by boundaries with very low misorientations !                        extended subgrain boundaries were generally oriented
28; at strains of 0.28 and above a marked preferential                          with h110i crystal axes at a high angle to the compression
alignment of these subgrain boundaries at about 458 to the                      axis (see Table 2). As an individual grain orientation spread
compression axis was visible. In some grains extended                           out with increasing strains, the original orientation was
subgrain boundaries (arrowed in Fig. 3) formed that were                        difficult to define. Extended subgrain boundaries did not
longer than the equiaxed subgrain size.                                         generally surround individual subgrains, although corner
   At the lowest strain, 0.07 (Fig. 3a), many of the subgrains                  sections of original grains were nearly ‘cut-off’ by high
were not completely enclosed by boundaries of O0.58                             angle subgrain boundaries at higher strains. At higher
misorientation, i.e. many subgrain boundaries had misor-                        strains, 0.5, some of the extended subgrain boundaries
ientations !0.58. Extended subgrain boundaries developed                        developed much smaller subgrains along their boundaries
at 0.07 strain with misorientations of 2–58 and some triple                     (Fig. 3d) many of which were smaller than the 4 mm step
junctions showed extended subgrain boundaries with                              size used to map the average misorientations. Very
misorientations as high as 5–108. A few grains (e.g. middle                     occasionally, these small subgrains reached sufficient
of lower grain, Fig. 3a) showed high misorientation                             misorientation to form small new subgrains.
boundaries in the central portion of the grain, which, by
analogy with other microstructures, are thought to be                           3.2. Average angular misorientations
associated with triple junctions of internal, or island, grains
located beneath the mapped surface. At 0.15 strain (Fig. 3b)                       The average misorientation values of selected grains
subgrains with boundary misorientations 0.5–28 were                             after 0.54 strain (PK67m) are also shown in Table 2. Grains
ubiquitous. These subgrain boundaries tended to surround                        containing extended subgrain boundaries in addition to the
equiaxed shaped subgrains. Extended subgrain boundaries                         equiaxed subgrain boundary types showed up to 18 variation
showed an increase in misorientations to greater than 58. At                    in average misorientation and had higher average mis-
0.28 strain, (Fig. 3c) the majority of subgrains were                           orientations than grains in which extended subgrain
surrounded by boundaries with misorientations of at least                       boundaries were absent. The grains containing extended
2–58, and many extended subgrain boundaries reached 5–                          subgrain boundaries represented at least 37% of the mapped
108. At 0.5 strain (Fig. 3d) sections of extended boundaries                    area.
had developed misorientations greater than 108 but the                             Inverse pole figures (IPFs) for the compression axis
majority of equiaxed subgrain boundary misorientations                          obtained from EBSD maps of nearby locations in sample
remained less than 58. These trends in subgrain boundary                        PK67m (0.54 strain) are shown in Fig. 5. Each map showed
misorientations development with strain are shown in Fig. 4.                    differences in texture and average misorientation values; in
G.M. Pennock et al. / Journal of Structural Geology 27 (2005) 2159–2170                                        2163


Fig. 3. EBSD micrographs of deformed material for strains: (a) 0.07, (b) 0.15, (c) 0.28 and (d) 0.5 (samples PK119b, 119a, 67h and 73a, respectively). Changes
in orientation with respect to the compression axis (vertical) are shown in colour. Arrows show extended subgrain boundaries, which are often associated with
high misorientations, as shown by change in colour within individual grains. In (d), smaller subgrains along extended subgrain boundaries are also arrowed.
More subgrain detail is visible in (d) because the EBSD map was made with a 2 mm step size compared with a 4 mm step used in to (a)–(c).


general, a map with a single h101i fibre texture (Fig. 5c) had                     general, areas with h111i, h100i and h115i fibres oriented
a lower average misorientation. The differences in average                        approximately parallel to the compression axis had higher
misorientation as a function of fibre texture subsets are                          average misorientation than areas oriented with h120i or
given in Table 3 for two samples (PK73a and PK67m). In                            h110i, although this trend was not so strong in sample
2164                                     G.M. Pennock et al. / Journal of Structural Geology 27 (2005) 2159–2170

                                                                               Table 3
                                                                               Average misorientations for different fibre textures in samples PK73a and
                                                                               PK67m. Fibre textures were made by selecting specific poles to be parallel,
                                                                               within 88 deviation, to the compression direction (4 mm step, unfiltered
                                                                               data, SIT camera system)

                                                                               Fibre texture             Average misorientation 8 (% data points)
                                                                                                         Grain size 310 mm         Grain size 126 mm
                                                                                                         (PK67m)                   (PK73a)
                                                                               111                       1.70 (0.2)                1.72 (0.8)
                                                                               100                       1.50 (1.0)                1.83 (1.9)
                                                                               115                       1.56 (7.9)                1.81 (10)
                                                                               120                       1.33 (36.5)               1.75 (27.4)
                                                                               110                       1.37 (19.1)               1.73 (13.7)
                                                                               Complete map              1.92                      2.27


                                                                               grain size. Average misorientations for samples of a similar
                                                                               grain size followed a power law relationship of the form:
Fig. 4. Log–frequency distribution is shown for subgrain misorientations at
different strains. Higher angle misorientations increase in frequency with     qavÿgrains Z k1 3n                                                    (2)
strain, although the majority of misorientations remain less than 58. Sample
PK73a (strain 0.5) had a smaller initial grain size compared with other        where 3 is the true strain, k1 is a constant with a value of 3.38
samples and shows a greater frequency of higher angle misorientations (SIT
                                                                               and n, the power exponent, has a value of 0.42. Analysing
camera system, 4 mm step, unfiltered).
                                                                               the subgrain misorientation on a grain basis rather than on a
                                                                               map as a whole, and including all subgrain boundary
PK73a. Table 3 shows that the smaller grain size material
                                                                               misorientations, gives a slightly different result to earlier
(PK73a), 126 mm, had higher average misorientation values
                                                                               work in which EBSD maps as a whole were analysed in the
than the 310 mm (PK67m) grain size material deformed to                        angular range 0.5–168 (k1 was found to have a value of 3.18
approximately the same strain.                                                 and n was 0.41) (Pennock and Drury, 2005). Therefore, it is
    The frequency distribution of average misorientations of                   important to use a similar analysis technique for etched
individual grains is shown in Fig. 6. As strain increased                      NaCl when comparing data. Grain analysis is more time
average misorientations of grains both increased and had a                     consuming, but is the better technique and provides
wider range of values. The average misorientations of these                    information about errors and about the spread in orientation
distributions, qav-grains, which included all subgrain bound-                  with strain of grains.
ary misorientations O0.58, are also given. These values are                       Sample PK73a, which had an original grain size of
slightly larger at each strain than the qav values derived from                126 mm and was strained to 0.5, showed a slightly higher
misorientations in the range 0.5–168 (Pennock and Drury,                       average misorientation value compared with PK67m
2005). Average misorientations based on grains, qav-grains,                    (original grain size 310 mm, strain 0.54). In order to
are plotted for each strain in Fig. 7. Average misorientations                 determine whether this difference was significant, the
increased with strain, although the rate of increase                           average misorientation for PK67m was calculated for a
decreased at higher strains in samples with similar initial                    strain of 0.5 using the appropriate values for the power law
Table 2
Average misorientations for selected grains and for the complete EBSD map (PK67m). The types of subgrain boundaries present and the approximate
orientation of the grain with respect to the compression axis are given (0.54 strain, 4 mm step, unfiltered data, SIT camera system)

Subgrain boundary type                   Average misorientation 0.5–!168       Approximate orientation huvwi           % Data points
Complete map                             1.92                                                                          100
ExtendedCequiaxed                        1.74                                        115                                 3
                                         1.94                                        115                                 2
                                         2.64                                        115                                 1
                                         2.28                                        115                                 7
                                         1.83                                        115                                 3
                                         2.04                                        115                                 4
                                         1.76                                        441                                 1
                                         1.77                                        415                                16
Equiaxed                                 1.42                                        110                                 5
                                         1.44                                        441                                 2
                                         1.35                                  Close 110                                 2
                                         1.34                                  Close 110                                 2
                                         1.34                                  Close 110                                 3
G.M. Pennock et al. / Journal of Structural Geology 27 (2005) 2159–2170                                           2165


Fig. 5. Inverse pole figures for the compression axis direction, showing differences in texture between EBSD maps taken from nearby locations in the central
portion of a deformed sample (PK67m). The number of grains mapped and the average misorientations for each map are also given. The strength of the h101i
pole and the presence of other poles orientated away from h101i influence the average misorientation. Slightly lower misorientations are seen in maps with a
single h101i maximum (contoured as multiples of uniform density, half width 108, cluster size 58).

relationship based on the grain averages (nZ0.42 and k1Z                            2000), the samples in this study were dried to very low water
3.38) to give 2.46G0.118. This is slightly smaller than the                         contents of a few ppm. The grain serrations and equant
value of 2.71G0.118 for PK73a (see Fig. 7).                                         grains, which contained relatively few subgrains, suggest
                                                                                    that a few regions underwent dynamic recrystallization by
                                                                                    rapid grain boundary migration, probably assisted by
4. Discussion                                                                       localized pockets of water. However, the volume fraction
                                                                                    of these grains was !1% and generally not included in
   The main objectives of this work have been to examine                            EBSD maps used to calculate the average misorientations.
the effect that strain, grain orientation, texture and grain size                      While samples were quenched from the deformation
have on the average misorientation values in dry NaCl. The                          temperature at a practical rate, the cooling rates were
quality and processing of EBSD maps is briefly discussed,                            relatively slow compared with rapid quenches used for
as these influence misorientation values. First, the micro-                          unconfined deformation. Microstructures are therefore
structures are summarized.                                                          likely to have been fully recovered so that subgrain
   As the presence of very small amounts of water assist                            misorientations were probably slightly higher than at
rapid grain boundary migration (Watanabe and Peach,                                 deformation temperatures. Nevertheless, misorientation–
2002) and removes subgrain misorientations (Trimby et al.,                          strain behaviour of NaCl shows a similar trend to that found


Fig. 6. Frequency distribution of grain average misorientations for different strains, 3. Averages of these distributions, qav-grains, and standard errors at 90%
confidence for about 80 grains, are shown.
2166                                      G.M. Pennock et al. / Journal of Structural Geology 27 (2005) 2159–2170

                                                                                 cause differences in average misorientation between
                                                                                 samples or sub-areas and are likely to cause the spread in
                                                                                 average misorientation values observed for EBSD maps
                                                                                 from areas containing only 10s of grains (Fig. 5 and
                                                                                 Table 2). Misorientations from at least 80 grains are needed
                                                                                 to determine a representative average misorientation value
                                                                                 for a particular material state of strain or recrystallization.
                                                                                 Furthermore, the step size used to map subgrain micro-
                                                                                 structures should be small enough so that individual
                                                                                 subgrain boundaries are measured (Pennock et al., 2002).
                                                                                 Obtaining accurate values of the average misorientation is
                                                                                 therefore demanding on EBSD mapping times, particularly
                                                                                 for larger grain size materials requiring small step mapping.
                                                                                 Further work is needed on duplicate samples to assess the
                                                                                 sample to sample variation.
Fig. 7. Average misorientation of grain averages, qav-grains, as a function of      EBSD mapping of etched NaCl contains more artefact
strain. Average misorientation increases with strain. A power law                misorientations along boundaries than found in other
relationship trend line is shown, excluding sample PK73a, which had a            materials, because of the etch topography. The EBSD
smaller original grain sizes than other samples. The average misorientation
                                                                                 camera system used to map misorientations was found to
value for sample PK67m is also shown adjusted to a strain of 0.5
(misorientation range O0.58, CCD camera, at least 80 grains, 4 mm step           affect average misorientation values and filtering maps
maps).                                                                           increased misorientations (Pennock and Drury, 2005).
                                                                                 These differences were explained in terms of the percentage
for deformed metals (Hughes, 2002), which are generally                          of non-indexed pixels present in the maps and were not so
rapidly cooled to retain the deformation microstructures.                        pronounced in other materials in which subgrain boundaries
Furthermore, slower cooling rates are more likely to occur                       were not etched (Hurley and Humphreys, 2002). An
in naturally deformed rocks.                                                     improved polishing method for NaCl should improve the
   Deformation of dry NaCl at 0.4 Tm resulted in subgrain                        map quality and reduce the differences in average
formation even at very low strains of 0.07. The types of                         misorientation values caused by noise reduction and
subgrain boundaries present, equiaxed and extended, were                         filtering to reduce noise.
similar to those reported for h100i single crystal experiments                      In material deformed to strains of at least 0.15, many
on NaCl (Raj and Pharr, 1989) and in cold (0.3 Tm) and hot                       subgrain misorientations were above the angular
(O0.5 Tm) worked aluminium and some aluminium alloys                             resolution limit of 0.58 and average misorientation values
(Humphreys and Drury, 1986; Delannay et al., 2001;                               based on misorientations O0.58 were representative.
Barnett and Montheillet, 2002; Hurley and Humphreys,                             However, after very low strain deformation (!0.07)
2003).                                                                           proportionally more misorientations were present that
   As extended subgrain boundaries tended to form in                             were below the angular resolution limit for EBSD. Average
grains that did not have h110i parallel to the compression                       misorientation values at low strains were therefore slightly
axis, grain orientation is likely to be an important factor in                   overestimated. For similar reasons, the average misorienta-
determining the type of subgrain boundary and average                            tion of the undeformed material was far higher than
misorientation of a grain. However, extended subgrain                            expected (Fig. 7). For this reason, the trend lines used to
boundaries often formed across only part of a grain,                             fit the qav-grains versus 3 data were calculated using the data
implying that surrounding grain orientation also influenced                       for the 0.07–0.54 strained samples and the undeformed
the microstructure. This was most pronounced at triple                           average misorientation value was rejected. The expected
junctions where the constraints of surrounding grains were                       trend would be for the undeformed average misorientation
the greatest.                                                                    to go through zero and a power law relationship satisfies this
   With increasing strain, the different types of subgrain                       constraint.
boundary in NaCl developed different ranges of misorienta-                          Providing the EBSD data collection and processing are
tions (Fig. 3), with the result that by 0.54 strain average                      similar, the average misorientations can be fitted to a power
misorientations of individual grains typically differed by                       law relationship given by Eq. (2), with coefficients of
about 18 (Table 2), but differences could reach 38 (Fig. 6).                     determination, R2, better than 0.99 and nw0.4 (Pennock and
These misorientation differences are likely to have a                            Drury, 2005). This is an encouraging result and suggests that
considerable effect on the stored energy of different grains,                    an average misorientation–strain relationship determined
with important implications for recrystallization. As 500–                       using EBSD might provide useful information about strain
1000 grains are needed to describe fully bulk textures,                          accommodated by dislocation creep in a material.
variations in texture occur between individual EBSD maps                            Our data on samples PK73a and PK67m (Figs. 6 and 7)
containing relatively few grains. Variations in texture can                      suggest that the average subgrain misorientation in dry NaCl
G.M. Pennock et al. / Journal of Structural Geology 27 (2005) 2159–2170                          2167

may be slightly dependent on the initial grain size, such that         qg f e
                                                                                                                                  (7)
a higher misorientation occurs in a smaller grain size
material. Theoretical models for polycrystalline plasticity            A similar result can be derived for core–mantle microstruc-
(Ashby, 1970) imply that the grain size will influence the              tures, in which a mantle of higher misorientation subgrain
accommodation strains required to maintain compatibility               boundaries occurs: the grain size, D, in Eq. (5), can be
between different grains. In Ashby’s model the misfit is                replaced by a mantle width, which can be expressed in terms
accommodated by a density, rg, of homogeneously                        of some multiple of the subgrain size, dg. Statistical
distributed geometrically necessary dislocations:                      subgrains are not expected to depend on grain size.
                                                                          An estimation of the grain size effect for geometric
rg Z e=4bD
                                                            (3)       subgrains can be made from the gradient of a log qg versus
                                                                       log D plot (Eq. (5)), which gives a slope of K1 for the
where e is the average strain, b the Burgers vector and D the
       ¯                                                               Ashby model. In our work, in which the subgrain size is
grain size. If the dislocations are arranged by recovery into          approximately constant, and no distinction was made
subgrain walls, with an average misorientation, qg, across             between dg and ds, a slope of K0.1 was found (for PK73a
the walls, rg can be expressed in terms of qg (Hughes et al.,          and PK67m, average misorientations and grain sizes are,
2003):                                                                 respectively, 2.71 and 2.468 and 126 and 310 mm). The grain
rg Z Sv qg =b                                                (4)       size effect on average misorientations found for NaCl is
                                                                       therefore much weaker than that predicted by Ashby’s
where Sv is the boundary area per unit volume, which is                model (Eq. (5)) and consistent either with Eq. (7) for
equal to 2/L (Pickering, 1976): setting L, the mean intercept          geometric subgrains, or a dominance of statistical subgrain
length to dg, the average spacing for geometric subgrain               boundaries (Eq. (6)).
boundaries, gives:                                                        Most studies, however, predict that subgrain size, d, is
qg Z k2 edg =D
                                                            (5)       dependent on stress, s, with:
                                                                       df 1=sp                                                     (8)
where k2 is a constant. Thus at constant subgrain size, i.e.
constant stress, the average misorientation for geometric              where p is a constant (Raj and Pharr, 1989; Hampel et al.,
subgrain boundaries is a function of average strain, grain             1998; Stone et al., 2004); for NaCl single crystals, p was
size and average spacing for geometric subgrain boundaries.            found to have a value of 1.1 for extended subgrain
   Subgrains may also form by statistical (or incidental)              boundaries and 0.45 for equiaxed subgrains (Raj and
trapping of dislocations into boundaries (Kuhlmann-Wils-               Pharr, 1989). If dg is solely dependent on stress, substituting
dorf and Hansen, 1991), with an average spacing ds, and                in Eq. (5) gives a relationship in which qg is dependent on
theoretical studies (Pantleon, 1998) suggest that qs, the              strain, grain size and stress:
average misorientation across statistical subgrain bound-
aries is independent of grain size for a constant subgrain             qg f e=ðs1:1 DÞ
                                                                                                                                  (9)
size:                                                                     Similarly, substituting for statistical subgrains, ds, in Eq.
                                                                       (6) gives:
qs Z k3 Oðe=ds Þ
                                                            (6)
                                                                       qs f Oðes0:45 Þ
                                                                                                                                 (10)
where k3 is a constant.
    Geometrical and statistical subgrain boundary misor-               i.e. statistical subgrain boundary misorientations depend on
ientations have been studied using TEM (Hughes et al.,                 strain and stress. However, the stress dependence for qs is in
1997, 2003). Hurley and Humphreys (2003) argue that their              the opposite sense to that given for qg. The average
equiaxed subgrains identified with EBSD are likely to be                misorientation of a microstructure will therefore depend on
statistical in origin and the extended subgrain boundaries             the balance of statistical and geometric subgrain boundary
observed in the current work in NaCl are probably                      types. In the present study, samples work hardened, and
geometric in origin.                                                   subgrain misorientations may have been influenced by both
    The microstructures shown in Fig. 3, showing extended              stress and strain. Further work is needed to determine
subgrain boundaries dissecting grains and emanating from               whether a power law relationship holds under steady state
triple junctions, suggest that the spacing of geometric                conditions.
subgrain boundaries, dg, depend on grain size, D. These                    The EBSD determined strain exponent value, n, for
subgrain types have a much larger spacing than                         NaCl, 0.42, is lower than predicted in Eq. (5) for geometric
equiaxed subgrains and in the limit when a grain splits                boundaries, where n is 1, and approaches that predicted in
itself into two subgrains, can approach the grain size. If dg          Eq. (6) for statistical subgrain boundaries, where n is 0.5.
can be expressed as some factor of grain size, D/x, where in           However, Ashby’s model does not take into account texture
the most simple form x is a constant, then Eq. (5) for                 development, or multiple slip, and these effects are expected
geometric average misorientations becomes dependent only               to reduce the strain dependence of qg at higher strain
on strain:                                                             (Leffers, 1975). Other theoretical studies, based on finite
2168                               G.M. Pennock et al. / Journal of Structural Geology 27 (2005) 2159–2170

element modelling of fcc systems, also predict a power law               fluids results in extensive grain boundary migration during
relationship between the average misorientation and strain,              plastic deformation at low temperatures (Urai et al., 1987).
with n, the strain exponent equal to 0.5 for qs and 0.7 for qg           Thus, average misorientations in highly deformed natural
(Mika and Dawson, 1998), in agreement with Pantleon’s                    NaCl will only reflect the local post-recrystallization
model, Eq. (6) (Pantleon, 1998). A value of nZ0.68 can                   dislocation creep strain. If strains are too low for the onset
also be determined from Leffers’ model (Leffers, 1975) for               of extensive grain boundary migration (Watanabe and
geometric dislocations. The theoretical model agrees with                Peach, 2002) then average misorientations in natural NaCl
the experimental TEM studies on fcc metals deformed over                 may be used to estimate strains produced by dislocation
a wide range of temperatures (Hughes et al., 1997, 2003;                 creep. The application of average misorientations to
Hughes, 2002). The lower values for NaCl might be caused                 estimate strain will clearly be limited by static recrystalliza-
by an overestimate of the low strain misorientation value, as            tion, which will remove subgrains. Static recovery may also
discussed earlier, or by a difference in crystalline plasticity          alter average misorientations.
between NaCl and metals, or by a difference in the                           As discussed above, the average misorientation of
deformation mode, as the current work was based on                       undeformed or very low strained material is overestimated.
compressive deformation and other experimental and                       As grain boundary migration recrystallization also creates
theoretical studies were based on rolled deformation                     an inhomogeneous distribution of subgrains, from fully
microstructures, which develop different textures.                       recrystallized grains to heavily deformed grains, an over-
   A further consideration to the application of average                 estimation of average misorientations values is also
misorientation value to determine strain is the effect of                expected for these microstructures. An alternative approach
texture on the average misorientation values. The current                for determining strain from subgrain misorientation
work is based on samples with an almost random initial                   measurements is therefore needed for microstructures that
texture (Pennock et al., 2004). Final textures depend on the             are recrystallized by grain boundary migration, or for very
strain path and might influence misorientation values. As                 low strained material in which the majority of the subgrain
misorientations vary with texture and grain orientation, the             misorientations are below the angular resolution limit for
average misorientation values in a rock with an initial                  EBSD. An alternative method for determining an average
texture is likely to develop different average misorientation            misorientation–strain relationship for these microstructures
values. An orientation dependence could also result in                   would be to include all mapped misorientations, not just a
different average misorientation–strain relationships for                selected angular range, and to scale the average misorienta-
compression, pure shear, tension and torsion deformation                 tion values in terms of mapped area, to give a boundary
paths, depending on the texture differences that develop.                density (Wheeler et al., 2003). Another approach to
   A potential application of the average misorientation                 assessing strain, which might be more applicable to
strain relationship would be to estimate the strain produced             naturally deformed rocks in which subgrain microstructures
by dislocation creep in naturally and experimentally                     have low misorientations or are inhomogeneously distrib-
deformed rocks. If dislocation creep is the sole mechanism               uted, might be to examine misorientation gradients within
then the average subgrain misorientation could be used to                individual grains (Barton and Dawson, 2001; Pennock et al.,
estimate finite strain in naturally deformed rocks. The                   2002; Kamaya et al., 2005).
average misorientation versus strain relationships may need                  Microstructural studies show clear evidence for the
to be calibrated for the effects of initial grain size and stress.       operation of multiple deformation mechanisms in naturally
Inherited microstructures from earlier deformation events                deformed rocks (Mitra, 1976; White, 1982; Knipe, 1989;
will limit the applicability of the average misorientation–                 ¨
                                                                         Stockhert et al., 1999; Harrison and Onasch, 2000). If
strain relationship; for example undeformed sediments may                microstructures are grouped by deformation mechanism
contain many grains with inherited subgrains.                            then crystal plastic microstructures are often the most
   In addition, average subgrain misorientations will only               pervasive in naturally deformed quartz rocks (Harrison and
provide an estimate of the dislocation creep strain if static            Onasch, 2000; Tullis, 2002). However, pervasive undula-
and dynamic grain boundary migration is limited. As                      tory extinction, deformation bands and subgrains may be
extensive migration consumes old grains and subgrain                     produced by relatively low strains so quantitative methods
boundaries, average misorientations depend only on the                   are needed to determine how strain is partitioned between
strain increment since the crystal was swept by a high-angle             different mechanisms (Mitra, 1976; Onasch et al., 1997).
grain boundary. For example, in quartz average strain                    The strain produced by dislocation creep can be estimated
estimates based on subgrain misorientations will be                      from lattice rotations in deformation bands (Wu and
applicable in the recovery controlled creep regime (Hirth                Groshong, 1991) and from deformed rutile needles in quartz
and Tullis, 1992; Tullis, 2002), which is common during                  grains (Mitra, 1976). With suitable experimental calibra-
deformation at greenschist facies conditions (Stipp et al.,              tions, for subgrain size with stress, and for grain size,
2002). At higher temperatures in quartz extensive grain                  average subgrain misorientations measured by EBSD might
boundary migration often occurs (Stipp et al., 2002). In                 be used to estimate dislocation creep strains.
naturally deformed NaCl the presence of grain boundary                       The average misorientation determined using EBSD is a
G.M. Pennock et al. / Journal of Structural Geology 27 (2005) 2159–2170                                      2169

useful measure of strain involving dislocation creep for                    ´
                                                                         Ave Lallement, H., 1985. Subgrain rotation and dynamic recrystallization
experimentally deformed materials and might be very useful                   of olivine, upper mantle diaperism, and extension of the basin-and-
                                                                             range province. Tectonophysics 119, 89–117.
in assessing strain partitioning, providing EBSD mapping                 Barnett, M.R., Montheillet, F., 2002. The generation of new high-angle
data are collected with a suitable step size and processed in a              boundaries in aluminium during torsion. Acta Materiala 50, 2285–2296.
similar manner. However, there are practical limitations to              Barton, N.R., Dawson, P.R., 2001. A methodology for determining average
applying this technique to naturally deformed rocks, such as                 lattice orientation and its application to the characterization of grain
mapping large grain sizes with a small step size, or mapping                 substructure. Metallurgical and Materials Transactions A 32A, 1967–
                                                                             1975.
microstructures where the subgrains are inhomogeneously                  Carter, N.L., Heard, H.C., 1970. Temperature and rate dependent
distributed. Furthermore, in theory, the misorientation–                     deformation of halite. American Journal of Science 269, 193–249.
strain relationship is stress dependent and needs to be                  Delannay, L., Mishin, O.V., Jensen, D.J., Van Houtte, P., 2001.
calibrated to account for differences caused by textures and                 Quantitative analysis of grain subdivision in cold rolled aluminium.
grain sizes.                                                                 Acta Materialia 49 (13), 2441–2451.
                                                                         Hampel, A., Hunshce, U., Weidinger, P., Blum, W., 1998. Description of
                                                                             the creep of rock salt with the composition model—II. Steady-state
                                                                             creep. In: Aubertin, M., Hardy Jr., H.R. (Eds.), The Mechanical
5. Conclusions                                                               Behaviour of Salt Proceedings of the Fourth Conference. Trans. Tech.
                                                                             Publications, pp. 287–299.
                                                                         Harrison, M.J., Onasch, C.M., 2000. Quantitative assessment of low
1. In dry, synthetic NaCl, the average misorientation of
                                                                             temperature deformation mechanisms in a folded quartz arenite, Valley
   subgrains measured using EBSD can be expressed as a                       and Ridge Province, West Virginia. Tectonophysics 317, 73–91.
   function of strain in terms of a power law relation, of the           Hirth, G., Tullis, J., 1992. Dislocation creep regimes in quartz aggregates.
   form qav-grainsZk13n, with n approximately equal to 0.4.                  Journal of Structural Geology 14, 145–159.
   This relationship holds for a material of constant grain              Hughes, D.A., 2002. Scaling of deformation-induced microstructures in fcc
                                                                             metals. Scripta Materialia 47, 697–703.
   size deformed in compression, providing EBSD proces-
                                                                         Hughes, D.A., Liu, Q., Chrzan, D.C., Hansen, N., 1997. Scaling of
   sing is similar.                                                          microstructural parameters: misorientations of deformation induced
2. The average misorientation shows a weak grain size                        boundaries. Acta Materialia 45 (1), 105–112.
   dependence, with higher misorientations occurring in                  Hughes, D.A., Hansen, N., Bammann, D.J., 2003. Geometrically necessary
   smaller grain sized material. This is also consistent with                boundaries, incidental dislocation boundaries and geometrically
                                                                             necessary dislocations. Scripta Materialia 48, 147–153.
   some models of polycrystalline plasticity.
                                                                         Humphreys, F.J., 2001. Review: grain and sub-grain characterization by
3. Current theory for subgrains suggests that average                        electron backscatter diffraction. Journal of Materials Science 36, 3833–
   misorientations may also be stress dependent.                             3854.
4. Subgrain misorientations are influenced strongly by                    Humphreys, F.J., Drury, M.R., 1986. The formation of high angle grain
   grain orientation and surrounding grains and hence the                    boundaries and new grains during the deformation of Al–5%Mg at
                                                                             elevated temperatures. In: Aluminium Technology 3. Institute of
   average misorientation–strain relationship may be
                                                                             Metals, London, pp. 76.1–76.5.
   texture dependent.                                                    Humphreys, F.J., Bate, P.S., Hurley, P.J., 2001. Orientation averaging of
5. Measurement of at least 80 grains is needed for an                        electron backscattered diffraction data. Journal of Microscopy 201 (1),
   accuracy of 0.118 in the average misorientation.                          50–58.
6. It may be possible to use average misorientation values               Hurley, P.J., Humphreys, F., 2002. Characterizing the deformed state in Al–
                                                                             0.1 Mg alloy using high-resolution electron backscattered diffraction.
   to estimate strain contribution by dislocation creep in
                                                                             Journal of Microscopy 205 (3), 218–225.
   rock materials, notably NaCl.                                         Hurley, P.J., Humphreys, F.J., 2003. The application of EBSD to the study
                                                                             of substructural development in a cold rolled single-phase aluminium
                                                                             alloy. Acta Materialia 51 (4), 1087–1102.
                                                                         Kamaya, M., Wilkinson, A.J., Titchmarsh, J.M., 2005. Measurement of
Acknowledgements                                                             plastic strain of polycrystalline material by electron backscattered
                                                                             diffraction. Nuclear Engineering and Design 235 (6), 713–725.
                                                                         Knipe, R.J., 1989. Deformation mechanisms—recognition from natural
   Peter van Krieken is thanked for carrying out the                         tectonites. Journal of Structural Geology 11, 127–146.
deformation experiments and Jaap Liezenberg for sample                   Kuhlmann-Wilsdorf, D., Hansen, N., 1991. Geometrically necessary,
preparation. We thank Michael Stipp and an anonymous                         incidental and subgrain boundaries. Scripta Metallurgica et Materialia
reviewer for constructive criticism that helped to improve                   25 (7), 1557–1562.
                                                                         Leffers, T., 1975. On the misfit between grains in a deformed Sachs
this manuscript. The electron microscopy was conducted at                    polycrystal and its relation to the homogeneous deformation of real
the Electron Microscopy and Structure and Analysis centre                    polycrystals. Scripta Metallurgica 9, 261–264.
at Utrecht University.                                                   Mika, D.P., Dawson, P.R., 1998. Polycrystal plasticity modeling of
                                                                             intracrystalline boundary textures. Acta Materialia 47 (4), 1355–1369.
                                                                         Mitra, S., 1976. A quantitative study of deformation mechanisms and finite
                                                                             strains in quartzites. Contributions to Mineralogy and Petrology 59,
References                                                                   203–226.
                                                                         Onasch, C.M., Shen-Tu, B., Couzens-Schultz, B.A., 1997. Strain
Ashby, M.F., 1970. The deformation of plastically non-homogeneous            partitioning and factorization in a quartz arenite. Journal of Structural
   materials. Philosophical Magazine 21, 399–424.                            Geology 20, 1065–1074.
2170                                       G.M. Pennock et al. / Journal of Structural Geology 27 (2005) 2159–2170

Pantleon, W., 1998. On the statistical origin of disorientations in dislocation     ¨
                                                                                  Stockhert, B., Brix, M.R., Kleinschrodt, R., Hurford, A.J., Wirth, R., 1999.
    structures. Acta Materiala 46 (2), 451–456.                                       Thermochronometry and microstructures of quartz—a comparison with
Passchier, C.W., Trouw, R.A.J., 1996. Microtectonics. Springer, Berlin.               experimental flow laws and predictions on the temperature of the
Peach, C.J., Spiers, C.J., 1996. Influence of crystal plastic deformation on           brittle–plastic transition. Journal of Structural Geology 21 (3), 351.
    dilatancy and permeability development in synthetic salt rock.                Stone, D.S., Plookphol, T., Cooper, R.F., 2004. Similarity and scaling in
    Tectonophysics 256 (1–4), 101–128.                                                creep and load relaxation of single-crystal halite, (NaCl). Journal of
Pennock, G.M., Drury, M.R., 2005. Low angle subgrain misorientations in               Geophysical Research 109 (B12), B12201.
    deformed NaCl. Journal of Microscopy 217, 130–137.                            Ter Heege, J.H., 2002. Relationship between dynamic recrystallization,
Pennock, G.M., Drury, M.R., Trimby, P.W., Spiers, C.J., 2002.                         grain size distribution and rheology. PhD Thesis, Utrecht University.
    Misorientation distributions in hot deformed NaCl using electron              Ter Heege, J., De Bresser, J.H.P., Spiers, C.J., 2005. Dynamic
    backscattered diffraction. Journal of Microscopy 205 (3), 285–294.                recrystallization of wet synthetic polycrystalline halite: dependence of
Pennock, G.M., Drury, M.R., Spiers, C.J., 2004. Investigation of subgrain             grain size distribution on flow stress, temperature and strain.
    rotation recrystallization in dry polycrystalline NaCl. Materials Science
                                                                                      Tectonophysics 396, 35–57.
    Forum 467–470, 597–602.
                                                                                  Trimby, P.W., Drury, M.R., Spiers, C.J., 2000. Recognising the
Pickering, F.B., 1976. The Basis of Quantitative Metallography. Institute of
                                                                                      crystallographic signature of recrystallization processes in deformed
    Metallurgical Technicians, pp. 1–38.
                                                                                      rocks: a study of experimentally deformed rocksalt. Journal of
Raj, S.V., Pharr, G.M., 1989. Creep substructure formation in sodium
                                                                                      Structural Geology 22 (11–12), 1609–1620.
    chloride single crystals in the power law and exponential creep regimes.
                                                                                  Tullis, J., 2002. Deformation of granitic rocks: experimental studies and
    Materials Science and Engineering, A A122, 233–242.
Randle, V., Engler, O., 2000. Introduction to Texture Analysis:                       natural examples. In: Karato, S., Wenk, H.-R. (Eds.), Plastic
    Macrotexture, Microtexture and Orientation Mapping. Gorden                       Deformation of Minerals and Rocks. Reviews in Mineralogy and
    Breach Science Publications.                                                      Geochemistry, vol. 51. Mineralogical Society of America, pp. 51–95.
Spiers, C.J., Carter, N.L., 1998. Microsphysics of rocksalt flow in nature.        Urai, J.L., Spiers, C.J., Zwart, H.J., Lister, G.S., 1986. Weakening of rock
    In: Aubertin, M., Hardy Jr., H.R. (Eds.), The Mechanical Behaviour of             salt by water during long-term creep. Nature 324, 554–557.
    Salt IV—Proceedings of the Fourth Conference Series on Rock and Soil          Urai, J.L., Spiers, C.J., Peach, C.J., Franssen, R.C.M.W., Liezenberg, J.L.,
    Mechanics. Trans. Tech. Publications, pp. 115–128.                                1987. Deformation mechanisms operating in naturally deformed halite
Spiers, C.J., Urai, J.L., Lister, G.S., Boland, J.N., Zwart, H.J., 1986. The          rocks as deduced from microstructural investigations. Geologie en
    Influence of Rock–Fluid Interaction on the Rheological and Transport               Mijnbouw 66, 165–176.
    Properties of Dry and Wet Salt Rocks, European Communities                    Watanabe, T., Peach, C.J., 2002. Electrical impedance measurement of
    Commission, Nuclear Science and Technology Series 1986.                           plastically deforming halite rocks at 125 8C and 50 MPa. Journal of
Spiers, C.J., Schutjens, P.M.T.M., Brzesowsky, R.H., Peach, C.J.,                     Geophysical Research 107(B1), ECV 2, 1–12.
    Liezenberg, J.L., Zwart, H.J., 1990. Experimental determination of            Wheeler, J., Jiang, Z., Prior, D.J., Tullis, J., Drury, M.R., Trimby, P.W.,
    constitutive parameters governing creep of rocksalt by pressure                   2003. From geometry to dynamics of microstructure: using boundary
    solution. In: Knipe, R.J., Rutter, E.H. (Eds.), Deformation Mechanisms,           lengths to quantify boundary misorientations and anisotropy. Tectono-
    Rheology and Tectonics. The Geology Society, London, Special                      physics 376, 19–35.
    Publication 54, 215–227.                                                      White, J.C., 1982. Quartz deformation and the recognition of recrystalliza-
Stipp, M., Stunitz, H., Heilbronner, R., Schmid, S.M., 2002. Dynamic                  tion regimes in the Flinton Group conglomerates, Ontario. Canadian
    recrystallization of quartz: correlation between natural and experimen-           Journal of Earth Sciences 19, 81–93.
    tal conditions. In: De Meer, S., Drury, M.R., De Bresser, J.H.P.,             Wu, S., Groshong, R.H., 1991. Strain analysis using quartz deformation
    Pennock, G.M., (Eds.), The Geological Society, London, Special                    bands. Tectonophysics 190, 269–282.
    Publication, 200, 171–190.

Weitere ähnliche Inhalte

Was ist angesagt?

Effect of Compaction Moisture Content on Strength Parameters of Unsaturated C...
Effect of Compaction Moisture Content on Strength Parameters of Unsaturated C...Effect of Compaction Moisture Content on Strength Parameters of Unsaturated C...
Effect of Compaction Moisture Content on Strength Parameters of Unsaturated C...ijtsrd
 
Scaringi Gianvito - PhD Thesis
Scaringi Gianvito - PhD ThesisScaringi Gianvito - PhD Thesis
Scaringi Gianvito - PhD ThesisGianvito Scaringi
 
Moisture absorption and mechanical degradation studies of PMI foam cored fibe...
Moisture absorption and mechanical degradation studies of PMI foam cored fibe...Moisture absorption and mechanical degradation studies of PMI foam cored fibe...
Moisture absorption and mechanical degradation studies of PMI foam cored fibe...IJERA Editor
 
sesmic wave 2013-2014
sesmic wave 2013-2014sesmic wave 2013-2014
sesmic wave 2013-2014junaid kareem
 
Makowitz et al_2006
Makowitz et al_2006Makowitz et al_2006
Makowitz et al_2006ranicalvo
 
IRJET- Comparative Study of Various Characteristics of Different Kinds of Ex...
IRJET-	 Comparative Study of Various Characteristics of Different Kinds of Ex...IRJET-	 Comparative Study of Various Characteristics of Different Kinds of Ex...
IRJET- Comparative Study of Various Characteristics of Different Kinds of Ex...IRJET Journal
 
Effect of Sericitization on the Engineering Properties of the Miango Granite ...
Effect of Sericitization on the Engineering Properties of the Miango Granite ...Effect of Sericitization on the Engineering Properties of the Miango Granite ...
Effect of Sericitization on the Engineering Properties of the Miango Granite ...iosrjce
 
Study on the Properties of Natural Soil Stabilized with Various Percentages o...
Study on the Properties of Natural Soil Stabilized with Various Percentages o...Study on the Properties of Natural Soil Stabilized with Various Percentages o...
Study on the Properties of Natural Soil Stabilized with Various Percentages o...ijtsrd
 
Juscélia testing soil encasing materials for measuring hydraulic conductivit...
Juscélia  testing soil encasing materials for measuring hydraulic conductivit...Juscélia  testing soil encasing materials for measuring hydraulic conductivit...
Juscélia testing soil encasing materials for measuring hydraulic conductivit...Juscélia Ferreira
 
Research Inventy : International Journal of Engineering and Science
Research Inventy : International Journal of Engineering and ScienceResearch Inventy : International Journal of Engineering and Science
Research Inventy : International Journal of Engineering and Scienceresearchinventy
 
Characterizing the Behavior of Polyurethane Grout
Characterizing the Behavior of Polyurethane GroutCharacterizing the Behavior of Polyurethane Grout
Characterizing the Behavior of Polyurethane GroutYenny Mattei
 
A Review of Stabilization of Soft Soils by using Nanomaterials
A Review of Stabilization of Soft Soils by using NanomaterialsA Review of Stabilization of Soft Soils by using Nanomaterials
A Review of Stabilization of Soft Soils by using NanomaterialsKanav Chandan
 
The Vertical Distribution of Bouyant Plastics at Sea
The Vertical Distribution of Bouyant Plastics at SeaThe Vertical Distribution of Bouyant Plastics at Sea
The Vertical Distribution of Bouyant Plastics at SeaKimberly Noble
 
Particle-size fractions-dependent extracellular enzyme activity in sediments ...
Particle-size fractions-dependent extracellular enzyme activity in sediments ...Particle-size fractions-dependent extracellular enzyme activity in sediments ...
Particle-size fractions-dependent extracellular enzyme activity in sediments ...GJESM Publication
 
Classification and Assessment of Soil Compaction Level in Amassoma, Bayelsa S...
Classification and Assessment of Soil Compaction Level in Amassoma, Bayelsa S...Classification and Assessment of Soil Compaction Level in Amassoma, Bayelsa S...
Classification and Assessment of Soil Compaction Level in Amassoma, Bayelsa S...Premier Publishers
 

Was ist angesagt? (20)

Effect of Compaction Moisture Content on Strength Parameters of Unsaturated C...
Effect of Compaction Moisture Content on Strength Parameters of Unsaturated C...Effect of Compaction Moisture Content on Strength Parameters of Unsaturated C...
Effect of Compaction Moisture Content on Strength Parameters of Unsaturated C...
 
G05614854
G05614854G05614854
G05614854
 
Presentation
PresentationPresentation
Presentation
 
Scaringi Gianvito - PhD Thesis
Scaringi Gianvito - PhD ThesisScaringi Gianvito - PhD Thesis
Scaringi Gianvito - PhD Thesis
 
Moisture absorption and mechanical degradation studies of PMI foam cored fibe...
Moisture absorption and mechanical degradation studies of PMI foam cored fibe...Moisture absorption and mechanical degradation studies of PMI foam cored fibe...
Moisture absorption and mechanical degradation studies of PMI foam cored fibe...
 
sesmic wave 2013-2014
sesmic wave 2013-2014sesmic wave 2013-2014
sesmic wave 2013-2014
 
Oo3425382542
Oo3425382542Oo3425382542
Oo3425382542
 
Durability test for rock mass
Durability test for rock massDurability test for rock mass
Durability test for rock mass
 
Makowitz et al_2006
Makowitz et al_2006Makowitz et al_2006
Makowitz et al_2006
 
IRJET- Comparative Study of Various Characteristics of Different Kinds of Ex...
IRJET-	 Comparative Study of Various Characteristics of Different Kinds of Ex...IRJET-	 Comparative Study of Various Characteristics of Different Kinds of Ex...
IRJET- Comparative Study of Various Characteristics of Different Kinds of Ex...
 
Effect of Sericitization on the Engineering Properties of the Miango Granite ...
Effect of Sericitization on the Engineering Properties of the Miango Granite ...Effect of Sericitization on the Engineering Properties of the Miango Granite ...
Effect of Sericitization on the Engineering Properties of the Miango Granite ...
 
Study on the Properties of Natural Soil Stabilized with Various Percentages o...
Study on the Properties of Natural Soil Stabilized with Various Percentages o...Study on the Properties of Natural Soil Stabilized with Various Percentages o...
Study on the Properties of Natural Soil Stabilized with Various Percentages o...
 
Juscélia testing soil encasing materials for measuring hydraulic conductivit...
Juscélia  testing soil encasing materials for measuring hydraulic conductivit...Juscélia  testing soil encasing materials for measuring hydraulic conductivit...
Juscélia testing soil encasing materials for measuring hydraulic conductivit...
 
Research Inventy : International Journal of Engineering and Science
Research Inventy : International Journal of Engineering and ScienceResearch Inventy : International Journal of Engineering and Science
Research Inventy : International Journal of Engineering and Science
 
Characterizing the Behavior of Polyurethane Grout
Characterizing the Behavior of Polyurethane GroutCharacterizing the Behavior of Polyurethane Grout
Characterizing the Behavior of Polyurethane Grout
 
Paper
PaperPaper
Paper
 
A Review of Stabilization of Soft Soils by using Nanomaterials
A Review of Stabilization of Soft Soils by using NanomaterialsA Review of Stabilization of Soft Soils by using Nanomaterials
A Review of Stabilization of Soft Soils by using Nanomaterials
 
The Vertical Distribution of Bouyant Plastics at Sea
The Vertical Distribution of Bouyant Plastics at SeaThe Vertical Distribution of Bouyant Plastics at Sea
The Vertical Distribution of Bouyant Plastics at Sea
 
Particle-size fractions-dependent extracellular enzyme activity in sediments ...
Particle-size fractions-dependent extracellular enzyme activity in sediments ...Particle-size fractions-dependent extracellular enzyme activity in sediments ...
Particle-size fractions-dependent extracellular enzyme activity in sediments ...
 
Classification and Assessment of Soil Compaction Level in Amassoma, Bayelsa S...
Classification and Assessment of Soil Compaction Level in Amassoma, Bayelsa S...Classification and Assessment of Soil Compaction Level in Amassoma, Bayelsa S...
Classification and Assessment of Soil Compaction Level in Amassoma, Bayelsa S...
 

Andere mochten auch

US-Hispanics Consumer Engagement through Social Media
US-Hispanics Consumer Engagement through Social MediaUS-Hispanics Consumer Engagement through Social Media
US-Hispanics Consumer Engagement through Social Mediaecmetrics
 
Latin American consumer engagement through social media
Latin American consumer engagement through social mediaLatin American consumer engagement through social media
Latin American consumer engagement through social mediaecmetrics
 
นิทาน53
นิทาน53นิทาน53
นิทาน53anongnat
 
Agroturystyczny Dom Gosi
Agroturystyczny Dom GosiAgroturystyczny Dom Gosi
Agroturystyczny Dom GosiJerzy Gondek
 
Easter 2011 - Luxury Chocolate Catalog
Easter 2011 - Luxury Chocolate CatalogEaster 2011 - Luxury Chocolate Catalog
Easter 2011 - Luxury Chocolate CatalogBrandCritique
 

Andere mochten auch (6)

US-Hispanics Consumer Engagement through Social Media
US-Hispanics Consumer Engagement through Social MediaUS-Hispanics Consumer Engagement through Social Media
US-Hispanics Consumer Engagement through Social Media
 
Latin American consumer engagement through social media
Latin American consumer engagement through social mediaLatin American consumer engagement through social media
Latin American consumer engagement through social media
 
นิทาน53
นิทาน53นิทาน53
นิทาน53
 
Agroturystyczny Dom Gosi
Agroturystyczny Dom GosiAgroturystyczny Dom Gosi
Agroturystyczny Dom Gosi
 
Enabled magazine
Enabled magazineEnabled magazine
Enabled magazine
 
Easter 2011 - Luxury Chocolate Catalog
Easter 2011 - Luxury Chocolate CatalogEaster 2011 - Luxury Chocolate Catalog
Easter 2011 - Luxury Chocolate Catalog
 

Ähnlich wie Measuring Subgrain Misorientation Development with Strain in Dry Synthetic NaCl

2005 emerging insights into the dynamics of submarine debris flows
2005 emerging insights into the dynamics of submarine debris flows2005 emerging insights into the dynamics of submarine debris flows
2005 emerging insights into the dynamics of submarine debris flowsshh315
 
Shale Gas, Petrophysical Considerations in Producing and Evaluating
Shale Gas, Petrophysical Considerations in Producing and EvaluatingShale Gas, Petrophysical Considerations in Producing and Evaluating
Shale Gas, Petrophysical Considerations in Producing and EvaluatingOrkhan Mammadov
 
Ghodke fedsm2017 69066-final
Ghodke fedsm2017 69066-finalGhodke fedsm2017 69066-final
Ghodke fedsm2017 69066-finalChaitanya Ghodke
 
The Toba super-eruption: micro-scale traces of a global-scale climate event?
The Toba super-eruption:  micro-scale traces of a global-scale climate event?The Toba super-eruption:  micro-scale traces of a global-scale climate event?
The Toba super-eruption: micro-scale traces of a global-scale climate event?Kim Cobb
 
Onset of Rayleigh-Benard Convection in CO2 Sequestration in the Isotropic Por...
Onset of Rayleigh-Benard Convection in CO2 Sequestration in the Isotropic Por...Onset of Rayleigh-Benard Convection in CO2 Sequestration in the Isotropic Por...
Onset of Rayleigh-Benard Convection in CO2 Sequestration in the Isotropic Por...Associate Professor in VSB Coimbatore
 
Estimating geo mechanical strength of reservoir rocks from well logs for safe...
Estimating geo mechanical strength of reservoir rocks from well logs for safe...Estimating geo mechanical strength of reservoir rocks from well logs for safe...
Estimating geo mechanical strength of reservoir rocks from well logs for safe...Alexander Decker
 
Harrison et al nano fase_spatiotemp_thames_setac 2019
Harrison et al nano fase_spatiotemp_thames_setac 2019Harrison et al nano fase_spatiotemp_thames_setac 2019
Harrison et al nano fase_spatiotemp_thames_setac 2019Anna Sapundzhieva
 
Permeability prediction
Permeability predictionPermeability prediction
Permeability predictionsajjad1984
 
Understanding Permeability of Hydraulic Fracture Networks A Sandbox Analog Mo...
Understanding Permeability of Hydraulic Fracture Networks A Sandbox Analog Mo...Understanding Permeability of Hydraulic Fracture Networks A Sandbox Analog Mo...
Understanding Permeability of Hydraulic Fracture Networks A Sandbox Analog Mo...Renee Heldman
 
Fluid structure and boundary slippage in nanoscale liquid films
Fluid structure and boundary slippage in nanoscale liquid filmsFluid structure and boundary slippage in nanoscale liquid films
Fluid structure and boundary slippage in nanoscale liquid filmsNikolai Priezjev
 
Geophys. J. Int.-2016-Bodin-605-29
Geophys. J. Int.-2016-Bodin-605-29Geophys. J. Int.-2016-Bodin-605-29
Geophys. J. Int.-2016-Bodin-605-29Julie Leiva
 
MATHEMATICAL MODEL FOR HYDROTHERMAL CONVECTION AROUND A RADIOACTIVE WASTE DEP...
MATHEMATICAL MODEL FOR HYDROTHERMAL CONVECTION AROUND A RADIOACTIVE WASTE DEP...MATHEMATICAL MODEL FOR HYDROTHERMAL CONVECTION AROUND A RADIOACTIVE WASTE DEP...
MATHEMATICAL MODEL FOR HYDROTHERMAL CONVECTION AROUND A RADIOACTIVE WASTE DEP...Jean Belline
 

Ähnlich wie Measuring Subgrain Misorientation Development with Strain in Dry Synthetic NaCl (20)

2005 emerging insights into the dynamics of submarine debris flows
2005 emerging insights into the dynamics of submarine debris flows2005 emerging insights into the dynamics of submarine debris flows
2005 emerging insights into the dynamics of submarine debris flows
 
Shale Gas, Petrophysical Considerations in Producing and Evaluating
Shale Gas, Petrophysical Considerations in Producing and EvaluatingShale Gas, Petrophysical Considerations in Producing and Evaluating
Shale Gas, Petrophysical Considerations in Producing and Evaluating
 
Structure Index
Structure IndexStructure Index
Structure Index
 
Ghodke fedsm2017 69066-final
Ghodke fedsm2017 69066-finalGhodke fedsm2017 69066-final
Ghodke fedsm2017 69066-final
 
The Toba super-eruption: micro-scale traces of a global-scale climate event?
The Toba super-eruption:  micro-scale traces of a global-scale climate event?The Toba super-eruption:  micro-scale traces of a global-scale climate event?
The Toba super-eruption: micro-scale traces of a global-scale climate event?
 
Onset of Rayleigh-Benard Convection in CO2 Sequestration in the Isotropic Por...
Onset of Rayleigh-Benard Convection in CO2 Sequestration in the Isotropic Por...Onset of Rayleigh-Benard Convection in CO2 Sequestration in the Isotropic Por...
Onset of Rayleigh-Benard Convection in CO2 Sequestration in the Isotropic Por...
 
16634-19010-1-PB
16634-19010-1-PB16634-19010-1-PB
16634-19010-1-PB
 
Estimating geo mechanical strength of reservoir rocks from well logs for safe...
Estimating geo mechanical strength of reservoir rocks from well logs for safe...Estimating geo mechanical strength of reservoir rocks from well logs for safe...
Estimating geo mechanical strength of reservoir rocks from well logs for safe...
 
Harrison et al nano fase_spatiotemp_thames_setac 2019
Harrison et al nano fase_spatiotemp_thames_setac 2019Harrison et al nano fase_spatiotemp_thames_setac 2019
Harrison et al nano fase_spatiotemp_thames_setac 2019
 
Permeability prediction
Permeability predictionPermeability prediction
Permeability prediction
 
Understanding Permeability of Hydraulic Fracture Networks A Sandbox Analog Mo...
Understanding Permeability of Hydraulic Fracture Networks A Sandbox Analog Mo...Understanding Permeability of Hydraulic Fracture Networks A Sandbox Analog Mo...
Understanding Permeability of Hydraulic Fracture Networks A Sandbox Analog Mo...
 
Paper liquefaction
Paper liquefactionPaper liquefaction
Paper liquefaction
 
Fluid structure and boundary slippage in nanoscale liquid films
Fluid structure and boundary slippage in nanoscale liquid filmsFluid structure and boundary slippage in nanoscale liquid films
Fluid structure and boundary slippage in nanoscale liquid films
 
Geophys. J. Int.-2016-Bodin-605-29
Geophys. J. Int.-2016-Bodin-605-29Geophys. J. Int.-2016-Bodin-605-29
Geophys. J. Int.-2016-Bodin-605-29
 
My Master Thesis
My Master ThesisMy Master Thesis
My Master Thesis
 
Briaud2001
Briaud2001Briaud2001
Briaud2001
 
MATHEMATICAL MODEL FOR HYDROTHERMAL CONVECTION AROUND A RADIOACTIVE WASTE DEP...
MATHEMATICAL MODEL FOR HYDROTHERMAL CONVECTION AROUND A RADIOACTIVE WASTE DEP...MATHEMATICAL MODEL FOR HYDROTHERMAL CONVECTION AROUND A RADIOACTIVE WASTE DEP...
MATHEMATICAL MODEL FOR HYDROTHERMAL CONVECTION AROUND A RADIOACTIVE WASTE DEP...
 
Publication 2 (2014)
Publication 2 (2014)Publication 2 (2014)
Publication 2 (2014)
 
Poster_Sharif_2015
Poster_Sharif_2015Poster_Sharif_2015
Poster_Sharif_2015
 
Lecture 04
Lecture 04Lecture 04
Lecture 04
 

Measuring Subgrain Misorientation Development with Strain in Dry Synthetic NaCl

  • 1. Journal of Structural Geology 27 (2005) 2159–2170 www.elsevier.com/locate/jsg The development of subgrain misorientations with strain in dry synthetic NaCl measured using EBSD G.M. Pennock*, M.R. Drury, C.J. Spiers Faculty of Geosciences, Utrecht University, Postbus 80.021, 3508 TA Utrecht, The Netherlands Received 7 February 2005; received in revised form 3 June 2005; accepted 29 June 2005 Available online 13 September 2005 Abstract The development of subgrain boundary misorientations with strain in dry, synthetic NaCl polycrystals, deformed at elevated temperature, has been investigated using electron backscattered diffraction (EBSD). At low natural strains, up to 0.5, average misorientations of subgrain boundaries increase with strain and a power law relationship exists between strain and average misorientations. The average misorientations are strongly influenced by grain orientation, suggesting that the misorientation–strain relationship may also be texture dependent in materials with high plastic anisotropy, like NaCl. A slight grain size dependency of the average misorientations was observed. The results indicate that with suitable calibration, average subgrain boundary misorientations may offer a method for estimating the strain accommodated by dislocation creep in NaCl and thus perhaps in other geological materials, although current theories for polycrystalline plasticity imply that misorientations may also depend on stress in some situations. q 2005 Elsevier Ltd. All rights reserved. Keywords: Dry NaCl; Subgrain; Misorientation; Strain; Grain size; EBSD 1. Introduction dislocation creep has occurred, only small strains are needed to produce a high density of free dislocations, and subgrains The rheological behaviour of naturally deformed rocks is form by 0.10 strain (Carter and Heard, 1970). This means generally controlled by several different mechanisms that that other less easily recognized processes, such as pressure can operate simultaneously or consecutively and can affect solution creep (Spiers et al., 1990) or crack seal mechanisms the microstructure. Estimating strain from microstructures may also have contributed to grain elongation processes and can therefore be difficult, especially when more than one together with phenomena such as grain boundary sliding, deformation mechanism is operative (Passchier and Trouw, may even be the major contributor to the bulk strain during 1996). For instance, deformation at temperatures in the deformation. The same argument applies equally to other range 100–200 8C of synthetic NaCl, dried to contain only a rock types, such as quartz tectonites (Mitra, 1976; Harrison few ppm of water, is dominated by dislocation creep and and Onasch, 2000). microstructures contain elongated grains and subgrains As the presence of subgrains is sufficient only for (Trimby et al., 2000; Watanabe and Peach, 2002; Ter Heege establishing that dislocation activity has occurred, quantify- et al., 2005). When water is present, microstructures are ing any systematic trends in subgrain development with dominated by grain boundary migration recrystallization strain in a given material may be useful for establishing a (Spiers et al., 1986; Urai et al., 1986) but elongated grains, strain gauge for dislocation creep deformation, as well as subgrains and free dislocations may still be present (Spiers providing insight into the role of subgrain rotation in and Carter, 1998). Although these microstructures show that dynamic recrystallization (Pennock et al., 2004). One potential method of assessing dislocation creep strain is to * Corresponding author. Tel.: C31 30 2535109; fax: C31 30 2537725. measure how the subgrain misorientation angle increases E-mail address: gpennock@geo.uu.nl (G.M. Pennock). with strain. A small number of misorientations have been 0191-8141/$ - see front matter q 2005 Elsevier Ltd. All rights reserved. measured in various deformed materials using both light doi:10.1016/j.jsg.2005.06.013 ´ microscopy (LM) (Ave Lallement, 1985) and transmission
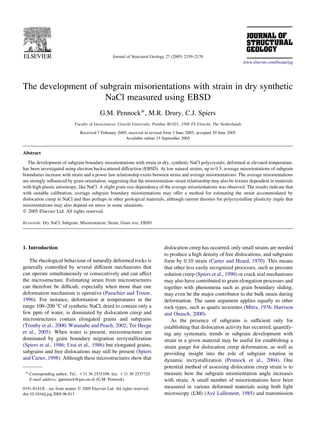
  • 2. 2160 G.M. Pennock et al. / Journal of Structural Geology 27 (2005) 2159–2170 electron microscopy (TEM) (Hughes et al., 1997). More 2. Materials and methods recently, many more subgrain misorientations have been measured with EBSD mapping in metals and NaCl (Randle 2.1. Sample preparation and Engler, 2000; Humphreys, 2001; Pennock et al., 2002; Hurley and Humphreys, 2003; Pennock and Drury, 2005). Cylinders, 3 cm in diameter, were prepared from The average misorientation of subgrain boundaries, qav, is frequently reported to show a power law relationship with synthetic NaCl by cold pressing and annealing to a final strain, 3, of the form: density of w99.5% (Peach and Spiers, 1996; Ter Heege, 2002). To minimize the occurrence of grain boundary migration recrystallization (Trimby et al., 2000) samples qav f 3n (1) were dried in flowing argon, mostly to a water content of 5G2 ppm (Watanabe and Peach, 2002) (Table 1). This where nZ4–6, depending on the type of subgrain boundary procedure gave initial average grain sizes ranging from 300 (Hughes et al., 1997; Pennock et al., 2002; Pennock and to 400 mm, although variations in the drying sequence Drury, 2005). resulted in some variations in grain size between batches. Using EBSD, Pennock et al. (2002) and Pennock and The cylinders were deformed in axi-symmetric compression Drury (2005) showed that individual subgrains in dry using a triaxial testing machine under a confining pressure synthetic NaCl deformed in the dislocation creep regime of 50 MPa at 165G10 8C (w0.4 Tm) and at constant were surrounded by segments of subgrain boundaries with a displacement rate, equivalent to a final strain rate of w6! wide range of misorientations. Subgrain boundaries were 10K7 sK1 (Peach and Spiers, 1996; Ter Heege, 2002; Ter separated into three types, depending on the boundary Heege et al., 2005). Under these conditions dry NaCl does misorientation and spatial distribution. Equiaxed subgrain not undergo dynamic recrystallization by grain boundary boundaries were ubiquitous, and generally had lower migration and continues to work harden (Ter Heege et al., misorientations, whereas long straight subgrain boundaries 2005). The samples deformed relatively homogeneously, had higher misorientations and extended between several although there was some minor barrelling at higher strains. subgrains: extended subgrains were often associated with Final natural strains ranged from 0.07 to 0.54 (Fig. 1). The either triple points or dissected grains. A weak core–mantle 0.15 strain sample (PK119a) showed lower stress values, development of subgrains and subgrain boundaries was also related to the slightly higher water content of this sample noted. The formation of new grains by subgrain rotation (11 ppm). Samples were cooled to room temperature recrystallization was limited in these materials at strains of (approximately 1.5 8C/min) and sectioned soon after 0.5 (Pennock et al., 2004). deformation; sections were made of the central portion of Many variables, including strain, influence subgrain the cylinder, parallel to the compression direction, and development and may influence misorientation values, polished in a dry room (Urai et al., 1987). All sections were such as deformation conditions (confining pressure, lightly etched for 10 s, either in saturated salt solution temperature and strain rate), material properties (grain containing ferric chloride, or in methanol, and finally orientation, neighbouring grain orientation, grain size and washed with either hexane or ether. fluid content). The angular resolution of the technique used to measure misorientations (LM, TEM, EBSD) may also influence the range of misorientations that can be measured. Pennock et al. (2002) found that EBSD mapping variables, such as ‘noise’ caused by angular resolution limits, step size, processing of non-indexed pixels and filtering data to remove noise (Pennock and Drury, 2005), all influenced average misorientation values in NaCl, particularly using etched NaCl samples. However, the average misorientation parameter may still provide useful data on the state of a material, including the dislocation creep strain magnitude, depending on the scatter in the data produced by other effects and on whether the qav versus 3 relationship is reproducible for all EBSD systems (Pennock and Drury, 2005). This paper examines the effect strain, grain orientation, texture and grain size have on the average misorientation values, with the aim of assessing the potential of qav versus 3 relationships for estimating dislocation creep strain in Fig. 1. Stress–strain curves for deformed NaCl (see Table 1, unsmoothed geological materials. data, corrected for change in area and specimen length).
  • 3. G.M. Pennock et al. / Journal of Structural Geology 27 (2005) 2159–2170 2161 Table 1 Information on samples used in deformation experiments Sample Drying procedure Water (ppm) Grain sizea (mm) Natural strain PK67 0.2 8C/min to 350 8C/16 h; 0.2 8C/min to 530 8C/68 h – 310 Undeformed PK67h As for PK67 3 0.28 PK67m As for PK67 6 0.54 PK73 1.5 8C/min to 560 8C/25 h – 126 Undeformed PK73a As for PK73 7 0.5 PK119b 2 8C/min to 700 8C/1 h; 0.5 8C/min to 530 8C/44 h 7 329 0.07 PK119a As for PK119a 11b 412 0.15 a Grain sizes of undeformed material were determined using linear intercept of at least 100 grains from light micrographs. b Argon gas ran out during drying. 2.2. Microscopy and EBSD was often not possible and these boundaries were not included in the average misorientation calculation. In many The microstructures of deformed and undeformed instances, segments of the subgrain boundary developed material were examined using LM and orientation contrast misorientations O168, and these were included in the in the scanning electron microscopy (SEM). Conditions calculation of average misorientations, as the boundary used for EBSD mapping NaCl, 12 kV, 2 nA, were mostly segments did not completely surround a region to form a the same as in previous work (Pennock et al., 2002; Pennock new grain. The arithmetic average of the grain average and Drury, 2005). EBSD data were collected and analysed distributions, qav-grains, was determined for each strain. using HKL Channel 5 software and either a Philips XL30 Frequency distributions based on grain averages gave a SEM with a SIT camera, or a Philips XL30 SFEG SEM and good insight into the standard deviations and spread of a Nordlys CCD camera. average misorientations on a grain basis for a given strain. In all EBSD work, a 4 mm step was used to determine With knowledge of the standard errors, it was possible to misorientations of subgrains, which gave a reasonable assess the influence of grain size on average misorientation representation of the subgrain microstructures (average values. subgrain size 12 mm) and misorientations; smaller step sizes required more time to comprehensively map grain mis- orientations and increased the relative number of non- 3. Results indexed pixels along etched boundaries, whereas large step sizes cumulated orientations across several subgrains 3.1. Microstructure (Pennock et al., 2002). Smaller step sizes of 1–3 mm were used to examine details of subgrain microstructures. The undeformed material (Table 1) contained mostly The quality of the EBSD maps was good, as subgrain polygonal recrystallized grains and the occasional square- misorientations of 0.58 were resolved and showed good shaped grain (Fig. 2a). One batch had a slightly lower correlation with etched microstructures (Pennock and original grain size of 126G12 mm (PK73). A few grains Drury, 2005). Maps were filtered to remove orientation contained subgrains with low misorientations, !28, noise using VMAP (in-house software, courtesy of F.J. measured with EBSD. Sometimes larger grains contained Humphreys, Manchester University) (Humphreys et al., remnant internal grains; the volume fraction of these grains 2001). Filtering removed many of the low misorientations was quite small, up to about 1% of the area in the 0.07 caused by orientation noise and poor pattern quality along strained sample. boundaries. Filtering to remove low angle misorientations In the deformed samples grains became flattened with caused by noise allowed resolution of misorientations to increasing strain and most grain boundaries remained better than 0.58 and gave a good representation of the etched smooth (Fig. 2b). Boundaries were preferentially etched microstructures. All EBSD maps are shown after filtering. and some porosity, mostly inter-granular, was observed, The frequency distribution of subgrain boundary length especially after cleaning samples with ether. There was per unit area as a function of misorientation angle was evidence for a small amount of slow grain boundary determined from nearest neighbour pixel misorientations migration in deformed samples in the form of micron-scale after replacing most non-indexed pixels with an average of grain boundary serrations, which occurred at the intersec- nearest neighbour pixel orientations. The average misor- tion of subgrains with grain boundaries throughout materials ientations of subgrains O0.58 of individual grains were also with higher water contents (PK119a). All samples contained calculated. At higher strains of about 0.5, a few subgrain subgrains, although a few grains in each sample, usually boundaries completely enclosed regions to create new with a grain size less than 100 mm, contained relatively few grains with grain boundary misorientations O168. Dis- subgrains. tinguishing these boundaries from original grain boundaries Qualitative assessment of the subgrain boundary
  • 4. 2162 G.M. Pennock et al. / Journal of Structural Geology 27 (2005) 2159–2170 Fig. 2. Light micrographs showing typical grain shapes of: (a) undeformed (PK73) and (b) deformed material (PK73a). Arrow shows remnant, internal grains. misorientations in EBSD mapped microstructures (Fig. 3 The log–frequency distribution clearly shows that the shows typical details as a function of strain) showed that majority of subgrain boundary misorientations have low there was considerable variation in the subgrain misorienta- misorientations !58 even at strains of about 0.5. tions, both within individual grains and between grains. Many extended subgrain boundaries were associated Individual segments of subgrain boundaries differed with triple junctions at all strains, others occurred in grains significantly in misorientation and it was unusual for an that split into widely differing orientations, often with a individual subgrain to be surrounded by misorientations O banded appearance. Grains, containing predominantly 58 at strains of 0.5. The micrographs show that equiaxed equiaxed or both equiaxed and extended subgrain bound- subgrains were ubiquitous at all strains and generally aries, were selected (Table 2). The grains containing surrounded by boundaries with very low misorientations ! extended subgrain boundaries were generally oriented 28; at strains of 0.28 and above a marked preferential with h110i crystal axes at a high angle to the compression alignment of these subgrain boundaries at about 458 to the axis (see Table 2). As an individual grain orientation spread compression axis was visible. In some grains extended out with increasing strains, the original orientation was subgrain boundaries (arrowed in Fig. 3) formed that were difficult to define. Extended subgrain boundaries did not longer than the equiaxed subgrain size. generally surround individual subgrains, although corner At the lowest strain, 0.07 (Fig. 3a), many of the subgrains sections of original grains were nearly ‘cut-off’ by high were not completely enclosed by boundaries of O0.58 angle subgrain boundaries at higher strains. At higher misorientation, i.e. many subgrain boundaries had misor- strains, 0.5, some of the extended subgrain boundaries ientations !0.58. Extended subgrain boundaries developed developed much smaller subgrains along their boundaries at 0.07 strain with misorientations of 2–58 and some triple (Fig. 3d) many of which were smaller than the 4 mm step junctions showed extended subgrain boundaries with size used to map the average misorientations. Very misorientations as high as 5–108. A few grains (e.g. middle occasionally, these small subgrains reached sufficient of lower grain, Fig. 3a) showed high misorientation misorientation to form small new subgrains. boundaries in the central portion of the grain, which, by analogy with other microstructures, are thought to be 3.2. Average angular misorientations associated with triple junctions of internal, or island, grains located beneath the mapped surface. At 0.15 strain (Fig. 3b) The average misorientation values of selected grains subgrains with boundary misorientations 0.5–28 were after 0.54 strain (PK67m) are also shown in Table 2. Grains ubiquitous. These subgrain boundaries tended to surround containing extended subgrain boundaries in addition to the equiaxed shaped subgrains. Extended subgrain boundaries equiaxed subgrain boundary types showed up to 18 variation showed an increase in misorientations to greater than 58. At in average misorientation and had higher average mis- 0.28 strain, (Fig. 3c) the majority of subgrains were orientations than grains in which extended subgrain surrounded by boundaries with misorientations of at least boundaries were absent. The grains containing extended 2–58, and many extended subgrain boundaries reached 5– subgrain boundaries represented at least 37% of the mapped 108. At 0.5 strain (Fig. 3d) sections of extended boundaries area. had developed misorientations greater than 108 but the Inverse pole figures (IPFs) for the compression axis majority of equiaxed subgrain boundary misorientations obtained from EBSD maps of nearby locations in sample remained less than 58. These trends in subgrain boundary PK67m (0.54 strain) are shown in Fig. 5. Each map showed misorientations development with strain are shown in Fig. 4. differences in texture and average misorientation values; in
  • 5. G.M. Pennock et al. / Journal of Structural Geology 27 (2005) 2159–2170 2163 Fig. 3. EBSD micrographs of deformed material for strains: (a) 0.07, (b) 0.15, (c) 0.28 and (d) 0.5 (samples PK119b, 119a, 67h and 73a, respectively). Changes in orientation with respect to the compression axis (vertical) are shown in colour. Arrows show extended subgrain boundaries, which are often associated with high misorientations, as shown by change in colour within individual grains. In (d), smaller subgrains along extended subgrain boundaries are also arrowed. More subgrain detail is visible in (d) because the EBSD map was made with a 2 mm step size compared with a 4 mm step used in to (a)–(c). general, a map with a single h101i fibre texture (Fig. 5c) had general, areas with h111i, h100i and h115i fibres oriented a lower average misorientation. The differences in average approximately parallel to the compression axis had higher misorientation as a function of fibre texture subsets are average misorientation than areas oriented with h120i or given in Table 3 for two samples (PK73a and PK67m). In h110i, although this trend was not so strong in sample
  • 6. 2164 G.M. Pennock et al. / Journal of Structural Geology 27 (2005) 2159–2170 Table 3 Average misorientations for different fibre textures in samples PK73a and PK67m. Fibre textures were made by selecting specific poles to be parallel, within 88 deviation, to the compression direction (4 mm step, unfiltered data, SIT camera system) Fibre texture Average misorientation 8 (% data points) Grain size 310 mm Grain size 126 mm (PK67m) (PK73a) 111 1.70 (0.2) 1.72 (0.8) 100 1.50 (1.0) 1.83 (1.9) 115 1.56 (7.9) 1.81 (10) 120 1.33 (36.5) 1.75 (27.4) 110 1.37 (19.1) 1.73 (13.7) Complete map 1.92 2.27 grain size. Average misorientations for samples of a similar grain size followed a power law relationship of the form: Fig. 4. Log–frequency distribution is shown for subgrain misorientations at different strains. Higher angle misorientations increase in frequency with qavÿgrains Z k1 3n (2) strain, although the majority of misorientations remain less than 58. Sample PK73a (strain 0.5) had a smaller initial grain size compared with other where 3 is the true strain, k1 is a constant with a value of 3.38 samples and shows a greater frequency of higher angle misorientations (SIT and n, the power exponent, has a value of 0.42. Analysing camera system, 4 mm step, unfiltered). the subgrain misorientation on a grain basis rather than on a map as a whole, and including all subgrain boundary PK73a. Table 3 shows that the smaller grain size material misorientations, gives a slightly different result to earlier (PK73a), 126 mm, had higher average misorientation values work in which EBSD maps as a whole were analysed in the than the 310 mm (PK67m) grain size material deformed to angular range 0.5–168 (k1 was found to have a value of 3.18 approximately the same strain. and n was 0.41) (Pennock and Drury, 2005). Therefore, it is The frequency distribution of average misorientations of important to use a similar analysis technique for etched individual grains is shown in Fig. 6. As strain increased NaCl when comparing data. Grain analysis is more time average misorientations of grains both increased and had a consuming, but is the better technique and provides wider range of values. The average misorientations of these information about errors and about the spread in orientation distributions, qav-grains, which included all subgrain bound- with strain of grains. ary misorientations O0.58, are also given. These values are Sample PK73a, which had an original grain size of slightly larger at each strain than the qav values derived from 126 mm and was strained to 0.5, showed a slightly higher misorientations in the range 0.5–168 (Pennock and Drury, average misorientation value compared with PK67m 2005). Average misorientations based on grains, qav-grains, (original grain size 310 mm, strain 0.54). In order to are plotted for each strain in Fig. 7. Average misorientations determine whether this difference was significant, the increased with strain, although the rate of increase average misorientation for PK67m was calculated for a decreased at higher strains in samples with similar initial strain of 0.5 using the appropriate values for the power law Table 2 Average misorientations for selected grains and for the complete EBSD map (PK67m). The types of subgrain boundaries present and the approximate orientation of the grain with respect to the compression axis are given (0.54 strain, 4 mm step, unfiltered data, SIT camera system) Subgrain boundary type Average misorientation 0.5–!168 Approximate orientation huvwi % Data points Complete map 1.92 100 ExtendedCequiaxed 1.74 115 3 1.94 115 2 2.64 115 1 2.28 115 7 1.83 115 3 2.04 115 4 1.76 441 1 1.77 415 16 Equiaxed 1.42 110 5 1.44 441 2 1.35 Close 110 2 1.34 Close 110 2 1.34 Close 110 3
  • 7. G.M. Pennock et al. / Journal of Structural Geology 27 (2005) 2159–2170 2165 Fig. 5. Inverse pole figures for the compression axis direction, showing differences in texture between EBSD maps taken from nearby locations in the central portion of a deformed sample (PK67m). The number of grains mapped and the average misorientations for each map are also given. The strength of the h101i pole and the presence of other poles orientated away from h101i influence the average misorientation. Slightly lower misorientations are seen in maps with a single h101i maximum (contoured as multiples of uniform density, half width 108, cluster size 58). relationship based on the grain averages (nZ0.42 and k1Z 2000), the samples in this study were dried to very low water 3.38) to give 2.46G0.118. This is slightly smaller than the contents of a few ppm. The grain serrations and equant value of 2.71G0.118 for PK73a (see Fig. 7). grains, which contained relatively few subgrains, suggest that a few regions underwent dynamic recrystallization by rapid grain boundary migration, probably assisted by 4. Discussion localized pockets of water. However, the volume fraction of these grains was !1% and generally not included in The main objectives of this work have been to examine EBSD maps used to calculate the average misorientations. the effect that strain, grain orientation, texture and grain size While samples were quenched from the deformation have on the average misorientation values in dry NaCl. The temperature at a practical rate, the cooling rates were quality and processing of EBSD maps is briefly discussed, relatively slow compared with rapid quenches used for as these influence misorientation values. First, the micro- unconfined deformation. Microstructures are therefore structures are summarized. likely to have been fully recovered so that subgrain As the presence of very small amounts of water assist misorientations were probably slightly higher than at rapid grain boundary migration (Watanabe and Peach, deformation temperatures. Nevertheless, misorientation– 2002) and removes subgrain misorientations (Trimby et al., strain behaviour of NaCl shows a similar trend to that found Fig. 6. Frequency distribution of grain average misorientations for different strains, 3. Averages of these distributions, qav-grains, and standard errors at 90% confidence for about 80 grains, are shown.
  • 8. 2166 G.M. Pennock et al. / Journal of Structural Geology 27 (2005) 2159–2170 cause differences in average misorientation between samples or sub-areas and are likely to cause the spread in average misorientation values observed for EBSD maps from areas containing only 10s of grains (Fig. 5 and Table 2). Misorientations from at least 80 grains are needed to determine a representative average misorientation value for a particular material state of strain or recrystallization. Furthermore, the step size used to map subgrain micro- structures should be small enough so that individual subgrain boundaries are measured (Pennock et al., 2002). Obtaining accurate values of the average misorientation is therefore demanding on EBSD mapping times, particularly for larger grain size materials requiring small step mapping. Further work is needed on duplicate samples to assess the sample to sample variation. Fig. 7. Average misorientation of grain averages, qav-grains, as a function of EBSD mapping of etched NaCl contains more artefact strain. Average misorientation increases with strain. A power law misorientations along boundaries than found in other relationship trend line is shown, excluding sample PK73a, which had a materials, because of the etch topography. The EBSD smaller original grain sizes than other samples. The average misorientation camera system used to map misorientations was found to value for sample PK67m is also shown adjusted to a strain of 0.5 (misorientation range O0.58, CCD camera, at least 80 grains, 4 mm step affect average misorientation values and filtering maps maps). increased misorientations (Pennock and Drury, 2005). These differences were explained in terms of the percentage for deformed metals (Hughes, 2002), which are generally of non-indexed pixels present in the maps and were not so rapidly cooled to retain the deformation microstructures. pronounced in other materials in which subgrain boundaries Furthermore, slower cooling rates are more likely to occur were not etched (Hurley and Humphreys, 2002). An in naturally deformed rocks. improved polishing method for NaCl should improve the Deformation of dry NaCl at 0.4 Tm resulted in subgrain map quality and reduce the differences in average formation even at very low strains of 0.07. The types of misorientation values caused by noise reduction and subgrain boundaries present, equiaxed and extended, were filtering to reduce noise. similar to those reported for h100i single crystal experiments In material deformed to strains of at least 0.15, many on NaCl (Raj and Pharr, 1989) and in cold (0.3 Tm) and hot subgrain misorientations were above the angular (O0.5 Tm) worked aluminium and some aluminium alloys resolution limit of 0.58 and average misorientation values (Humphreys and Drury, 1986; Delannay et al., 2001; based on misorientations O0.58 were representative. Barnett and Montheillet, 2002; Hurley and Humphreys, However, after very low strain deformation (!0.07) 2003). proportionally more misorientations were present that As extended subgrain boundaries tended to form in were below the angular resolution limit for EBSD. Average grains that did not have h110i parallel to the compression misorientation values at low strains were therefore slightly axis, grain orientation is likely to be an important factor in overestimated. For similar reasons, the average misorienta- determining the type of subgrain boundary and average tion of the undeformed material was far higher than misorientation of a grain. However, extended subgrain expected (Fig. 7). For this reason, the trend lines used to boundaries often formed across only part of a grain, fit the qav-grains versus 3 data were calculated using the data implying that surrounding grain orientation also influenced for the 0.07–0.54 strained samples and the undeformed the microstructure. This was most pronounced at triple average misorientation value was rejected. The expected junctions where the constraints of surrounding grains were trend would be for the undeformed average misorientation the greatest. to go through zero and a power law relationship satisfies this With increasing strain, the different types of subgrain constraint. boundary in NaCl developed different ranges of misorienta- Providing the EBSD data collection and processing are tions (Fig. 3), with the result that by 0.54 strain average similar, the average misorientations can be fitted to a power misorientations of individual grains typically differed by law relationship given by Eq. (2), with coefficients of about 18 (Table 2), but differences could reach 38 (Fig. 6). determination, R2, better than 0.99 and nw0.4 (Pennock and These misorientation differences are likely to have a Drury, 2005). This is an encouraging result and suggests that considerable effect on the stored energy of different grains, an average misorientation–strain relationship determined with important implications for recrystallization. As 500– using EBSD might provide useful information about strain 1000 grains are needed to describe fully bulk textures, accommodated by dislocation creep in a material. variations in texture occur between individual EBSD maps Our data on samples PK73a and PK67m (Figs. 6 and 7) containing relatively few grains. Variations in texture can suggest that the average subgrain misorientation in dry NaCl
  • 9. G.M. Pennock et al. / Journal of Structural Geology 27 (2005) 2159–2170 2167 may be slightly dependent on the initial grain size, such that qg f e (7) a higher misorientation occurs in a smaller grain size material. Theoretical models for polycrystalline plasticity A similar result can be derived for core–mantle microstruc- (Ashby, 1970) imply that the grain size will influence the tures, in which a mantle of higher misorientation subgrain accommodation strains required to maintain compatibility boundaries occurs: the grain size, D, in Eq. (5), can be between different grains. In Ashby’s model the misfit is replaced by a mantle width, which can be expressed in terms accommodated by a density, rg, of homogeneously of some multiple of the subgrain size, dg. Statistical distributed geometrically necessary dislocations: subgrains are not expected to depend on grain size. An estimation of the grain size effect for geometric rg Z e=4bD (3) subgrains can be made from the gradient of a log qg versus log D plot (Eq. (5)), which gives a slope of K1 for the where e is the average strain, b the Burgers vector and D the ¯ Ashby model. In our work, in which the subgrain size is grain size. If the dislocations are arranged by recovery into approximately constant, and no distinction was made subgrain walls, with an average misorientation, qg, across between dg and ds, a slope of K0.1 was found (for PK73a the walls, rg can be expressed in terms of qg (Hughes et al., and PK67m, average misorientations and grain sizes are, 2003): respectively, 2.71 and 2.468 and 126 and 310 mm). The grain rg Z Sv qg =b (4) size effect on average misorientations found for NaCl is therefore much weaker than that predicted by Ashby’s where Sv is the boundary area per unit volume, which is model (Eq. (5)) and consistent either with Eq. (7) for equal to 2/L (Pickering, 1976): setting L, the mean intercept geometric subgrains, or a dominance of statistical subgrain length to dg, the average spacing for geometric subgrain boundaries (Eq. (6)). boundaries, gives: Most studies, however, predict that subgrain size, d, is qg Z k2 edg =D (5) dependent on stress, s, with: df 1=sp (8) where k2 is a constant. Thus at constant subgrain size, i.e. constant stress, the average misorientation for geometric where p is a constant (Raj and Pharr, 1989; Hampel et al., subgrain boundaries is a function of average strain, grain 1998; Stone et al., 2004); for NaCl single crystals, p was size and average spacing for geometric subgrain boundaries. found to have a value of 1.1 for extended subgrain Subgrains may also form by statistical (or incidental) boundaries and 0.45 for equiaxed subgrains (Raj and trapping of dislocations into boundaries (Kuhlmann-Wils- Pharr, 1989). If dg is solely dependent on stress, substituting dorf and Hansen, 1991), with an average spacing ds, and in Eq. (5) gives a relationship in which qg is dependent on theoretical studies (Pantleon, 1998) suggest that qs, the strain, grain size and stress: average misorientation across statistical subgrain bound- aries is independent of grain size for a constant subgrain qg f e=ðs1:1 DÞ (9) size: Similarly, substituting for statistical subgrains, ds, in Eq. (6) gives: qs Z k3 Oðe=ds Þ (6) qs f Oðes0:45 Þ (10) where k3 is a constant. Geometrical and statistical subgrain boundary misor- i.e. statistical subgrain boundary misorientations depend on ientations have been studied using TEM (Hughes et al., strain and stress. However, the stress dependence for qs is in 1997, 2003). Hurley and Humphreys (2003) argue that their the opposite sense to that given for qg. The average equiaxed subgrains identified with EBSD are likely to be misorientation of a microstructure will therefore depend on statistical in origin and the extended subgrain boundaries the balance of statistical and geometric subgrain boundary observed in the current work in NaCl are probably types. In the present study, samples work hardened, and geometric in origin. subgrain misorientations may have been influenced by both The microstructures shown in Fig. 3, showing extended stress and strain. Further work is needed to determine subgrain boundaries dissecting grains and emanating from whether a power law relationship holds under steady state triple junctions, suggest that the spacing of geometric conditions. subgrain boundaries, dg, depend on grain size, D. These The EBSD determined strain exponent value, n, for subgrain types have a much larger spacing than NaCl, 0.42, is lower than predicted in Eq. (5) for geometric equiaxed subgrains and in the limit when a grain splits boundaries, where n is 1, and approaches that predicted in itself into two subgrains, can approach the grain size. If dg Eq. (6) for statistical subgrain boundaries, where n is 0.5. can be expressed as some factor of grain size, D/x, where in However, Ashby’s model does not take into account texture the most simple form x is a constant, then Eq. (5) for development, or multiple slip, and these effects are expected geometric average misorientations becomes dependent only to reduce the strain dependence of qg at higher strain on strain: (Leffers, 1975). Other theoretical studies, based on finite
  • 10. 2168 G.M. Pennock et al. / Journal of Structural Geology 27 (2005) 2159–2170 element modelling of fcc systems, also predict a power law fluids results in extensive grain boundary migration during relationship between the average misorientation and strain, plastic deformation at low temperatures (Urai et al., 1987). with n, the strain exponent equal to 0.5 for qs and 0.7 for qg Thus, average misorientations in highly deformed natural (Mika and Dawson, 1998), in agreement with Pantleon’s NaCl will only reflect the local post-recrystallization model, Eq. (6) (Pantleon, 1998). A value of nZ0.68 can dislocation creep strain. If strains are too low for the onset also be determined from Leffers’ model (Leffers, 1975) for of extensive grain boundary migration (Watanabe and geometric dislocations. The theoretical model agrees with Peach, 2002) then average misorientations in natural NaCl the experimental TEM studies on fcc metals deformed over may be used to estimate strains produced by dislocation a wide range of temperatures (Hughes et al., 1997, 2003; creep. The application of average misorientations to Hughes, 2002). The lower values for NaCl might be caused estimate strain will clearly be limited by static recrystalliza- by an overestimate of the low strain misorientation value, as tion, which will remove subgrains. Static recovery may also discussed earlier, or by a difference in crystalline plasticity alter average misorientations. between NaCl and metals, or by a difference in the As discussed above, the average misorientation of deformation mode, as the current work was based on undeformed or very low strained material is overestimated. compressive deformation and other experimental and As grain boundary migration recrystallization also creates theoretical studies were based on rolled deformation an inhomogeneous distribution of subgrains, from fully microstructures, which develop different textures. recrystallized grains to heavily deformed grains, an over- A further consideration to the application of average estimation of average misorientations values is also misorientation value to determine strain is the effect of expected for these microstructures. An alternative approach texture on the average misorientation values. The current for determining strain from subgrain misorientation work is based on samples with an almost random initial measurements is therefore needed for microstructures that texture (Pennock et al., 2004). Final textures depend on the are recrystallized by grain boundary migration, or for very strain path and might influence misorientation values. As low strained material in which the majority of the subgrain misorientations vary with texture and grain orientation, the misorientations are below the angular resolution limit for average misorientation values in a rock with an initial EBSD. An alternative method for determining an average texture is likely to develop different average misorientation misorientation–strain relationship for these microstructures values. An orientation dependence could also result in would be to include all mapped misorientations, not just a different average misorientation–strain relationships for selected angular range, and to scale the average misorienta- compression, pure shear, tension and torsion deformation tion values in terms of mapped area, to give a boundary paths, depending on the texture differences that develop. density (Wheeler et al., 2003). Another approach to A potential application of the average misorientation assessing strain, which might be more applicable to strain relationship would be to estimate the strain produced naturally deformed rocks in which subgrain microstructures by dislocation creep in naturally and experimentally have low misorientations or are inhomogeneously distrib- deformed rocks. If dislocation creep is the sole mechanism uted, might be to examine misorientation gradients within then the average subgrain misorientation could be used to individual grains (Barton and Dawson, 2001; Pennock et al., estimate finite strain in naturally deformed rocks. The 2002; Kamaya et al., 2005). average misorientation versus strain relationships may need Microstructural studies show clear evidence for the to be calibrated for the effects of initial grain size and stress. operation of multiple deformation mechanisms in naturally Inherited microstructures from earlier deformation events deformed rocks (Mitra, 1976; White, 1982; Knipe, 1989; will limit the applicability of the average misorientation– ¨ Stockhert et al., 1999; Harrison and Onasch, 2000). If strain relationship; for example undeformed sediments may microstructures are grouped by deformation mechanism contain many grains with inherited subgrains. then crystal plastic microstructures are often the most In addition, average subgrain misorientations will only pervasive in naturally deformed quartz rocks (Harrison and provide an estimate of the dislocation creep strain if static Onasch, 2000; Tullis, 2002). However, pervasive undula- and dynamic grain boundary migration is limited. As tory extinction, deformation bands and subgrains may be extensive migration consumes old grains and subgrain produced by relatively low strains so quantitative methods boundaries, average misorientations depend only on the are needed to determine how strain is partitioned between strain increment since the crystal was swept by a high-angle different mechanisms (Mitra, 1976; Onasch et al., 1997). grain boundary. For example, in quartz average strain The strain produced by dislocation creep can be estimated estimates based on subgrain misorientations will be from lattice rotations in deformation bands (Wu and applicable in the recovery controlled creep regime (Hirth Groshong, 1991) and from deformed rutile needles in quartz and Tullis, 1992; Tullis, 2002), which is common during grains (Mitra, 1976). With suitable experimental calibra- deformation at greenschist facies conditions (Stipp et al., tions, for subgrain size with stress, and for grain size, 2002). At higher temperatures in quartz extensive grain average subgrain misorientations measured by EBSD might boundary migration often occurs (Stipp et al., 2002). In be used to estimate dislocation creep strains. naturally deformed NaCl the presence of grain boundary The average misorientation determined using EBSD is a
  • 11. G.M. Pennock et al. / Journal of Structural Geology 27 (2005) 2159–2170 2169 useful measure of strain involving dislocation creep for ´ Ave Lallement, H., 1985. Subgrain rotation and dynamic recrystallization experimentally deformed materials and might be very useful of olivine, upper mantle diaperism, and extension of the basin-and- range province. Tectonophysics 119, 89–117. in assessing strain partitioning, providing EBSD mapping Barnett, M.R., Montheillet, F., 2002. The generation of new high-angle data are collected with a suitable step size and processed in a boundaries in aluminium during torsion. Acta Materiala 50, 2285–2296. similar manner. However, there are practical limitations to Barton, N.R., Dawson, P.R., 2001. A methodology for determining average applying this technique to naturally deformed rocks, such as lattice orientation and its application to the characterization of grain mapping large grain sizes with a small step size, or mapping substructure. Metallurgical and Materials Transactions A 32A, 1967– 1975. microstructures where the subgrains are inhomogeneously Carter, N.L., Heard, H.C., 1970. Temperature and rate dependent distributed. Furthermore, in theory, the misorientation– deformation of halite. American Journal of Science 269, 193–249. strain relationship is stress dependent and needs to be Delannay, L., Mishin, O.V., Jensen, D.J., Van Houtte, P., 2001. calibrated to account for differences caused by textures and Quantitative analysis of grain subdivision in cold rolled aluminium. grain sizes. Acta Materialia 49 (13), 2441–2451. Hampel, A., Hunshce, U., Weidinger, P., Blum, W., 1998. Description of the creep of rock salt with the composition model—II. Steady-state creep. In: Aubertin, M., Hardy Jr., H.R. (Eds.), The Mechanical 5. Conclusions Behaviour of Salt Proceedings of the Fourth Conference. Trans. Tech. Publications, pp. 287–299. Harrison, M.J., Onasch, C.M., 2000. Quantitative assessment of low 1. In dry, synthetic NaCl, the average misorientation of temperature deformation mechanisms in a folded quartz arenite, Valley subgrains measured using EBSD can be expressed as a and Ridge Province, West Virginia. Tectonophysics 317, 73–91. function of strain in terms of a power law relation, of the Hirth, G., Tullis, J., 1992. Dislocation creep regimes in quartz aggregates. form qav-grainsZk13n, with n approximately equal to 0.4. Journal of Structural Geology 14, 145–159. This relationship holds for a material of constant grain Hughes, D.A., 2002. Scaling of deformation-induced microstructures in fcc metals. Scripta Materialia 47, 697–703. size deformed in compression, providing EBSD proces- Hughes, D.A., Liu, Q., Chrzan, D.C., Hansen, N., 1997. Scaling of sing is similar. microstructural parameters: misorientations of deformation induced 2. The average misorientation shows a weak grain size boundaries. Acta Materialia 45 (1), 105–112. dependence, with higher misorientations occurring in Hughes, D.A., Hansen, N., Bammann, D.J., 2003. Geometrically necessary smaller grain sized material. This is also consistent with boundaries, incidental dislocation boundaries and geometrically necessary dislocations. Scripta Materialia 48, 147–153. some models of polycrystalline plasticity. Humphreys, F.J., 2001. Review: grain and sub-grain characterization by 3. Current theory for subgrains suggests that average electron backscatter diffraction. Journal of Materials Science 36, 3833– misorientations may also be stress dependent. 3854. 4. Subgrain misorientations are influenced strongly by Humphreys, F.J., Drury, M.R., 1986. The formation of high angle grain grain orientation and surrounding grains and hence the boundaries and new grains during the deformation of Al–5%Mg at elevated temperatures. In: Aluminium Technology 3. Institute of average misorientation–strain relationship may be Metals, London, pp. 76.1–76.5. texture dependent. Humphreys, F.J., Bate, P.S., Hurley, P.J., 2001. Orientation averaging of 5. Measurement of at least 80 grains is needed for an electron backscattered diffraction data. Journal of Microscopy 201 (1), accuracy of 0.118 in the average misorientation. 50–58. 6. It may be possible to use average misorientation values Hurley, P.J., Humphreys, F., 2002. Characterizing the deformed state in Al– 0.1 Mg alloy using high-resolution electron backscattered diffraction. to estimate strain contribution by dislocation creep in Journal of Microscopy 205 (3), 218–225. rock materials, notably NaCl. Hurley, P.J., Humphreys, F.J., 2003. The application of EBSD to the study of substructural development in a cold rolled single-phase aluminium alloy. Acta Materialia 51 (4), 1087–1102. Kamaya, M., Wilkinson, A.J., Titchmarsh, J.M., 2005. Measurement of Acknowledgements plastic strain of polycrystalline material by electron backscattered diffraction. Nuclear Engineering and Design 235 (6), 713–725. Knipe, R.J., 1989. Deformation mechanisms—recognition from natural Peter van Krieken is thanked for carrying out the tectonites. Journal of Structural Geology 11, 127–146. deformation experiments and Jaap Liezenberg for sample Kuhlmann-Wilsdorf, D., Hansen, N., 1991. Geometrically necessary, preparation. We thank Michael Stipp and an anonymous incidental and subgrain boundaries. Scripta Metallurgica et Materialia reviewer for constructive criticism that helped to improve 25 (7), 1557–1562. Leffers, T., 1975. On the misfit between grains in a deformed Sachs this manuscript. The electron microscopy was conducted at polycrystal and its relation to the homogeneous deformation of real the Electron Microscopy and Structure and Analysis centre polycrystals. Scripta Metallurgica 9, 261–264. at Utrecht University. Mika, D.P., Dawson, P.R., 1998. Polycrystal plasticity modeling of intracrystalline boundary textures. Acta Materialia 47 (4), 1355–1369. Mitra, S., 1976. A quantitative study of deformation mechanisms and finite strains in quartzites. Contributions to Mineralogy and Petrology 59, References 203–226. Onasch, C.M., Shen-Tu, B., Couzens-Schultz, B.A., 1997. Strain Ashby, M.F., 1970. The deformation of plastically non-homogeneous partitioning and factorization in a quartz arenite. Journal of Structural materials. Philosophical Magazine 21, 399–424. Geology 20, 1065–1074.
  • 12. 2170 G.M. Pennock et al. / Journal of Structural Geology 27 (2005) 2159–2170 Pantleon, W., 1998. On the statistical origin of disorientations in dislocation ¨ Stockhert, B., Brix, M.R., Kleinschrodt, R., Hurford, A.J., Wirth, R., 1999. structures. Acta Materiala 46 (2), 451–456. Thermochronometry and microstructures of quartz—a comparison with Passchier, C.W., Trouw, R.A.J., 1996. Microtectonics. Springer, Berlin. experimental flow laws and predictions on the temperature of the Peach, C.J., Spiers, C.J., 1996. Influence of crystal plastic deformation on brittle–plastic transition. Journal of Structural Geology 21 (3), 351. dilatancy and permeability development in synthetic salt rock. Stone, D.S., Plookphol, T., Cooper, R.F., 2004. Similarity and scaling in Tectonophysics 256 (1–4), 101–128. creep and load relaxation of single-crystal halite, (NaCl). Journal of Pennock, G.M., Drury, M.R., 2005. Low angle subgrain misorientations in Geophysical Research 109 (B12), B12201. deformed NaCl. Journal of Microscopy 217, 130–137. Ter Heege, J.H., 2002. Relationship between dynamic recrystallization, Pennock, G.M., Drury, M.R., Trimby, P.W., Spiers, C.J., 2002. grain size distribution and rheology. PhD Thesis, Utrecht University. Misorientation distributions in hot deformed NaCl using electron Ter Heege, J., De Bresser, J.H.P., Spiers, C.J., 2005. Dynamic backscattered diffraction. Journal of Microscopy 205 (3), 285–294. recrystallization of wet synthetic polycrystalline halite: dependence of Pennock, G.M., Drury, M.R., Spiers, C.J., 2004. Investigation of subgrain grain size distribution on flow stress, temperature and strain. rotation recrystallization in dry polycrystalline NaCl. Materials Science Tectonophysics 396, 35–57. Forum 467–470, 597–602. Trimby, P.W., Drury, M.R., Spiers, C.J., 2000. Recognising the Pickering, F.B., 1976. The Basis of Quantitative Metallography. Institute of crystallographic signature of recrystallization processes in deformed Metallurgical Technicians, pp. 1–38. rocks: a study of experimentally deformed rocksalt. Journal of Raj, S.V., Pharr, G.M., 1989. Creep substructure formation in sodium Structural Geology 22 (11–12), 1609–1620. chloride single crystals in the power law and exponential creep regimes. Tullis, J., 2002. Deformation of granitic rocks: experimental studies and Materials Science and Engineering, A A122, 233–242. Randle, V., Engler, O., 2000. Introduction to Texture Analysis: natural examples. In: Karato, S., Wenk, H.-R. (Eds.), Plastic Macrotexture, Microtexture and Orientation Mapping. Gorden Deformation of Minerals and Rocks. Reviews in Mineralogy and Breach Science Publications. Geochemistry, vol. 51. Mineralogical Society of America, pp. 51–95. Spiers, C.J., Carter, N.L., 1998. Microsphysics of rocksalt flow in nature. Urai, J.L., Spiers, C.J., Zwart, H.J., Lister, G.S., 1986. Weakening of rock In: Aubertin, M., Hardy Jr., H.R. (Eds.), The Mechanical Behaviour of salt by water during long-term creep. Nature 324, 554–557. Salt IV—Proceedings of the Fourth Conference Series on Rock and Soil Urai, J.L., Spiers, C.J., Peach, C.J., Franssen, R.C.M.W., Liezenberg, J.L., Mechanics. Trans. Tech. Publications, pp. 115–128. 1987. Deformation mechanisms operating in naturally deformed halite Spiers, C.J., Urai, J.L., Lister, G.S., Boland, J.N., Zwart, H.J., 1986. The rocks as deduced from microstructural investigations. Geologie en Influence of Rock–Fluid Interaction on the Rheological and Transport Mijnbouw 66, 165–176. Properties of Dry and Wet Salt Rocks, European Communities Watanabe, T., Peach, C.J., 2002. Electrical impedance measurement of Commission, Nuclear Science and Technology Series 1986. plastically deforming halite rocks at 125 8C and 50 MPa. Journal of Spiers, C.J., Schutjens, P.M.T.M., Brzesowsky, R.H., Peach, C.J., Geophysical Research 107(B1), ECV 2, 1–12. Liezenberg, J.L., Zwart, H.J., 1990. Experimental determination of Wheeler, J., Jiang, Z., Prior, D.J., Tullis, J., Drury, M.R., Trimby, P.W., constitutive parameters governing creep of rocksalt by pressure 2003. From geometry to dynamics of microstructure: using boundary solution. In: Knipe, R.J., Rutter, E.H. (Eds.), Deformation Mechanisms, lengths to quantify boundary misorientations and anisotropy. Tectono- Rheology and Tectonics. The Geology Society, London, Special physics 376, 19–35. Publication 54, 215–227. White, J.C., 1982. Quartz deformation and the recognition of recrystalliza- Stipp, M., Stunitz, H., Heilbronner, R., Schmid, S.M., 2002. Dynamic tion regimes in the Flinton Group conglomerates, Ontario. Canadian recrystallization of quartz: correlation between natural and experimen- Journal of Earth Sciences 19, 81–93. tal conditions. In: De Meer, S., Drury, M.R., De Bresser, J.H.P., Wu, S., Groshong, R.H., 1991. Strain analysis using quartz deformation Pennock, G.M., (Eds.), The Geological Society, London, Special bands. Tectonophysics 190, 269–282. Publication, 200, 171–190.