SlideShare a Scribd company logo
1 of 6
Hubungan antara Biaya Promosi dan Volume Penjualan Tas
   X            Y
  500          1090
  640          1300
  720          1420
  890          1675
  1010         1855
  1120         2020
  1250         2215
  1302         2293
  1580         2710
  1720         2960
  1900         3190
  2010         3355
  2090         3475
  2201         3475
  2490         3642
    .            .
Regression


                       Descriptive Statistics

                            Mean      Std. Deviation      N
    volume penjualan      2445.0000      872.94608             15
    biaya promosi         1428.2000      622.40756             15


pada bagian ini diperlihatkan dua variabel yang diregresikan yakni variabel Y
(volumepenjualan) dan X (biaya promosi). Isi deskrifsi adalah rata-rata
Y=2445.0000, serta memiliki std dev. 872.94608 dan jumlah data15, demikian
juga pada variabel berikutnya dapat dilihat.


                                  Correlations

                                                  volume
                                                 penjualan     biaya promosi
    Pearson Correlation     volume penjualan          1.000              .994
                            biaya promosi              .994             1.000
    Sig. (1-tailed)         volume penjualan               .             .000
                            biaya promosi              .000                 .
    N                       volume penjualan             15                15
                            biaya promosi                15                15

dari hasil korelasi diatas tampak bahwa korelasi biaya promosi dengan
volume penjualan ialah 0.994, dengan tingkat sig.0.000
Variables Entered/Removedb


            Variables      Variables
   Model     Entered       Removed           Method
   1       biaya a
                                       .    Enter
           promosi
     a. All requested variables entered.
     b. Dependent Variable: volume penjualan


bagian ini menjelaskan tentang variabel yang dimasukkan dimana semua
variabel adalah variabel biaya promosi sedangkan yang dikeluarkan
variabel volume penjualan.


                        Model Summaryb


                                           Adjusted        Std. Error of
   Model       R        R Square           R Square        the Estimate
   1            .994a       .987                .986         101.75635
     a. Predictors: (Constant), biaya promosi
     b. Dependent Variable: volume penjualan


pada nilai R, R square, adjusted dan std. error,dimana nilai R nya 0.994
merupakan indeks determinasi yakni prosentase yang menyumbangkan
pengaruh X terhadap Y.
                                                ANOVAb

                             Sum of
   Model                    Squares             df           Mean Square             F         Sig.
   1       Regression       10533881                   1     10533881.39          1017.338        .000a
           Residual         134606.6                  13       10354.355
           Total            10668488                  14
     a. Predictors: (Constant), biaya promosi
     b. Dependent Variable: volume penjualan


nilai F sebesar 1017.338dengan tingkat sig. 0.000 menunjukan bahwa
terdapat pengaruh X terhadap Y dengan sangat nyata.
                                               Coefficientsa

                                 Unstandardized                 Standardized
                                   Coefficients                 Coefficients
   Model                          B        Std. Error               Beta               t          Sig.
   1       (Constant)           454.582       67.709                                   6.714         .000
           biaya promosi          1.394         .044                       .994       31.896         .000
     a. Dependent Variable: volume penjualan
tingkat korelasi antara biaya promosi dan volume penjualan. harga
454.582 merupakan nilai konstanta yang menunjukkan bahwa tidak da
pengeluaran biaya promosi maka tingkat penjualan mencapai 454 buah
tas sedangkan harga 1.394 X merupakan koefisien regresi yang
menunjukkan bahwa setiap adanya upaya penambahan sebesar Rp.1
untuk biaya promosi maka akan ada kenaikan sebesar 1.394. angka 0.994
pada std. coefisient menunjukkan


                                      Residuals Statisticsa

                               Minimum     Maximum        Mean       Std. Deviation   N
   Predicted Value            1151.4093    3924.7830    2445.0000       867.42152         15
   Std. Predicted Value           -1.491       1.706         .000            1.000        15
   Standard Error of
                                 26.846        53.317      36.313            8.146        15
   Predicted Value
   Adjusted Predicted Value   1169.2913    4031.8005    2451.3119       874.90819         15
   Residual                    -282.783    108.33142       .00000        98.05487         15
   Std. Residual                 -2.779        1.065          .000           .964         15
   Stud. Residual                -3.263        1.146         -.028          1.092         15
   Deleted Residual            -389.801    126.29825     -6.31189       126.37610         15
   Stud. Deleted Residual        -7.366        1.161         -.298          2.052         15
   Mahal. Distance                 .041        2.910          .933           .855         15
   Cook's Distance                 .000        2.014          .165           .513         15
   Centered Leverage Value         .003         .208          .067           .061         15
     a. Dependent Variable: volume penjualan


Charts
Histogram


                        Dependent Variable: volume penjualan


            5


            4
Frequency


            3


            2


            1


                                                               Mean = 2.25E-15
                                                               Std. Dev. = 0.964
            0                                                  N = 15
                -3     -2       -1       0        1     2

                     Regression Standardized Residual
Normal P-P Plot of Regression Standardized Residual


                        Dependent Variable: volume penjualan
                        1.0


                        0.8
    Expected Cum Prob


                        0.6


                        0.4


                        0.2


                        0.0
                              0.0   0.2       0.4    0.6      0.8   1.0

                                          Observed Cum Prob
Scatterplot


                                       Dependent Variable: volume penjualan

                   4000.00


                   3500.00
volume penjualan


                   3000.00


                   2500.00


                   2000.00


                   1500.00


                   1000.00

                             1000.00           2000.00                 3000.00      4000.00

                                          Regression Adjusted (Press) Predicted Value

More Related Content

Featured

2024 State of Marketing Report – by Hubspot
2024 State of Marketing Report – by Hubspot2024 State of Marketing Report – by Hubspot
2024 State of Marketing Report – by HubspotMarius Sescu
 
Everything You Need To Know About ChatGPT
Everything You Need To Know About ChatGPTEverything You Need To Know About ChatGPT
Everything You Need To Know About ChatGPTExpeed Software
 
Product Design Trends in 2024 | Teenage Engineerings
Product Design Trends in 2024 | Teenage EngineeringsProduct Design Trends in 2024 | Teenage Engineerings
Product Design Trends in 2024 | Teenage EngineeringsPixeldarts
 
How Race, Age and Gender Shape Attitudes Towards Mental Health
How Race, Age and Gender Shape Attitudes Towards Mental HealthHow Race, Age and Gender Shape Attitudes Towards Mental Health
How Race, Age and Gender Shape Attitudes Towards Mental HealthThinkNow
 
AI Trends in Creative Operations 2024 by Artwork Flow.pdf
AI Trends in Creative Operations 2024 by Artwork Flow.pdfAI Trends in Creative Operations 2024 by Artwork Flow.pdf
AI Trends in Creative Operations 2024 by Artwork Flow.pdfmarketingartwork
 
PEPSICO Presentation to CAGNY Conference Feb 2024
PEPSICO Presentation to CAGNY Conference Feb 2024PEPSICO Presentation to CAGNY Conference Feb 2024
PEPSICO Presentation to CAGNY Conference Feb 2024Neil Kimberley
 
Content Methodology: A Best Practices Report (Webinar)
Content Methodology: A Best Practices Report (Webinar)Content Methodology: A Best Practices Report (Webinar)
Content Methodology: A Best Practices Report (Webinar)contently
 
How to Prepare For a Successful Job Search for 2024
How to Prepare For a Successful Job Search for 2024How to Prepare For a Successful Job Search for 2024
How to Prepare For a Successful Job Search for 2024Albert Qian
 
Social Media Marketing Trends 2024 // The Global Indie Insights
Social Media Marketing Trends 2024 // The Global Indie InsightsSocial Media Marketing Trends 2024 // The Global Indie Insights
Social Media Marketing Trends 2024 // The Global Indie InsightsKurio // The Social Media Age(ncy)
 
Trends In Paid Search: Navigating The Digital Landscape In 2024
Trends In Paid Search: Navigating The Digital Landscape In 2024Trends In Paid Search: Navigating The Digital Landscape In 2024
Trends In Paid Search: Navigating The Digital Landscape In 2024Search Engine Journal
 
5 Public speaking tips from TED - Visualized summary
5 Public speaking tips from TED - Visualized summary5 Public speaking tips from TED - Visualized summary
5 Public speaking tips from TED - Visualized summarySpeakerHub
 
ChatGPT and the Future of Work - Clark Boyd
ChatGPT and the Future of Work - Clark Boyd ChatGPT and the Future of Work - Clark Boyd
ChatGPT and the Future of Work - Clark Boyd Clark Boyd
 
Getting into the tech field. what next
Getting into the tech field. what next Getting into the tech field. what next
Getting into the tech field. what next Tessa Mero
 
Google's Just Not That Into You: Understanding Core Updates & Search Intent
Google's Just Not That Into You: Understanding Core Updates & Search IntentGoogle's Just Not That Into You: Understanding Core Updates & Search Intent
Google's Just Not That Into You: Understanding Core Updates & Search IntentLily Ray
 
Time Management & Productivity - Best Practices
Time Management & Productivity -  Best PracticesTime Management & Productivity -  Best Practices
Time Management & Productivity - Best PracticesVit Horky
 
The six step guide to practical project management
The six step guide to practical project managementThe six step guide to practical project management
The six step guide to practical project managementMindGenius
 
Beginners Guide to TikTok for Search - Rachel Pearson - We are Tilt __ Bright...
Beginners Guide to TikTok for Search - Rachel Pearson - We are Tilt __ Bright...Beginners Guide to TikTok for Search - Rachel Pearson - We are Tilt __ Bright...
Beginners Guide to TikTok for Search - Rachel Pearson - We are Tilt __ Bright...RachelPearson36
 

Featured (20)

2024 State of Marketing Report – by Hubspot
2024 State of Marketing Report – by Hubspot2024 State of Marketing Report – by Hubspot
2024 State of Marketing Report – by Hubspot
 
Everything You Need To Know About ChatGPT
Everything You Need To Know About ChatGPTEverything You Need To Know About ChatGPT
Everything You Need To Know About ChatGPT
 
Product Design Trends in 2024 | Teenage Engineerings
Product Design Trends in 2024 | Teenage EngineeringsProduct Design Trends in 2024 | Teenage Engineerings
Product Design Trends in 2024 | Teenage Engineerings
 
How Race, Age and Gender Shape Attitudes Towards Mental Health
How Race, Age and Gender Shape Attitudes Towards Mental HealthHow Race, Age and Gender Shape Attitudes Towards Mental Health
How Race, Age and Gender Shape Attitudes Towards Mental Health
 
AI Trends in Creative Operations 2024 by Artwork Flow.pdf
AI Trends in Creative Operations 2024 by Artwork Flow.pdfAI Trends in Creative Operations 2024 by Artwork Flow.pdf
AI Trends in Creative Operations 2024 by Artwork Flow.pdf
 
Skeleton Culture Code
Skeleton Culture CodeSkeleton Culture Code
Skeleton Culture Code
 
PEPSICO Presentation to CAGNY Conference Feb 2024
PEPSICO Presentation to CAGNY Conference Feb 2024PEPSICO Presentation to CAGNY Conference Feb 2024
PEPSICO Presentation to CAGNY Conference Feb 2024
 
Content Methodology: A Best Practices Report (Webinar)
Content Methodology: A Best Practices Report (Webinar)Content Methodology: A Best Practices Report (Webinar)
Content Methodology: A Best Practices Report (Webinar)
 
How to Prepare For a Successful Job Search for 2024
How to Prepare For a Successful Job Search for 2024How to Prepare For a Successful Job Search for 2024
How to Prepare For a Successful Job Search for 2024
 
Social Media Marketing Trends 2024 // The Global Indie Insights
Social Media Marketing Trends 2024 // The Global Indie InsightsSocial Media Marketing Trends 2024 // The Global Indie Insights
Social Media Marketing Trends 2024 // The Global Indie Insights
 
Trends In Paid Search: Navigating The Digital Landscape In 2024
Trends In Paid Search: Navigating The Digital Landscape In 2024Trends In Paid Search: Navigating The Digital Landscape In 2024
Trends In Paid Search: Navigating The Digital Landscape In 2024
 
5 Public speaking tips from TED - Visualized summary
5 Public speaking tips from TED - Visualized summary5 Public speaking tips from TED - Visualized summary
5 Public speaking tips from TED - Visualized summary
 
ChatGPT and the Future of Work - Clark Boyd
ChatGPT and the Future of Work - Clark Boyd ChatGPT and the Future of Work - Clark Boyd
ChatGPT and the Future of Work - Clark Boyd
 
Getting into the tech field. what next
Getting into the tech field. what next Getting into the tech field. what next
Getting into the tech field. what next
 
Google's Just Not That Into You: Understanding Core Updates & Search Intent
Google's Just Not That Into You: Understanding Core Updates & Search IntentGoogle's Just Not That Into You: Understanding Core Updates & Search Intent
Google's Just Not That Into You: Understanding Core Updates & Search Intent
 
How to have difficult conversations
How to have difficult conversations How to have difficult conversations
How to have difficult conversations
 
Introduction to Data Science
Introduction to Data ScienceIntroduction to Data Science
Introduction to Data Science
 
Time Management & Productivity - Best Practices
Time Management & Productivity -  Best PracticesTime Management & Productivity -  Best Practices
Time Management & Productivity - Best Practices
 
The six step guide to practical project management
The six step guide to practical project managementThe six step guide to practical project management
The six step guide to practical project management
 
Beginners Guide to TikTok for Search - Rachel Pearson - We are Tilt __ Bright...
Beginners Guide to TikTok for Search - Rachel Pearson - We are Tilt __ Bright...Beginners Guide to TikTok for Search - Rachel Pearson - We are Tilt __ Bright...
Beginners Guide to TikTok for Search - Rachel Pearson - We are Tilt __ Bright...
 

Hubungan Biaya dan Penjualan

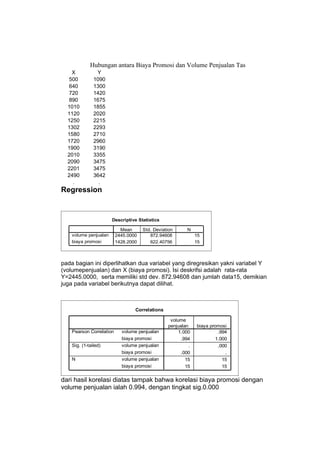
  • 1. Hubungan antara Biaya Promosi dan Volume Penjualan Tas X Y 500 1090 640 1300 720 1420 890 1675 1010 1855 1120 2020 1250 2215 1302 2293 1580 2710 1720 2960 1900 3190 2010 3355 2090 3475 2201 3475 2490 3642 . . Regression Descriptive Statistics Mean Std. Deviation N volume penjualan 2445.0000 872.94608 15 biaya promosi 1428.2000 622.40756 15 pada bagian ini diperlihatkan dua variabel yang diregresikan yakni variabel Y (volumepenjualan) dan X (biaya promosi). Isi deskrifsi adalah rata-rata Y=2445.0000, serta memiliki std dev. 872.94608 dan jumlah data15, demikian juga pada variabel berikutnya dapat dilihat. Correlations volume penjualan biaya promosi Pearson Correlation volume penjualan 1.000 .994 biaya promosi .994 1.000 Sig. (1-tailed) volume penjualan . .000 biaya promosi .000 . N volume penjualan 15 15 biaya promosi 15 15 dari hasil korelasi diatas tampak bahwa korelasi biaya promosi dengan volume penjualan ialah 0.994, dengan tingkat sig.0.000
  • 2. Variables Entered/Removedb Variables Variables Model Entered Removed Method 1 biaya a . Enter promosi a. All requested variables entered. b. Dependent Variable: volume penjualan bagian ini menjelaskan tentang variabel yang dimasukkan dimana semua variabel adalah variabel biaya promosi sedangkan yang dikeluarkan variabel volume penjualan. Model Summaryb Adjusted Std. Error of Model R R Square R Square the Estimate 1 .994a .987 .986 101.75635 a. Predictors: (Constant), biaya promosi b. Dependent Variable: volume penjualan pada nilai R, R square, adjusted dan std. error,dimana nilai R nya 0.994 merupakan indeks determinasi yakni prosentase yang menyumbangkan pengaruh X terhadap Y. ANOVAb Sum of Model Squares df Mean Square F Sig. 1 Regression 10533881 1 10533881.39 1017.338 .000a Residual 134606.6 13 10354.355 Total 10668488 14 a. Predictors: (Constant), biaya promosi b. Dependent Variable: volume penjualan nilai F sebesar 1017.338dengan tingkat sig. 0.000 menunjukan bahwa terdapat pengaruh X terhadap Y dengan sangat nyata. Coefficientsa Unstandardized Standardized Coefficients Coefficients Model B Std. Error Beta t Sig. 1 (Constant) 454.582 67.709 6.714 .000 biaya promosi 1.394 .044 .994 31.896 .000 a. Dependent Variable: volume penjualan
  • 3. tingkat korelasi antara biaya promosi dan volume penjualan. harga 454.582 merupakan nilai konstanta yang menunjukkan bahwa tidak da pengeluaran biaya promosi maka tingkat penjualan mencapai 454 buah tas sedangkan harga 1.394 X merupakan koefisien regresi yang menunjukkan bahwa setiap adanya upaya penambahan sebesar Rp.1 untuk biaya promosi maka akan ada kenaikan sebesar 1.394. angka 0.994 pada std. coefisient menunjukkan Residuals Statisticsa Minimum Maximum Mean Std. Deviation N Predicted Value 1151.4093 3924.7830 2445.0000 867.42152 15 Std. Predicted Value -1.491 1.706 .000 1.000 15 Standard Error of 26.846 53.317 36.313 8.146 15 Predicted Value Adjusted Predicted Value 1169.2913 4031.8005 2451.3119 874.90819 15 Residual -282.783 108.33142 .00000 98.05487 15 Std. Residual -2.779 1.065 .000 .964 15 Stud. Residual -3.263 1.146 -.028 1.092 15 Deleted Residual -389.801 126.29825 -6.31189 126.37610 15 Stud. Deleted Residual -7.366 1.161 -.298 2.052 15 Mahal. Distance .041 2.910 .933 .855 15 Cook's Distance .000 2.014 .165 .513 15 Centered Leverage Value .003 .208 .067 .061 15 a. Dependent Variable: volume penjualan Charts
  • 4. Histogram Dependent Variable: volume penjualan 5 4 Frequency 3 2 1 Mean = 2.25E-15 Std. Dev. = 0.964 0 N = 15 -3 -2 -1 0 1 2 Regression Standardized Residual
  • 5. Normal P-P Plot of Regression Standardized Residual Dependent Variable: volume penjualan 1.0 0.8 Expected Cum Prob 0.6 0.4 0.2 0.0 0.0 0.2 0.4 0.6 0.8 1.0 Observed Cum Prob
  • 6. Scatterplot Dependent Variable: volume penjualan 4000.00 3500.00 volume penjualan 3000.00 2500.00 2000.00 1500.00 1000.00 1000.00 2000.00 3000.00 4000.00 Regression Adjusted (Press) Predicted Value