1. FEATURE
After the Recession:
Florida, Nevada, Arizona, and
the Next 5,000 Days
BY OWEN BEITSCH, PH.D., CRE, FAICP
To daTe, whaT has been wriTTen abouT The real esTaTe country. like these states, many areas large and small have
industry and its association with the current recession has experienced extraordinary growth and are left to weigh
centered primarily on the flow of capital and its impact the longer-term implications of a housing market that
on yields, lending practices and the valuation of real seems grossly overbuilt and reluctant to respond.
estate.1,2,3,4,5 accordingly, on aug. 3, 2010, Jay Marling,
editor in chief of The Counselor, solicited opinions of The To illustrate the dimensions of the problem, Florida
Counselors of real estate (Cre) membership via email remains one of the country’s fastest-growing states and
regarding current united states fiscal policy, unemploy- has been on a trajectory to overtake new York, the
ment, the current availability of real estate financing, nation’s third-ranked state, no later than 2015. suddenly
pricing, and cap rates. that timetable, and its need for housing to accommodate
that growth, is askew. in 2008, for the first time since
with some obvious exceptions, it is notable how little has 1940, the number of persons exiting Florida was greater
been written about the actual use of real estate. The
than the number of persons entering Florida, resulting in
industry’s scrutiny of financial metrics has taken primacy
decreased population estimates for 2009.6,7,8 For this and
over many fundamental social and demographic influ-
other reasons, the bureau of economic and business
ences underlying the basic need for or the utility of real
research (bebr) at the university of Florida has
estate. because these social and demographic forces have
modified its long-term population projections which
economic consequences, they ultimately affect the need
now show slowing rates of growth through 2035. in fact,
for capital. if these are structural in form, they presage
our entire decision making and planning processes, not future population counts in 39 of the state’s 67 counties
just locally but at a macroeconomic level, much as the could fall below those of the 2007 projections.9 The u.s.
change in the 1986 tax code forced passive investors to Census bureau (usCb) estimates an inconsequential
evaluate all their interests in real estate as an asset class. 0.61 percent increase, rather than a decline, for the
with the recession now deemed to have ended in 2009, it
will have exceeded, by many months, those that occurred About the Author
in the 1970s and 1980s, with extraordinary disruptions to Owen Beitsch, Ph.D., CRE, AICP, is a
the housing market. while the needs of the commercial principal with Real Estate Research Consultants,
Orlando, Florida, a firm offering various economic
real estate industry are emerging, residential property is
and planning services to both public and private
of particular interest because it so badly lags other clients with substantial real property assets or
economic indicators. engaged in policy or strategic matters dependent
upon the deployment of such assets. He is adjunct
nevada, arizona and, especially, Florida offer a laboratory faculty at the University of Central Florida and a research associate in the
for examining some of the social, economic and political college's department of public affairs.
conditions that may have relevance to other areas of the
REAL ESTATE ISSUES 49 Volume 3 5 , Nu mber 2 , 2 01 0
2. FEATURE
After the Recession: Florida, Nevada, Arizona, and the Next 5,000 Days
2008–2009 time period. Thematically, even if these capital have a motivation to find locations more favor-
differences underscore the variability in population, the able to their residential purchases as either residents or
numbers speak to major change. investors. a recent Case-shiller index provides no expec-
tation that low pricing offers immediate rewards in
should Florida’s sudden population contraction be
several markets covered by the report, pessimistically
evidence of a structural shift, the industry’s expectations
forecasting value recovery as late as 2020 in Jacksonville,
about real estate needs over the long term may require
2039 in orlando and 2020 in Tucson.12 in the case of las
adjustment in analysis or scale. Much less threatening, the
Vegas, values have fallen 56.1 percent from their peak;
contraction may represent nothing more than an
Miami 47.3 percent; and Phoenix 50.7 percent. a well-
unpleasant but forgiving and manageable temporary
timed purchase in Phoenix may bring rewards there
disruption. because so much of the value implicit in real
since year-to-year (2009–2010) values have increased
estate is tied to job or population growth occurring across
about 5.4 percent. in both Miami and las Vegas, values
broad regions, it is worth (re)examining basic socio-
have only fallen further.13
economic data suggestive of immediate and future
impacts, if any. Much of the unemployment experienced in these high
growth settings is centered on the construction trades,
without doubt, the supply of vacant residential product is
certain segments of the tourism or gambling industries
at a historic high, juiced by builders looking for record
and professions tied to the planning, design or implemen-
profits, buyers looking for quick returns, and financial
tation of development. The construction jobs, in partic-
markets ostensibly looking at very little. The conse-
ular, are unlikely to be replaced for many years but the
quences of this housing overhang, however, invite varied
troubles are deeper. even senior and established
perspectives. The extreme view is that the economy has
employees have proven vulnerable. in a less severe
changed and, along with it, the way we deploy and value
downturn, substitute employment may have been avail-
shelter. adjustments to policy may fall well behind
able locally for the most capable of these workers. These
consumer response.
three troubled states, however, have not shown
CURRENT STATE OF THE ECONOMY themselves as a safe haven for the legions of unemployed
There seems to be little question that much of the slowing workers that might have worked to build their futures
migration into once rapidly growing Florida, nevada and there. as suggested by the population counts in Florida, a
arizona stems largely from economic constraints that number have instead returned to their home states where
together limit individual mobility.10 almost overnight, they have family and social infrastructure, even if they
these states show the scars of development dependent have no jobs.
upon growth and movement.
despite efforts to diversify, the options for skilled or
economic conditions in the past made these population technical labor in these former boom states remain
centers very attractive in the context of their neighbors. limited, discouraging talented newcomers and forcing out
over a period of thirty years, migrant populations carried those that might otherwise stay. nothing illustrates this
housing equity to these areas. equity dollars seeded reset- prospective economic dislocation better than nasa’s
tlement, often without concern for a specific job opportu- termination of the shuttle program in Florida. The end of
nity. as the data continue to demonstrate, it is difficult to shuttle operations may release thousands of highly
release equity from an existing homestead in another state trained technicians and scientists with few industries
where home prices have also flattened or declined. nearby to absorb them.14,15
although conditions are better in arizona, the jobless
For the foreseeable future, management will emphasize
rate in nevada and Florida materially exceeds the
increased worker productivity, not materially increased
national level of unemployment for the first time in
employment. such decisions will only slow recovery in
decades. To establish context, although unemployment is
the south where, according to the bureau of labor
also high in Michigan, Florida shed nearly twice the
statistics (bls), news is grim. The bls reports that
number of jobs lost in that state.11
Georgia, Florida and arizona were among the five biggest
because these same three states lead in the rate of losers of jobs from 2007–2009.16 altogether, they shed
foreclosures, prospective newcomers with available almost 1,300,000 jobs during these years.17
REAL ESTATE ISSUES 50 Volume 35 , Nu mber 2 , 2 0 10
3. FEATURE
After the Recession: Florida, Nevada, Arizona, and the Next 5,000 Days
To regain anywhere near the levels of employment budgetary and political problems, has the advantages of a
achieved prerecession will necessitate that phenomenal mature economy.
numbers of jobs be created. The scale is difficult to grasp.
states such as oregon and California offer the prospect
in Florida alone, some 700,000–800,000 jobs would have
that some sectors will show improving financial condi-
to be created to reach full employment. assuming no
tion, though others are slower to respond. These states
change in the current labor force or population, this
provide an economic base sufficiently diverse and
number is more than twice the number of jobs created in
positioned to diversify further still. despite their troubles
2005. in retrospect, the number of jobs realized in 2005 they maintain an attractive advantage. by contrast, the
seems an anomaly—exceeding the previous year by more business models of Florida and nevada, drawing largely
than 80,000.18 even with the recession ending, it is sure to on a narrow class of jobs, do not offer comparable
be painful for those needing a job. promise for the future.
Counter arguments offer the prospect that technical AGING OF THE POPULATION
talent, such as that separated from nasa, will be The population is already rethinking the age of retire-
redirected into self-employment and research opportuni- ment, which may be a forced decision should benefits
ties. This will seed future economic expansion. while job available through social security be altered or postponed
growth in the u.s. will likely remain concentrated among to a more advanced age. Commensurate with retirement,
small employers, they have also shed a disproportionate substantial segments of the population have traditionally
number of workers according to some reports.19 any elected to choose states other than their own for their
beneficial effects coming from new businesses will senior years.
require a period of time to extend across the regional
economy in a manner that job and population growth are as the decision to retire is delayed, so are the large
movements that dominated the historical rates of growth
sustained. The credit outlook dims this prospect. because
in Florida, nevada and arizona.20 among its southern
banks, the primary source of loans to small businesses,
neighbors, Florida had proved itself especially attractive,
and venture funds, an important source of entrepre-
but this preference is showing signs of weakness.
neurial support, are themselves in retrenchment, the
Currently, Tennessee, Georgia and north Carolina are
desirable impacts stemming from these potential new
showing increases because they are aggressively recruiting
operations will take much longer.
retired populations as a matter of policy.21 in the west,
EMPLOYMENT DIVERSITY Colorado, idaho and utah also have experienced very
during prior recessions, economic conditions in Florida high rates of retirement age migration.
and nevada seemed brighter than they were elsewhere.
The decision to postpone retirement and move to another
Jobs requiring marginal education were relatively quick to location has many influencing factors. it is, at least in
form and easy to fill. Perceptions about opportunity lured part, dependent upon one’s ability to convert the
economic migrants so local unemployment rates were low homestead into a source of capital for a new residence,
compared to those elsewhere. often anticipated to be debt-free. renters are spared the
interestingly, oregon—the Portland area in particular, stress of selling a home prior to moving. homeowners
which is often held up as a model of growth and financial necessarily must partner with other people wishing to
responsibility—is experiencing its own economic acquire their existing homestead.
meltdown despite its strong employment diversification. Generally, the pairing of retirees and buyers has usually
in terms of reengineering its economy, oregon offers been necessitated by demands stemming from upward
employment and wealth opportunities that are the envy of mobility and increasing family size. in the past, this
the boom states, but even oregon has its problems: The arrangement worked well, as the aging world war ii
unemployment rate (February, preliminary) is 11.4 population (in control of larger homes and seeking
percent, comparable to Florida’s. although explanations release from their mortgage obligations) transacted with
for oregon’s job losses remain conjectural, the state’s the baby boomers (in need of residential units more
many economic dimensions appear to offer varied suited to their family size and incomes). since this world
avenues to recovery. even California, struggling with its war ii group of homeowners was significantly smaller
REAL ESTATE ISSUES 51 Volume 3 5 , Nu mber 2 , 2 01 0
4. FEATURE
After the Recession: Florida, Nevada, Arizona, and the Next 5,000 Days
than the baby boom cohort, the former found it easy to The upshot of these size and population imbalances is
sell and to move, pushing housing prices upward as that many seniors simply will not be able to sell their
demand and supply reached equilibrium.22 homes and relocate to one of the traditional retirement
settings when they deem it time to stop working. where
Those older than 45 comprise the largest segment of the they are successful in selling their homes, the price
population. in the category of homeowners, this group of concession necessary to accomplish the transaction may
persons (64.3 percent), based on 2000 data from the not confer the intrinsic economic advantage expected
usCb, literally dwarfs the population falling into the with a home sale. For those, retirement may not be so
25–44 age group which in the past has been the most comfortable financially.
active home buying segment.23 detailed age segmentation
LOW TAXES, FAST GROWTH
may offer other conclusions but the gross comparisons
seem to identify many more potential sellers than buyers. only a handful of states have no income tax, with nevada
and Florida being among the least diverse in terms of
not only are the physical numbers of the active buying their financial resources to make government work. That
population seemingly lower, their housing needs are they would also be among the fastest growing and most
substantively different based on the size of household, troubled real estate markets hints at the lurking dangers
which is about half the size of the family started by their of sparking economic diversification by touting fiscal
parents. while recent trends toward larger single family conservatism while also ignoring required community
homes suggest otherwise, the only reasonable short-term investments. For years, Florida has refused to address the
justification for larger homes would be continued price imbalances among growth, services and financial
reductions to clear inventory. More rationally, over the resources. it is not surprising that in 2009 the Pew Center
longer term, a younger, smaller and potentially less on the states found Florida, arizona and nevada—along
affluent population seems likely to avoid a real estate with illinois, Michigan, new Jersey, oregon, rhode island
transaction resulting in a larger debt burden than its and wisconsin—to be at grave budgetary risk.26
actual needs require. over the last several decades, Florida’s combination of
Myers and Vidaurri have written thoughtfully on future warmer weather, lower housing prices generally, and a
housing needs based on age segmentation in the popula- lower tax burden proved very attractive to migrating
tion.24 They argue plausibly that age cohorts, as described populations. For the younger populations, home owner-
ship was deemed relatively affordable. For retiring
here, are much more fluid, that conventional compar-
populations, the state offered financial sanctuary by
isons of age groups may not be a suitable basis for
extending the resources of fixed or limited incomes.
projecting future housing requirements. They reason that
however, should the theoretical attractiveness of lower-
cohorts are indicative of a static condition. The problem
cost living be stripped away, replaced instead by
with this kind of analysis, as they observe, is much more
mounting bills for deficient services, Florida offers few
complicated.
advantages to leverage in the short term.
The issue however is not about measuring housing
like nevada and arizona, both foils for costly California,
demand broadly across the population. rather the Florida is a tax haven for residents in the nation’s northeast
challenge is to match a specific seller with a specific buyer, and Midwest regions who may be considering migrating to
releasing equity on terms that provide optimal benefit to a southern state. Compared with new York, new Jersey,
both, an outcome suspect whatever method is used to ohio, and Pennsylvania, which have been principal sources
analyze the problem. The complexities mount when the of in-migrants to this state over the last 10–15 years,
cultural differences in age groups, characterized by the Florida’s tax burden (measured in terms of dollars per
likes of urban theorist richard Florida, are presumed to capita) has ostensibly proven beneficial to individuals and
place less emphasis on the homestead.25 These differences businesses. Florida’s overall tax burden places the state
may be even more pronounced over the next several among the lowest relative to income.27 The most recent
years since the recession has exposed so many to the report ranks Florida overall at 47th, nevada 49th and
penalties, as well as the rewards, that can come with arizona 41st. For comparison, new Jersey and new York
home ownership. lead at first and second place respectively. in terms of its
REAL ESTATE ISSUES 52 Volume 35 , Nu mber 2 , 2 0 10
5. FEATURE
After the Recession: Florida, Nevada, Arizona, and the Next 5,000 Days
business environment, the foundation ranks Florida fifth, exchange rates as these conditions vary over time. in the
nevada fourth and arizona a more distant 29th. context of this article, it is probably not unreasonable to
assume these populations will continue to represent a
even with its low tax burden, Florida’s property taxes
buying segment but the numbers won’t themselves be
have been the subject of recurring news and political
sufficient to offset other lost opportunities. if anti-
attention. The Tax Foundation edges Florida up to 22nd
immigrant fervor builds in Florida, as it has in arizona,
place on this single measure.28 because property taxes
the economic consequences could be large.
seem so visible, the very public rancor directed toward
this levy may have discouraged future residents from For many american baby boomers approaching retire-
choosing Florida, certainly given other economic consid- ment age, seasonal or second homes in Florida, arizona
erations of a near-term concern. For those who believe and nevada are viewed as transitional homesteads,
their properties are now badly over-assessed relative to intended for eventual permanent residency. should the
their real value, tax relief is relatively slow to come since boomers be precluded or constrained from making a
property assessments often lag real activity in the market- seasonal purchase, they may never become permanent
place. residents in Florida or other states seen attractive for
retiree populations.
The focus Florida’s legislature has given to capping both
taxes and spending continues to draw attention to the how second homes function in these states as transitional
state’s poor management and fiscal practices.29 without units for the future population may be speculative. what
addressing the ideological merits of competing views, the seems assured is that the current turbulence in the finan-
consequences of ill-conceived or implemented policies cial markets will retard favorable mortgages for second
have not proven compatible with increased job growth and seasonal homes for all but the most qualified buyers.
even if they spur some population growth. if low taxes are different banks and investors, of course, have their own
the most potent measure of economic prosperity, Florida criteria within federal guidelines. among those criteria
would be a growth leader with its job and housing are their own internal standards for what comprise
systems quickly recovering. even the most ardent fiscal declining or failing markets. Many lenders—without
conservative can see the reverse is happening. doubt, the more conservative ones—have labeled Florida,
nevada and arizona as stressed markets, placing them at
THE IMPACT OF SEASONAL UNITS the higher end of the risk scale.
according to the usCb, about 20 percent of the nation’s
seasonal homes are located in high-growth nevada, Condominiums, as second or seasonal homes, pose a
Florida and arizona.30 by itself, Florida had more than 16 different set of problems for lenders and buyers.
percent of the nation’s seasonal homes, a percentage in Condominiums have underwriting criteria different from
excess of the state’s proportionate population. if time- that applied to single-family units, and now typically
shares are added to Florida’s count, the disproportion carry onerous conditions or terms, if prospective buyers
would be higher but their impact is not clear from the qualify at all.31 while mortgage guidelines speak to the
available data. investment preferences of individual institutions, these
lenders must stay within federal rules and regulations that
To reinvigorate the moribund economies of Florida and are already assuming draconian change.32
these other boom states, excesses in the seasonal housing
SALES VELOCITY
must also be cleared. They will be sold to users or
investors but many of the same considerations impacting The data available from the national association of
general mobility and housing choice affect the market for realTors® (nar) measure the speed and velocity of
sales without addressing the matter of occupancy. The
the state’s inventory of seasonal units as well as its perma-
latest reports show some slowing in sales activity but
nent housing stock. as with other forms of housing,
there have been sparks of interest, probably stemming
patterns of ownership elsewhere, financial resources and
from tax credits. From the standpoint of a beleaguered
relative cost are important determinants of second-home
lender or homeowner, a sale reported by nar is
purchases.
something of a victory. For the moment, set aside the
in Florida, many buyers will be from south america, downward pressure on prices that has occurred in the
taking advantage of strong growth or favorable currency course of this improving sales pace compared with a
REAL ESTATE ISSUES 53 Volume 3 5 , Nu mber 2 , 2 01 0
6. FEATURE
After the Recession: Florida, Nevada, Arizona, and the Next 5,000 Days
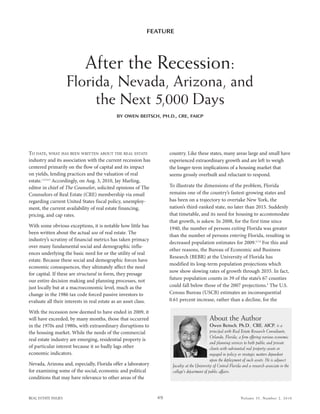
Figure 1
Annual Rental and Homeowner Vacancy Rates for the United States: 1968–2009
Percent
Recession
11
10
9
Retail Vacancy Rate
8
7
6
5
4
3
Homeowner Vacancy Rate
2
1
0
1968
1971
1974
1977
1980
1983
1986
1989
1992
1995
1998
2001
2004
2007
2009
Source for Recession Data: National Bureau of Economic Research, Inc., 1050 Massachusetts Ave., Cambridge, MA
Figure 2
Quarterly Rental and Homeowner Vacancy Rates for the United States: 1997–2009
Percent Recession
15
14
Gross Vacancy Rate
13
12
11
Rental Vacancy Rate
10
9
8
7
6
5
4
3 Homeowner Vacancy Rate
2
1
0
1Q1997 1Q1998 1Q1999 1Q2000 1Q2001 1Q2002 1Q2003 1Q2004 1Q2005 1Q2006 1Q2007 1Q2008 1Q2009
Source for Recession Data: National Bureau of Economic Research, Inc., 1050 Massachusetts Ave., Cambridge, MA
badly depressed past year. it is evident that the volume of different from the 3rd quarter (11.1 percent).33 among
transactions is not having the hoped for effect on overall homes intended for owner occupancy, the 2.7 percent
vacancy rates. They remain virtually unchanged for the vacancy rate achieved in the 4th quarter of 2009 was not
rental and ownership inventories combined. statistically different from the 4th quarter 2008 or from
the 3rd quarter. nationwide, there are now almost two
The usCb reported that the nation’s rental vacancy rate million vacant units for sale despite the upturn in activity.
for the 4th quarter of 2009 was higher than the 4th as the graphs illustrate, the nation’s housing vacancy rates
quarter 2008 rate (10.1 percent), but not statistically have never been higher during other periods of recession.
REAL ESTATE ISSUES 54 Volume 35 , Nu mber 2 , 2 0 10
7. FEATURE
After the Recession: Florida, Nevada, Arizona, and the Next 5,000 Days
These trends and numbers offer perspective on Florida’s aversion of lenders requires that condominiums be
inventory and vacancies which are well above the average purchased for cash or with substantial down payments.
for the remainder of the u.s. in Florida, the 4th quarter ironically, the family or individual most suited to these
vacancy rate for the rental inventory was 15.3 percent. now lower priced units also will be the same family or
Three other states—arizona, Kentucky and alabama— individual who would most likely not have the cash
were higher.34 The 4th quarter rate for the ownership resources to make the purchase in the first place.
inventory was 4.1 percent in Florida. at the end of Consequently, units available for purchase are left to large
december 2009, nevada was the only other state with a investors whose bulk purchases remove inventory but
home ownership vacancy rate higher than Florida. further reduce values and prices. several examples in
Florida offer anecdotal evidence of these effects.38,39,40
The failure of the sales pace to clear the inventory of
vacant units suggests that a transfer of ownership is not in any case, the acquired condominium still must be
systematically matching an actual user with the unit in occupied, and the rising vacancy rates indicate occupan-
question. in some cases, bargain units acquired through cies are not improving at the moment. left unoccupied,
short sales or foreclosures may themselves subsequently and possibly moving into a state of permanent physical
become short sales or foreclosures. decline, these units may become uninhabitable. They
already are becoming a management concern as owners
CONDOMINIUMS AND THEIR IMPACT ON VALUES
and distressed owners clash over financial responsibilities
From 1968–2008, the detached single-family vacancy
of maintenance and upkeep.41
rate had rarely exceeded 1.7 percent, never exceeding
2.0 percent. at the end of the 4th quarter of 2009, the COMPETING STATES
rate had jumped to 2.3 percent, decreasing from 2.5 under now outdated assumptions, Florida was projected
percent for the same period in 2008. not surprising, to replace new York as the third largest state in just a few
multi-family units in larger, attached structures (those years. while it eventually will achieve that position, the
with five units or more) intended for home ownership population could reflect a different cultural or socioeco-
had higher vacancy rates, 9.2 percent, up from 8.4 nomic composition than once expected and, in the short
percent through the 3rd quarter and up for the same run, slowing growth offers little to abate the state’s supply
period in 2008.35 These are not the worst rates histori- of residential inventory.
cally but they combine with somewhat smaller struc-
For reasons cited, Florida’s preference as a haven for
tures to yield one of the worst overall occupancy rates.
retirees and second-homeowners is being challenged by
Though discrete data are lacking, given their physical
Georgia, north Carolina and Tennessee, among others.
configuration, these are likely to be largely condo-
because the economies of neighboring states have not
minium properties.
shown a dependency on these population segments, their
data from nar offer a glimpse into this segment of the housing inventories, even if excessive, have not been as
residential industry which anecdotally, over the past five badly overbuilt as in Florida. Consequently, their
years, has repositioned many urban projects and economic recovery is plausibly swifter. in the race for
settings.36 The nar data, as of late 2009, seem to indicate population stability, these other states—while not
that Florida remains disproportionately represented reaching Florida’s numbers—will become more attractive,
among those states with the most seriously deteriorating drawing some population away from Florida.
condominium markets.37 seven of the reported ten worst
at the same time, some 19 million total housing units in
declines are in major metropolitan areas within Florida.
the nation remain vacant. expressed in absolute numbers,
orlando is at the top of the list, suffering a 56 percent
the sum is a historic high. in this context, Florida does
decline in median sales price since 2008. not surprising,
retain certain locational advantages even as the disadvan-
the three other metro areas in the top ten are located in
tages must be acknowledged. still, the housing options
arizona and nevada, with las Vegas in the second
across the country reflecting style, price and location are
position.
far greater than they have ever been before because the
one factor contributing to crashing prices is the obvious levels of production achieved in the last four years were
difficulty in securing favorable mortgages. implicitly, the so extraordinarily high.
REAL ESTATE ISSUES 55 Volume 3 5 , Nu mber 2 , 2 01 0
8. FEATURE
After the Recession: Florida, Nevada, Arizona, and the Next 5,000 Days
VARIATIONS IN POPULATION PROJECTIONS offer the prospect of materially lower populations and
The bebr remains the state of Florida’s most recognized fewer household formations, certainly over a lengthy
source of projected population. arizona and nevada have planning horizon.43
similar resources that guide legislative initiatives and
SETTLEMENT PATTERNS
function as controls for the distribution of some funds.
while intuitively attractive, residents are not returning
in the case of Florida, statutory rules (9J-5) require that to the nation’s central cities on a massive scale. The data
the data be used to guide planning for the built environ- do not support these claims. The fact remains that
ment. The data are treated as immutable, not as a measure urbanizing trends are at best nascent, and it will require
of what could be. in the current economic environment, many years before a major shift in residential patterns
the limitations in the data may lead both investors and and work settings occurs. at the most basic level of
regulators to flawed decisions about the likely future, scrutiny, it is hard to conceive that the nation’s existing
especially if plans involve extremely large projects. These central cities, without unprecedented intensification,
have been the foundation of Florida’s residential growth. have adequate land to satisfy the need of the nation’s
expected population.
several forces are working to intervene in this calculus,
which has historically equated population with a according to nathaniel baum-snow of brown university,
prescribed number of housing units but it’s too early to there are substantive economic forces that tether industry,
determine the true effect. on one hand, the rate of house- workers and residents to the suburbs.44 because of avail-
hold formations is slowing due to a variety of social and able infrastructure, productivity has increased while
economic causes. These formations are producing smaller many firms have decentralized. baum notes in his recent
households, so a moderately increased number of units are paper that both jobs and residents from 1960–2000
still required, though the units themselves may be smaller continued to elect suburban locations at about the same
in size. on the other hand, among some ethnic groups, the rate, an option enabled partially by investments in infra-
growing number of extended families suggests that the structure, saving time and costs. despite claims and
housing inventory will expand at the rate below that of complaints to the contrary, the time metric is observable
population growth. This latter indicator, with its in a simple statistic: the mean commute by car is about 25
dampening effects on housing, is itself mitigated by the minutes.45 The commute by public transportation systems
high birth rate among these same populations. This higher require literally twice that amount of time.
birth rate would normally drive an increased rate of house- let’s be clear: the argument isn’t that a trend may not be
hold formations. forming. nor is it that policies enhancing urbanization or
Then there are the confounding reports coming from intensification are inappropriate. rather, conditions still
andrew hacker, a sociologist at Queens College of the largely favor the suburban form of development because
City university of new York, who claims a decline in the it is has certain efficiencies and scale, is compatible with
mainstream lifestyle choices and offers the capacity for
birth rate resulting from the recession.42 in 2007, the
growth. From the perspective of the user, it has the
number of births in the u.s. exceeded those during the
advantage of at least appearing to be far cheaper. because
baby boom. but last year there was a decline, according to
of their cost basis, dense urban dwellings are relatively
data from the national Center for health statistics.
inelastic in their pricing structure. They seem much less
specific to arizona and Florida’s rapid population trajecto-
likely to see the absolute declines in price now sweeping
ries, births declined in the former about 3 percent during
the nation’s outer rings where housing options abound.
2008, the first decrease since 1991 when there was also an
economic slowdown. in the beginning of 2009, there were The corollary is that the suburbs, even at their distance
7 percent fewer births than the year before. These and the cost of fuel, may recover more quickly than we
numbers follow the jobless rate which increased from imagine. Places like Florida with plentiful land, fully
5.5–8.7 percent over the same time period. entitled for development, may benefit.
These are obviously competing forces and trends but the THE PREFERRED PLACES
argument for smaller families and fewer households is is it possible to be more specific about the communities
especially compelling in the wake of the recession. if and locations in the u.s. where growth is likely to occur? if
hacker’s analysis holds, his sharply falling rates would the various considerations outlined in this article have
REAL ESTATE ISSUES 56 Volume 35 , Nu mber 2 , 2 0 10
9. FEATURE
After the Recession: Florida, Nevada, Arizona, and the Next 5,000 Days
merit, they hint that growth capacity may exist in some are particularly sobering. while it should not be inferred
locations but fall short in others. where growth pressures that claims are being made for a sudden, second
should be most evident are in those jurisdictions that have downturn, such an event is not an impossibility. indeed,
historically had the greatest growth simply because they this article is largely silent on the growing storm in the
can demonstrate stability and have a foundation capable of commercial marketplace.
supporting additional growth. More simply, unless
enough forces are in play to suggest that the nation’s
disrupted, growth will follow its current path.
suburbs, though they may be objectionable on many
Consider that the 50 largest of the nation’s census-desig- counts, will remain an integral part of the built environ-
nated metropolitan areas were all established many ment. Florida, for better or worse at this stage of its devel-
decades ago, and all but four continue to support growth opment history, is dominated by this pattern of activity
based on 2000 population counts.46 Viewed as relatively simply because the supply of newer housing necessary to
nascent urban communities, the metropolitan areas of support its large population has been sited there. The
southeast Florida (rank: 7), Tampa (rank: 19), Jacksonville needs of the future population, when matched to the
(rank: 40) and orlando (rank: 27) are all on this aging list character of today’s housing stock, may be somewhat
of significant commercial centers. debatable. Past rates of population growth, however, are
subsiding. This decline signals, at the very least, a need to
CONCLUSION
examine older ideas about the linkages between buyers
Fairly and correctly, other industry analysts will offer
and sellers. Many variables are working together to
their opinions concerning overlooked real estate trends or
dampen the rate of job and population expansion, some
market influences. some of these will deal with the
of which must be assumed as structural. without regard
function of the credit markets. obviously credit enables
to their location, we may simply need fewer homes to
real estate opportunities, whatever they are, to be realized.
accommodate the future population.
The trends described in this article, however, are substan-
tively more basic than matters associated with credit absent some cataclysmic event (hurricanes: new orleans)
markets that should themselves be responding to the or industry movement (disney: orlando), growth favors
dictates imposed by users of the nation’s real estate assets. settings where it has proven fertile over many years. in
The state of the economy evidences the credit markets the places where population growth is occurring, the
broadly ignored underlying demand. while locational suburbs seem better positioned because of cost, prece-
considerations have been discussed, preferences for dent, available supply, and simple preference. They have
particular forms of housing have been addressed only obvious locational advantages that policy cannot simply
minimally. but preferences have proven to be transitory. undo. as a result, the excess lot and home inventories
Too many houses or too many shopping centers, if may yet find buyers over time. Florida looks very attrac-
nothing else, results in misallocation of resources. tive weighed on this scale of variables.
The industry’s brokers, developers, builders, and econo- Most of the observations described in this article involve
mists will infer different interpretations of the trends long-term perspectives that the real estate industry is
that are identified. That too is fair, but overall those rarely willing or needs to address except for the most
mentioned have been discussed in terms of their costly or unusual projects. builders and developers rarely
relative advantages and disadvantages to lend have been able to contain themselves as the market shows
competing perspectives. even the faintest signs of moving forward. The observa-
tions summarized are not a substitute for careful and
accepting the likelihood of oversights or added interpre-
insightful evaluation of local market trends and influ-
tation, the trends outlined here give fewer reasons to be
ences, but these considerations might form the basis of an
optimistic than pessimistic and more reasons to be
initial checklist, again for larger projects in particular.
cautious. in the main, they lead to the worth in reexam-
ining conventional thinking. on balance, the evidence if the conditions described are not structural, they
reinforces that recovery will be slower rather than faster, absolutely affect each Florida community in the short
and the numbers necessary to right the market are far term nonetheless, in large measure because the state’s
bigger than many people fully appreciate. in this context, revenue structure is closely correlated to growth in the
Case-shiller’s outlook and the rate of employment growth real estate industry. This connection is a policy matter,
REAL ESTATE ISSUES 57 Volume 3 5 , Nu mber 2 , 2 01 0
10. FEATURE
After the Recession: Florida, Nevada, Arizona, and the Next 5,000 Days
not strictly a growth matter. 6. “Florida reports First Population decline since 1946,” bureau of
economic and business research, university of Florida, aug. 17,
There is scant evidence that the fiscal and job challenges 2009. retrieved april 6, 2010, from: http://74.125.45.132/search? q=
facing Florida and similarly constructed states will abate cache:nCGrZ9CwLswJ:www.bebr.ufl.edu/news/title-raw%255D-63+
bebr+population+declining+in+florida&cd=2&hl=en&ct=clnk&gl=us
in any immediately foreseeable time frame. Consequently,
this data might flag caution for other states with depend- 7. “an analysis of annual Migration Flows in Florida, 1980–2008.”
ence on very discrete industry sectors and large numbers bureau of economic and business research, university of Florida,
2010. retrieved april 6, 2010 from: www.bebr.ufl.edu/category/
of migrating retirees or seasonal residents. although
subject-index/population-trends.
neither arizona nor nevada have Florida’s level of
growth, investors eager to act there should observe this 8. Morello, Carol, “Census: Florida, nevada had More americans
Move out than in,” Washington Post, dec. 24, 2009. retrieved april
state’s struggles to regain stability. The comments in this 6, 2010 from: http://www.washingtonpost.com/wp-dyn/content/
article aptly apply to these states but the social cost is article/2009/12/23/AR2009122301412.html?hpid=topnewss
significantly lower because their populations are so much
9. “Projections of Florida Population by County, 2008–2035.” Florida
smaller. logically, the ideas outlined should relate to Population Studies, Vol. 42,153, bureau of economic and business
other states identified by Pew as also financially at risk. research, university of Florida, March 2008.
while economic conditions in the past made Florida, 10. “off the road: house Prices and Mobility,” The Economist, Vol. 394
nevada and arizona more attractive in the context of (8663), p. 22, Jan. 2, 2010.
their neighbors, the current circumstances do not favor 11. “Regional and State Employment and Unemployment,” bureau of
these states or their leisure industries. California has labor statistics (bls), March 2010. retrieved april 16, 2010, from:
some of the problems that Florida, nevada and arizona http://www.bls.gov/news.release/pdf/laus.pdf
also face. unlike these areas, it has a mature and diversi- 12. Case-shiller, “home Price insights: For Many u.s. Markets, the
fied economy that will cushion its current condition. The return to Peak home Prices will be a long, slow road,” Fiserv.
same should apply to oregon. april 8, 2010. retrieved april 14, 2010, from:
investors.fiserv.com/releasedetail.cfm?ReleaseID=457516.
new construction seems almost out of the question for 13. Case-shiller, “house Price indexes increase in May,” July 27, 2010.
many years in the boom states, so it is not without irony retrieved aug. 4, 2010, from: www.calculatedriskblog.com/
that lost real estate value, much of it concentrated largely 2010/07/case-shiller-house-price-indexes.html.
in suburban settings, may be the salvation bringing 14. halvorson, Todd, “obama unveiling Plan Thursday on space Coast
recovery. as a result of diminished development, well to add Jobs, revive orion,” april 14, 2010. retrieved april 17,
located properties, listed well below replacement, will 2010, from: http://www.tcpalm.com/news/2010/apr/14/obama-
look like good buys to astute purchasers. These properties unveiling-plan-thursday-on-space-coast-to/
should be the first to clear the market. Very patient capital 15. wFTV, “estimates: 23,000 Job losses on space Coast,” (news
in the most troubled settings will experience absolutely story), Feb. 26, 2010. retrieved april 12, 2010, from:
no limit to these other opportunities presented. www.wftv.com/news/22685258/detail.html
16. Kanell, Michael, “Georgia Job loss Fih worst in nation,” e
ENDNOTES
Atlanta Journal-Constitution, october 21, 2009. retrieved on april 6,
1. ackermann Matt, M., “reiT Yields Topped every equity sector,” 2010, from http://74.125.45.132/search?q=cache:KqNNxiGF-
American Banker, 2010, Vol. 175 (9), p. 7. k0J:www.ajc.com/business/georgia-job-loss-fih-168624.html+
georgia,+florida+,arizona+job+losses&cd=14&hl=en&ct=clnk&gl=us
2. hopkins, Cheyenne, “Majority of lenders Toughen Terms,”
American Banker, 2009, Vol. 174 (139), p. 16. 17. bls op. cit.
3. Kelly, h., “e Morphology of the Credit Crisis,” Real Estate Issues, 18. ibid.
Vol. 34 (3), pp. 14–24.
19. whitehouse, Mark, “Q&a: atlanta Fed’s altig on small business’s
4. levitin, adam, audrey Pavlov and susan wachter, “securitization: Potential to derail recovery,” The Wall Street Journal Digital
Cause or remedy of the Financial Crisis?” aug. 27, 2009, Network. retrieved on aug. 2, 2010, from:
Georgetown law and economics research Paper no. 1462895. http://blogs.wsj.com/economics/2010/03/11/qa-atlanata-feds-altig-on-
retrieved aug, 1, 2010, from: http://ssrn.com/abstract=1462895 small-businesss-potential-to-derail-recovery/
5. Morgan, John, "distressed debt reaches for Fair Value,” Money 20. Pollard, Kelvin and Mark Mather, “slower Growth of u.s.
Management Executive, Jan. 18, 2010, Vol. 18, (3), pp. 1–8. retirement destinations linked to economic downturn,” March
REAL ESTATE ISSUES 58 Volume 35 , Nu mber 2 , 2 0 10
11. FEATURE
After the Recession: Florida, Nevada, Arizona, and the Next 5,000 Days
2010. retrieved from the Population reference bureau on april 16, 34. ibid.
2010: http://74.125.45.132/search?q=cache:MUNwuhI69AYJ:
www.prb.org/Articles/2010/censusdata.aspx+Retirement%2BDestinati 35. ibid.
ons%2BLinked%2Bto%2BEconomic%2BDownturn&cd=1&hl=en&ct
36. ”Total sales with breakouts of single-Family and Condo/Co-op,”
=clnk&gl=us
national association of realtors, 2009. retrieved april 16, 2010,
21. sasso, Michael, “retiree Flow to Florida slows,” The Tampa Tribune, from: http://www.realtor.org/wps/wcm/connect/cc64300041d
dec. 20, 2007. retrieved april 4, 2010, from: 7e5f38bcbdb88f8e9afed/REL1002CD.xls?MOD=AJPERES&
http://www.retirementlivingnews.com/retireeflow.html CACHEID=cc64300041d7e5f38bcbdb88f8e9afed
22. Mcilwain, John, “housing in america: e next decade.” Paper 37. “Metropolitan area existing-home Prices and state existing-home
presented at uli Trustees Meeting Jan. 26, 2010. retrieved from sales 2009, national association of realtors. 2009. retrieved april
uli on april 6, 2010, from: http://www.uli.org/sitecore/content/ 12, 2010, from: www.realtor.org.
ULI2Home/ News/MediaCenter/ Press Releases/2010%20archives/
Content/~/media/Documents/ResearchAndPublications/Fellows/ 38. Fletcher, david, “Fractured Condo's bulk Purchase offer 'Price
McIlwain/HousinginAmerica.ashx averaging' window.” Realty Times, april 8, 2010. retrieved aug. 5,
2010, from: realtytimes.com/rtpages/ 20100408_ bulk.htm.
23. “Tenure by age of householder,” u.s. Census bureau. Table h-14,
2000. retrieved from the department of Commerce, u.s. Census 39. Miller, Kimberly K., “bulk buyer Picks up 106 Condos at boynton
bureau on april 9, 2010: http://factfinder.census.gov/servlet/ beach's bermuda Cay,” Palm Beach Post, July 15, 2010. retrieved
DTTable?_bm=y&-geo_id=01000US&-ds_name=DEC_2000_SF3_U on august 5, 2010 from: http://www.palmbeachpost.com/
&-_lang=en&-redoLog=false&-mt_name=DEC_2000_SF3_U_ money/real-estate/
H014&-format=&-CONTEXT=dt
40. Valens, Jorge, “deal said to be largest bulk Purchase of Condos in
24. Myers, dowell and lonnie Vidaurri, “real demographics of lauderdale,” Sun Sentinel, July 9, 2010. retrieved aug. 5, 2010 from:
housing demand in the united states,” Lusk Review for Real Estate http://articles.sun-sentinel.com/2010-07-09/business/fl-las-olas-
Development and Urban Transformation. summer 1996, pp. 55–61. condos-20100709_1_condo-units-two-and-three-bedroom-units-
consulting-firm-condo-vultures
25. Florida, richard, “how the Crash will reshape america.” Atlantic.
(electronic version), March 2009. retrieved March 12, 2010, from: 41. “state of distress: Florida Community association Mortgage
http://www.theatlantic.com/magazine/archive/2009/03/how-the- Foreclosures spawn Crisis within state's Condo and hoa
crash-will-reshape-america/ Population,” Community association leadership lobby, Feb. 24,
2009. retrieved on aug. 3, 2010, from: http://www.marketwire.com/
26. Vock, daniel, Pamela Prah, stephen Freh, et al. “beyond California:
press-release/State-Distress-Florida-Community-Association-
states in Fiscal Peril.” Monograph. Philadelphia: Pew Center on the
Mortgage-Foreclosures-Spawn-Crisis-Within-953450.htm
States. retrieved March 2, 2010, from:
http://downloads.pewcenteronthestates.org/BeyondCalifornia.pdf 42. roberts, sam, “birth rate is said to Fall as a result of recession,”
27. “Facts & Figures: how does your state compare?” Tax Foundation, New York Times, aug. 6, 2009. retrieved april 12, 2010, from:
2010. retrieved on aug. 6, 2010, from: http://www.nytimes.com/2009/08/07/us/07births.html?
http://www.taxfoundation.org/publications/show/2181.html
43. ibid.
28. ibid.
44. baum-snow, nathaniel, “Changes in Transportation infrastructure
29. Vock d., Prah C., Freh, s., et al. “beyond California: states in Fiscal and Commuting Patterns in u.s. Metropolitan areas 1960–2000,”
Peril.” Monograph. Philadelphia: Pew Center on the States, 2010. Paper presented at the american economic association,
november 2009. 2010. retrieved april 9, 2010, from:
http://www.econ.brown.edu/fac/Nathaniel_ Baum-Snow/aer_
30. “housing units,” American Community Survey. Table B2500, u.s. pandp_baumsnow.pdf
Census bureau, 2006–2008. retrieved from the department of
Commerce, u.s. Census bureau on april 9, 2010: 45. u.s. Census bureau. (2005–2007). american Community survey.
http://www.census.gov/acs/www/index.html Table b01003 Total Population; Table b08136 aggregate Travel
Time to work of workers (16 or older) by Means of Transportation
31. smith, Jed, “economist’s Commentary: realtor’s Confidence index.”
to work; Table b08301 Means of Transportation to work [16 and
retrieved on July 17, 2010: http://notes.rets.org/research/
older]. retrieved sept. 2, 2009, from:
economists_outlook/commentaries/rci0110
http://www.debunkingportland.com/docs/ACS_UZA_Major_City-
32. ibid. _Commute_2005_07a.xls
33. “housing Vacancies and homeownership,” u.s. Census bureau, Feb. 46. lang, rob, Mariela alfonzo, and Casey dawkins, “american
2, 2010. retrieved from the department of Commerce, u.s. Census demographics - Circa 2109.” Planning. (electronic version), May
bureau on april 9, 2010: 2009. retrieved March 11, 2010, from: http://www.planning.org/
www.census.gov/hhes/www/housing/hvs/qtr409/q409ind.html planning/%20%202009/may/demographics2109.htm
REAL ESTATE ISSUES 59 Volume 3 5 , Nu mber 2 , 2 01 0