
Empfohlen

Empfohlen
Weitere ähnliche Inhalte
Was ist angesagt?
Was ist angesagt? (18)
Andere mochten auch
Andere mochten auch (20)
Ähnlich wie Empirical research methods poster
Ähnlich wie Empirical research methods poster (20)
Mehr von Gregor Polančič
Mehr von Gregor Polančič (12)
Kürzlich hochgeladen
Kürzlich hochgeladen (20)
Empirical research methods poster
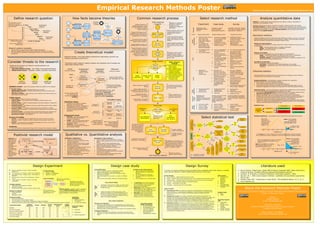
- 1. Empirical Research Methods Poster Check for the latest version at: http://researchmethods.itposter.net Define research question How facts become theories Common research process Select research method Analyze quantitative data Confidence Start empirical Statistics is a mathematical science pertaining to the collection, analysis, interpretation or Can be pretty sure your Research is a systematic explanation, and presentation of data. in theory is conclusions are valid ... Relationships increased Empirical research is a research process for answering Experiment Case study Survey But are you getting at the Why Explanatory Event between Laws are Prediction is research approach in which questions to solve Statistical methods can be used to summarize or describe a collection of data; this is called correct issues? research problems and create new How constructs formed confirmed empirical observations (data) descriptive statistics. In addition, patterns in the data may be modeled in a way that accounts for Level of control Purpose are identified Theory is are collected to answer knowledge. Establishes causal Investigate a typical Investigate information collected randomness and uncertainty in the observations, and then used to draw inferences about the process How many rejected research question. relationships, confirm »case« in realistic from a group of people, projects, or population being studied; this is called inferential statistics. Both descriptive and inferential How much Descriptive Research Question (RQ) is what theories. representative conditions. organizations or literature. statistics comprise applied statistics. The goal of the theory has to you are trying to find out by When research Event Predictions Research is undertaking the research Theory is from theory performed be defined here. Based on the Who can be research question an empirical Define research process. Control Requires high control Requires medium control Requires low control formed that drawn, which Theory is strategy has to be chosen. question Descriptive statistics Where Exploratory explains laws form NOT modified A clear and precise RQ guides Control on who is using Change to be assessed Technology change is theory development, research Descriptive statistics are used to describe the basic features of the data in a study. They provide appropriate What research hypotheses which technology, (e.g., new technology) implemented across a large Can be pretty sure you are Event Prediction is It is used to find out what is design, data collection and data when, where, and number of projects. simple summaries about the sample and the measures. Together with simple graphics analysis, is wide-ranging When NOT confirmed already known about a question analysis. they form the basis of virtually every quantitative analysis of data. getting at the correct Level of access Relationships Confidence in before trying to answer it. under which conditions throughout the Description of results, issues … between Laws are is possible. development process. influence factors, But can you draw valid constructs formed theory is reduced Review Types of research questions are: Measures of central tendency Theory is modified To investigate self Assessment in a typical differences and conclusions? are identified A good literature review is an What?, Where?, Who?, When?, A measure of central tendency is a single number that is used to represent the average score in important part of any research. Literature How Much?, How many?, Why?, standing tasks from situation required. commonalities is needed. Event which results can be the distribution. How? Mode – the most common score in a frequency distribution obtained immediately. Research question examples: The goal of literature review is Median – the middlemost score in a distribution to demonstrate a familiarity Can establish causal Can be incorporated in Can use existing experience. Mean – the common average What are the key success factors of object-oriented frameworks? with a body of knowledge and Does the proposed software improvement increases the efficiency of its users? relationships. normal development Can confirm an effect How does software development methodology and team size influence developers productivity? Create theoretical model establish credibility. Additional, to show the path to prior research and how a current Create theoretical Theoretical model is used to conceptualize the problem Can confirm theories. activities. Already scaled up to generalizes to many projects/organizations. Measures of variability A single number which describes how much the data vary in the distribution. research is related to it. model stated in research question. It life size if performed on Allow to use standard Range – The difference between the highest and lower score in a distribution. Research question: »How does software development methodology and team size is commonly represented with real projects. statistical techniques. Variance – The average of the squared deviations from the mean. causal model. Standard deviation – the square root of the variance, a measure of variability in the Pro's Can determine whether Enable research in the influences developers productivity?« same units as the scores being described. expected effects apply large. in studied context. Consider threats to the research Theoretical model is based on research question and represents set of concepts and Design research Other research methods Easy to plan. Help answer why and Applicable to real world projects in practice. Generalization usually Correlation and regression Determine associations between two variables. Correlation – The strength of the relationship between two variables. relationships between them! Select Practitioner oriented methods how questions. easier. Threats to the research are related to operationalization and ... Regression – Predicting the value of one variable from another based on the research Delphi method Can provide qualitative Good for early exploratory correlation. measurement issues: Action research Insights. method analysis. Operationalization issues – The validity of the operationalization Levels Independent Dependent Measures Laboratory oriented methods Measurement issues – Reliability, validity, sensitivity (see below) (observed variables) Mathematical modeling Application in With little or no May rely on different variables variables (observed variables) Computer simulation industrial context replication they may projects/organizations Inferential statistics (latent variables) (latent variables) Laboratory experiment requires give inaccurate results. keeping comparable data. Technology oriented methods Compromises. OSSD Proof of technical concept Difficult to interpret and No control over variables Inferential statistics or statistical induction comprises the use of statistics to make inferences Software Design Design case Design generalize (e.g., due to methods. Literature based methods concerning some unknown aspect of a population. Lines of code (LOC) experiment study survey confounding factors). Can at most confirm Con's RUP development Literature review H1 Developer per developer per day Statistical analysis association but not causality. methodology Conceptual study XP productivity usually not possible. Can be biased due to Sampling distribution – the distribution of means of samples from a population. Valid but Valid and Few agreed standards differences between Sampling distribution has three important properties: Reliable but on procedures for respondents and It has the same mean as the population distribution. not reliable reliable not valid H2 undertaking case nonrespondents. Development It has smaller standard deviation as the population distribution. Measurement relationship Perform research on defined The objective of this activity studies. Questionnaire design may be As the sample size becomes larger, the shape of the distribution approaches a normal Number of team size – associate latent variables Reliability threats – refers to the question whether the research can be repeated sample Perform is to run the study according tricky (validity, reliability). distribution, regardless of the shape of the population from which the samples are drawn. developers with their measures to the study plan. with the same results. research collection General sable population – Process and product Process and product Questionnaires. Stability reliability – Does the measurement vary over time? Hypothesis testing - is the use of statistics to determine the probability that a given hypothesis Data Causal relationships (H1,H2) – define population to which you want to measurement. measurement. Interviews. Representative reliability – Does the measurement give the same answer when cause-effect relationship between Questionnaires. is true. The usual process of hypothesis testing consists of four steps. ultimately generalize results. Questionnaires. Project measurement. applied to all groups? latent variables (theoretical Formulate the null hypothesis H0 (the hypothesis that is of no scientific interest) and the Equivalence reliability – When there are many measures of the same construct, do All other variables which Interviews Literature survey. alternative hypothesis Ha (statistical term for the research hypothesis). propositions). Can be tested only by Accessible population – they all give the same answer? are not the focus of Data is collected with a Identify a test statistic that can be used to assess the truth of the null hypothesis. evaluating relationships between population that you can actually research are irrelevant research instrument, for Parametric and Compare case study results Comparing different populations Compute the P-value, which is the probability that a test statistic at least as significant as observed variables (hypotheses)! gain access. Analysis variables. example questionnaire. nonparametric to a representative among respondents, association the one observed would be obtained assuming that the null hypothesis were true. The types Validity threats Collect data statistics, compare central comparison baseline: sister and trend analysis, consistency of Face validity – Research community »good feel«. Actual sample – the sample smaller the P-value, the stronger the evidence against the null hypothesis. Content validity – Are all aspect of the conceptual variable included in the Variables types actually used in research. tendencies of treatments, groups. project, company baseline, project subset with no scores. Compare the p-value to an acceptable significance value alpha (sometimes called an alpha measurement? value). If p<=alpha, that the observed effect is statistically significant, the null hypothesis is Hypothesis testing change. ruled out, and the alternative hypothesis is valid. Criterion validity – validity is measured against some other standard or measure for Dependent Developer Hypotheses are tested by comparing LOC the conceptual variable. efficiency Conclusion validity Internal validity Internal validity predictions with observed data Represent Statistical errors threats Predictive validity – The measure is known to predict future behavior that is related the »effect« Mean time Analyze data Major Observations that confirm a prediction do Internal validity Construct validity Experimental validity or H0 is TRUE H0 is FALSE to the conceptual variable. Software not establish the truth of a hypothesis between failure Construct validity External validity reliability Construct validity – A measure is found to give correct predictions in multiple reliability Wrong decision – Deductive testing of hypotheses look for Qualitative Construct validity Accept H0 Correct decision unrelated research processes. This confirm both the theories and the construct validity Quantitative External validity Experimental validity or The null Type II error disconfirming evidence to falsify Chose data Independent of the measure. Requirements {OSSD, RUP, data reliability External validity hypothesis hypotheses change XP} analysis data Wrong decision – Conclusion validity – is concerned with the relationship between the treatment and Represent (H0) Reject H0 Type I error Correct decision the outcome of the research 8choice of sample size, choice of statistical tests). the »cause« Experimental validity – (see reliability) Development Number of Measurement issues team size developers Depends on data Use Statistical significance – the probability that an experimental result happened by chance. Sources of invalidity Internal – Is concerned with the validity within the given environment and the Reliability - does the measurement give the same results under the same conditions (consistency)? Latent Observed Use qualitative data analysis and the goal of the study. quantitative data analysis Select statistical test Repeated Here is the Alpha is the probability reliability of results. It relates to validity of research process design, controls and ANOVA distribution of Validity - does the measurement method Describe abstract of rejecting the Logistic Regression measures. ANOVA values of Z when Discriminant of actually provide information about the theoretical concepts. Define ways of measuring Nom Int hypothesis tested when External – Is the question of how general the findings are. Can you carry over the LoM the hypothesis conceptual variable? They cannot be latent variables. Level of that hypothesis is true. Nominal Inte research results into actual environment? Level of for tested is true. Sensitivity - how much does the directly measured. Each latent variable may The objective of this measurement measurement change with the changes on have multiple empirical measurement for IV 3+ DV? Ord (mean Z = 0) rval activity is to analyze How Here we have Linear t Sensitivity In the conceptual variable? indicators. the collected data in of DV? many levels Friedman regression set alpha = 0.05 How much does the measurement change with the change of the conceptual variable? order to answer the does the IV operationalized study Draw Consider Consider reliability, have Paired goal (research validity and sensitivity! The IV is the ? Int -3 -2 -1 0 1 2 3 question). conclusions threats 3+ 2 (related) t- Values of Zx