SlideShare ist ein Scribd-Unternehmen logo
1 von 33
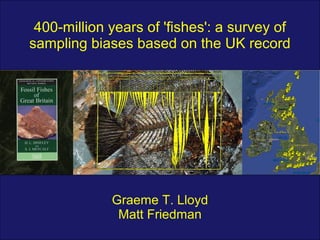
400-million years of 'fishes': a survey of
sampling biases based on the UK record


             Graeme T. Lloyd
              Matt Friedman
Extant Vertebrate Diversity


                                      ‘fishes’
                                    (ca. 28,000)
species counts from Nelson (2006)
Historical ‘Fish’ Diversity


Agassiz 1833-1843
Historical ‘Fish’ Diversity


Benton 1998 (data from Fossil Record 2)
The Database


 
     1678 occurrences
 
     100 localities
 
     683 species
 
     437 genera
 
     70 geologic formations
Collector Curve
Genus richness
Fish-bearing geologic formations
Fish-bearing localities
Grid occupancy

      1              2             3                4


 0.5-degree net   localities   grids sampled   grids occupied
Grid occupancy
Correlations


           Correlation              Raw (rho)       G.D. (rho)
 Genus richness vs. Formations        0.66            0.48
  Genus richness vs. Localities       0.67            0.59
   Genus richness vs. Grids           0.75            0.66

                         p > 0.05        p < 0.05
Sampling correction - rarefaction
Sampling correction - formations
Sampling correction - localities
Sampling correction - grids
Clade comparison
Chondrichthyes     Osteichthyes
Genus richness
Chondrichthyes   Osteichthyes
Modeling - formations
Chondrichthyes                 Osteichthyes


 Raw (rho)   G.D. (rho)   Raw (rho)      G.D. (rho)
   0.87        0.65         0.70           0.53


                              p > 0.05         p < 0.05
Modeling - localities
Chondrichthyes                 Osteichthyes


 Raw (rho)   G.D. (rho)   Raw (rho)      G.D. (rho)
   0.94        0.87         0.69           0.37


                              p > 0.05         p < 0.05
Modeling – grid occupancy
Chondrichthyes                 Osteichthyes


 Raw (rho)   G.D. (rho)   Raw (rho)      G.D. (rho)
   0.93        0.83         0.72           0.57


                              p > 0.05         p < 0.05
Global curves
        Agassiz 1833/43 –   Benton 1993 –
        European            Global
        Species             families


      Carroll 1988 –        Sepkoski 2002 –
      Global                Marine
      genera                genera
Dataset correlations


                    UK          Agassiz1        Benton           Carroll    Sepkoski2
     UK                            0.39           0.76            0.67         0.68


                                                                                             Spearman
 Agassiz1           0.43                          -0.11          -0.26         0.18
  Benton            0.61          -0.15                           0.52         0.72
   Carroll          0.51          -0.20           0.78                         0.38
 Sepkoski2          0.65           0.26           0.90            0.71
                                               Pearson
                             p > 0.05                 p < 0.05        1
                                                                        European taxa only
                                                                      2
                                                                        marine taxa only
(Correlations based on generalized differences of log10 data)
Le conclusions
• First sampling corrected curves of fish
  richness:
Le conclusions
• First sampling corrected curves of fish
  richness:
  • Devonian diversity is far lower than expected…
Le conclusions
• First sampling corrected curves of fish
  richness:
  • Devonian diversity is far lower than expected…
  • …yet Paleogene rise survives…
Le conclusions
• First sampling corrected curves of fish
  richness:
  • Devonian diversity is far lower than expected…
  • …yet Paleogene rise survives…
  • …Cenozoic true “age of fishes”?
Le conclusions
• First sampling corrected curves of fish
  richness:
  • Devonian diversity is far lower than expected…
  • …yet Paleogene rise survives…
  • …Cenozoic true “age of fishes”?
• Chondricthyans are more correlated with
  sampling than osteichthyans
Le conclusions
• First sampling corrected curves of fish
  richness:
  • Devonian diversity is far lower than expected…
  • …yet Paleogene rise survives…
  • …Cenozoic true “age of fishes”?
• Chondricthyans are more correlated with
  sampling than osteichthyans
• UK record accounts for one half to two-thirds of
  global signal
• Estimates of global fish richness have changed
  substantially in last 170 years

Weitere ähnliche Inhalte

Mehr von Graeme Lloyd

Measuring morphological diversity and tempo using discrete characters: advant...
Measuring morphological diversity and tempo using discrete characters: advant...Measuring morphological diversity and tempo using discrete characters: advant...
Measuring morphological diversity and tempo using discrete characters: advant...Graeme Lloyd
 
Phylogenetic diversity through deep time: an exploration using Mesozoic dinos...
Phylogenetic diversity through deep time: an exploration using Mesozoic dinos...Phylogenetic diversity through deep time: an exploration using Mesozoic dinos...
Phylogenetic diversity through deep time: an exploration using Mesozoic dinos...Graeme Lloyd
 
Time-binning rates of continuous character evolution on a phylogeny: the orig...
Time-binning rates of continuous character evolution on a phylogeny: the orig...Time-binning rates of continuous character evolution on a phylogeny: the orig...
Time-binning rates of continuous character evolution on a phylogeny: the orig...Graeme Lloyd
 
Detecting phylogenetic signals of endemism and dispersal: the effects of Pang...
Detecting phylogenetic signals of endemism and dispersal: the effects of Pang...Detecting phylogenetic signals of endemism and dispersal: the effects of Pang...
Detecting phylogenetic signals of endemism and dispersal: the effects of Pang...Graeme Lloyd
 
Generating new models for detecting phylogenetic signals of endemism and disp...
Generating new models for detecting phylogenetic signals of endemism and disp...Generating new models for detecting phylogenetic signals of endemism and disp...
Generating new models for detecting phylogenetic signals of endemism and disp...Graeme Lloyd
 
Automated generation of large phylogenies and a probabilistically time-scaled...
Automated generation of large phylogenies and a probabilistically time-scaled...Automated generation of large phylogenies and a probabilistically time-scaled...
Automated generation of large phylogenies and a probabilistically time-scaled...Graeme Lloyd
 
New methodologies for the use of cladistic-type matrices to measure morpholog...
New methodologies for the use of cladistic-type matrices to measure morpholog...New methodologies for the use of cladistic-type matrices to measure morpholog...
New methodologies for the use of cladistic-type matrices to measure morpholog...Graeme Lloyd
 
A probabilistically time-scaled 1,000-taxon phylogenetic hypothesis for Mesoz...
A probabilistically time-scaled 1,000-taxon phylogenetic hypothesis for Mesoz...A probabilistically time-scaled 1,000-taxon phylogenetic hypothesis for Mesoz...
A probabilistically time-scaled 1,000-taxon phylogenetic hypothesis for Mesoz...Graeme Lloyd
 
How does Evolutionary Distinctiveness change when we place fossils in the tree?
How does Evolutionary Distinctiveness change when we place fossils in the tree?How does Evolutionary Distinctiveness change when we place fossils in the tree?
How does Evolutionary Distinctiveness change when we place fossils in the tree?Graeme Lloyd
 
A new R package for automating cladistic ordination and the effects of phylog...
A new R package for automating cladistic ordination and the effects of phylog...A new R package for automating cladistic ordination and the effects of phylog...
A new R package for automating cladistic ordination and the effects of phylog...Graeme Lloyd
 
A novel method for time-binning rates of continuous character evolution on a ...
A novel method for time-binning rates of continuous character evolution on a ...A novel method for time-binning rates of continuous character evolution on a ...
A novel method for time-binning rates of continuous character evolution on a ...Graeme Lloyd
 
Claddis: a new R package for automating disparity analyses based on cladistic...
Claddis: a new R package for automating disparity analyses based on cladistic...Claddis: a new R package for automating disparity analyses based on cladistic...
Claddis: a new R package for automating disparity analyses based on cladistic...Graeme Lloyd
 
Beyond the lower-bound: the fossil record can provide empirically-informed pr...
Beyond the lower-bound: the fossil record can provide empirically-informed pr...Beyond the lower-bound: the fossil record can provide empirically-informed pr...
Beyond the lower-bound: the fossil record can provide empirically-informed pr...Graeme Lloyd
 
Geological controls on palaeobiodiversity: beyond the marine macrofossil record
Geological controls on palaeobiodiversity: beyond the marine macrofossil recordGeological controls on palaeobiodiversity: beyond the marine macrofossil record
Geological controls on palaeobiodiversity: beyond the marine macrofossil recordGraeme Lloyd
 
Are our estimates of palaeobiodiversity more apparent than real?
Are our estimates of palaeobiodiversity more apparent than real?Are our estimates of palaeobiodiversity more apparent than real?
Are our estimates of palaeobiodiversity more apparent than real?Graeme Lloyd
 
Are palaeobiodiversity patterns more apparent than real?
Are palaeobiodiversity patterns more apparent than real?Are palaeobiodiversity patterns more apparent than real?
Are palaeobiodiversity patterns more apparent than real?Graeme Lloyd
 
What the deep sea tells us about sampling biases in the fossil record
What the deep sea tells us about sampling biases in the fossil recordWhat the deep sea tells us about sampling biases in the fossil record
What the deep sea tells us about sampling biases in the fossil recordGraeme Lloyd
 
Is there a bias in deep sea diversity patterns?
Is there a bias in deep sea diversity patterns?Is there a bias in deep sea diversity patterns?
Is there a bias in deep sea diversity patterns?Graeme Lloyd
 
Adventures in protein world reveal the Tree of Life and the evolution of comp...
Adventures in protein world reveal the Tree of Life and the evolution of comp...Adventures in protein world reveal the Tree of Life and the evolution of comp...
Adventures in protein world reveal the Tree of Life and the evolution of comp...Graeme Lloyd
 

Mehr von Graeme Lloyd (20)

Measuring morphological diversity and tempo using discrete characters: advant...
Measuring morphological diversity and tempo using discrete characters: advant...Measuring morphological diversity and tempo using discrete characters: advant...
Measuring morphological diversity and tempo using discrete characters: advant...
 
Phylogenetic diversity through deep time: an exploration using Mesozoic dinos...
Phylogenetic diversity through deep time: an exploration using Mesozoic dinos...Phylogenetic diversity through deep time: an exploration using Mesozoic dinos...
Phylogenetic diversity through deep time: an exploration using Mesozoic dinos...
 
Time-binning rates of continuous character evolution on a phylogeny: the orig...
Time-binning rates of continuous character evolution on a phylogeny: the orig...Time-binning rates of continuous character evolution on a phylogeny: the orig...
Time-binning rates of continuous character evolution on a phylogeny: the orig...
 
Detecting phylogenetic signals of endemism and dispersal: the effects of Pang...
Detecting phylogenetic signals of endemism and dispersal: the effects of Pang...Detecting phylogenetic signals of endemism and dispersal: the effects of Pang...
Detecting phylogenetic signals of endemism and dispersal: the effects of Pang...
 
Generating new models for detecting phylogenetic signals of endemism and disp...
Generating new models for detecting phylogenetic signals of endemism and disp...Generating new models for detecting phylogenetic signals of endemism and disp...
Generating new models for detecting phylogenetic signals of endemism and disp...
 
Automated generation of large phylogenies and a probabilistically time-scaled...
Automated generation of large phylogenies and a probabilistically time-scaled...Automated generation of large phylogenies and a probabilistically time-scaled...
Automated generation of large phylogenies and a probabilistically time-scaled...
 
New methodologies for the use of cladistic-type matrices to measure morpholog...
New methodologies for the use of cladistic-type matrices to measure morpholog...New methodologies for the use of cladistic-type matrices to measure morpholog...
New methodologies for the use of cladistic-type matrices to measure morpholog...
 
A probabilistically time-scaled 1,000-taxon phylogenetic hypothesis for Mesoz...
A probabilistically time-scaled 1,000-taxon phylogenetic hypothesis for Mesoz...A probabilistically time-scaled 1,000-taxon phylogenetic hypothesis for Mesoz...
A probabilistically time-scaled 1,000-taxon phylogenetic hypothesis for Mesoz...
 
How does Evolutionary Distinctiveness change when we place fossils in the tree?
How does Evolutionary Distinctiveness change when we place fossils in the tree?How does Evolutionary Distinctiveness change when we place fossils in the tree?
How does Evolutionary Distinctiveness change when we place fossils in the tree?
 
A new R package for automating cladistic ordination and the effects of phylog...
A new R package for automating cladistic ordination and the effects of phylog...A new R package for automating cladistic ordination and the effects of phylog...
A new R package for automating cladistic ordination and the effects of phylog...
 
A novel method for time-binning rates of continuous character evolution on a ...
A novel method for time-binning rates of continuous character evolution on a ...A novel method for time-binning rates of continuous character evolution on a ...
A novel method for time-binning rates of continuous character evolution on a ...
 
Claddis: a new R package for automating disparity analyses based on cladistic...
Claddis: a new R package for automating disparity analyses based on cladistic...Claddis: a new R package for automating disparity analyses based on cladistic...
Claddis: a new R package for automating disparity analyses based on cladistic...
 
Beyond the lower-bound: the fossil record can provide empirically-informed pr...
Beyond the lower-bound: the fossil record can provide empirically-informed pr...Beyond the lower-bound: the fossil record can provide empirically-informed pr...
Beyond the lower-bound: the fossil record can provide empirically-informed pr...
 
Geological controls on palaeobiodiversity: beyond the marine macrofossil record
Geological controls on palaeobiodiversity: beyond the marine macrofossil recordGeological controls on palaeobiodiversity: beyond the marine macrofossil record
Geological controls on palaeobiodiversity: beyond the marine macrofossil record
 
Are our estimates of palaeobiodiversity more apparent than real?
Are our estimates of palaeobiodiversity more apparent than real?Are our estimates of palaeobiodiversity more apparent than real?
Are our estimates of palaeobiodiversity more apparent than real?
 
Are palaeobiodiversity patterns more apparent than real?
Are palaeobiodiversity patterns more apparent than real?Are palaeobiodiversity patterns more apparent than real?
Are palaeobiodiversity patterns more apparent than real?
 
What the deep sea tells us about sampling biases in the fossil record
What the deep sea tells us about sampling biases in the fossil recordWhat the deep sea tells us about sampling biases in the fossil record
What the deep sea tells us about sampling biases in the fossil record
 
Is there a bias in deep sea diversity patterns?
Is there a bias in deep sea diversity patterns?Is there a bias in deep sea diversity patterns?
Is there a bias in deep sea diversity patterns?
 
Adventures in protein world reveal the Tree of Life and the evolution of comp...
Adventures in protein world reveal the Tree of Life and the evolution of comp...Adventures in protein world reveal the Tree of Life and the evolution of comp...
Adventures in protein world reveal the Tree of Life and the evolution of comp...
 
Adventures in protein world reveal the Tree of Life and the evolution of comp...
Adventures in protein world reveal the Tree of Life and the evolution of comp...Adventures in protein world reveal the Tree of Life and the evolution of comp...
Adventures in protein world reveal the Tree of Life and the evolution of comp...
 

Kürzlich hochgeladen

Field Attribute Index Feature in Odoo 17
Field Attribute Index Feature in Odoo 17Field Attribute Index Feature in Odoo 17
Field Attribute Index Feature in Odoo 17Celine George
 
Integumentary System SMP B. Pharm Sem I.ppt
Integumentary System SMP B. Pharm Sem I.pptIntegumentary System SMP B. Pharm Sem I.ppt
Integumentary System SMP B. Pharm Sem I.pptshraddhaparab530
 
Expanded definition: technical and operational
Expanded definition: technical and operationalExpanded definition: technical and operational
Expanded definition: technical and operationalssuser3e220a
 
Dust Of Snow By Robert Frost Class-X English CBSE
Dust Of Snow By Robert Frost Class-X English CBSEDust Of Snow By Robert Frost Class-X English CBSE
Dust Of Snow By Robert Frost Class-X English CBSEaurabinda banchhor
 
Choosing the Right CBSE School A Comprehensive Guide for Parents
Choosing the Right CBSE School A Comprehensive Guide for ParentsChoosing the Right CBSE School A Comprehensive Guide for Parents
Choosing the Right CBSE School A Comprehensive Guide for Parentsnavabharathschool99
 
Influencing policy (training slides from Fast Track Impact)
Influencing policy (training slides from Fast Track Impact)Influencing policy (training slides from Fast Track Impact)
Influencing policy (training slides from Fast Track Impact)Mark Reed
 
Activity 2-unit 2-update 2024. English translation
Activity 2-unit 2-update 2024. English translationActivity 2-unit 2-update 2024. English translation
Activity 2-unit 2-update 2024. English translationRosabel UA
 
The Contemporary World: The Globalization of World Politics
The Contemporary World: The Globalization of World PoliticsThe Contemporary World: The Globalization of World Politics
The Contemporary World: The Globalization of World PoliticsRommel Regala
 
GRADE 4 - SUMMATIVE TEST QUARTER 4 ALL SUBJECTS
GRADE 4 - SUMMATIVE TEST QUARTER 4 ALL SUBJECTSGRADE 4 - SUMMATIVE TEST QUARTER 4 ALL SUBJECTS
GRADE 4 - SUMMATIVE TEST QUARTER 4 ALL SUBJECTSJoshuaGantuangco2
 
Concurrency Control in Database Management system
Concurrency Control in Database Management systemConcurrency Control in Database Management system
Concurrency Control in Database Management systemChristalin Nelson
 
TEACHER REFLECTION FORM (NEW SET........).docx
TEACHER REFLECTION FORM (NEW SET........).docxTEACHER REFLECTION FORM (NEW SET........).docx
TEACHER REFLECTION FORM (NEW SET........).docxruthvilladarez
 
4.16.24 Poverty and Precarity--Desmond.pptx
4.16.24 Poverty and Precarity--Desmond.pptx4.16.24 Poverty and Precarity--Desmond.pptx
4.16.24 Poverty and Precarity--Desmond.pptxmary850239
 
Q4-PPT-Music9_Lesson-1-Romantic-Opera.pptx
Q4-PPT-Music9_Lesson-1-Romantic-Opera.pptxQ4-PPT-Music9_Lesson-1-Romantic-Opera.pptx
Q4-PPT-Music9_Lesson-1-Romantic-Opera.pptxlancelewisportillo
 
Incoming and Outgoing Shipments in 3 STEPS Using Odoo 17
Incoming and Outgoing Shipments in 3 STEPS Using Odoo 17Incoming and Outgoing Shipments in 3 STEPS Using Odoo 17
Incoming and Outgoing Shipments in 3 STEPS Using Odoo 17Celine George
 
Measures of Position DECILES for ungrouped data
Measures of Position DECILES for ungrouped dataMeasures of Position DECILES for ungrouped data
Measures of Position DECILES for ungrouped dataBabyAnnMotar
 
EMBODO Lesson Plan Grade 9 Law of Sines.docx
EMBODO Lesson Plan Grade 9 Law of Sines.docxEMBODO Lesson Plan Grade 9 Law of Sines.docx
EMBODO Lesson Plan Grade 9 Law of Sines.docxElton John Embodo
 
Presentation Activity 2. Unit 3 transv.pptx
Presentation Activity 2. Unit 3 transv.pptxPresentation Activity 2. Unit 3 transv.pptx
Presentation Activity 2. Unit 3 transv.pptxRosabel UA
 

Kürzlich hochgeladen (20)

Field Attribute Index Feature in Odoo 17
Field Attribute Index Feature in Odoo 17Field Attribute Index Feature in Odoo 17
Field Attribute Index Feature in Odoo 17
 
Integumentary System SMP B. Pharm Sem I.ppt
Integumentary System SMP B. Pharm Sem I.pptIntegumentary System SMP B. Pharm Sem I.ppt
Integumentary System SMP B. Pharm Sem I.ppt
 
Expanded definition: technical and operational
Expanded definition: technical and operationalExpanded definition: technical and operational
Expanded definition: technical and operational
 
LEFT_ON_C'N_ PRELIMS_EL_DORADO_2024.pptx
LEFT_ON_C'N_ PRELIMS_EL_DORADO_2024.pptxLEFT_ON_C'N_ PRELIMS_EL_DORADO_2024.pptx
LEFT_ON_C'N_ PRELIMS_EL_DORADO_2024.pptx
 
Dust Of Snow By Robert Frost Class-X English CBSE
Dust Of Snow By Robert Frost Class-X English CBSEDust Of Snow By Robert Frost Class-X English CBSE
Dust Of Snow By Robert Frost Class-X English CBSE
 
Choosing the Right CBSE School A Comprehensive Guide for Parents
Choosing the Right CBSE School A Comprehensive Guide for ParentsChoosing the Right CBSE School A Comprehensive Guide for Parents
Choosing the Right CBSE School A Comprehensive Guide for Parents
 
Influencing policy (training slides from Fast Track Impact)
Influencing policy (training slides from Fast Track Impact)Influencing policy (training slides from Fast Track Impact)
Influencing policy (training slides from Fast Track Impact)
 
INCLUSIVE EDUCATION PRACTICES FOR TEACHERS AND TRAINERS.pptx
INCLUSIVE EDUCATION PRACTICES FOR TEACHERS AND TRAINERS.pptxINCLUSIVE EDUCATION PRACTICES FOR TEACHERS AND TRAINERS.pptx
INCLUSIVE EDUCATION PRACTICES FOR TEACHERS AND TRAINERS.pptx
 
Activity 2-unit 2-update 2024. English translation
Activity 2-unit 2-update 2024. English translationActivity 2-unit 2-update 2024. English translation
Activity 2-unit 2-update 2024. English translation
 
The Contemporary World: The Globalization of World Politics
The Contemporary World: The Globalization of World PoliticsThe Contemporary World: The Globalization of World Politics
The Contemporary World: The Globalization of World Politics
 
GRADE 4 - SUMMATIVE TEST QUARTER 4 ALL SUBJECTS
GRADE 4 - SUMMATIVE TEST QUARTER 4 ALL SUBJECTSGRADE 4 - SUMMATIVE TEST QUARTER 4 ALL SUBJECTS
GRADE 4 - SUMMATIVE TEST QUARTER 4 ALL SUBJECTS
 
Concurrency Control in Database Management system
Concurrency Control in Database Management systemConcurrency Control in Database Management system
Concurrency Control in Database Management system
 
YOUVE_GOT_EMAIL_PRELIMS_EL_DORADO_2024.pptx
YOUVE_GOT_EMAIL_PRELIMS_EL_DORADO_2024.pptxYOUVE_GOT_EMAIL_PRELIMS_EL_DORADO_2024.pptx
YOUVE_GOT_EMAIL_PRELIMS_EL_DORADO_2024.pptx
 
TEACHER REFLECTION FORM (NEW SET........).docx
TEACHER REFLECTION FORM (NEW SET........).docxTEACHER REFLECTION FORM (NEW SET........).docx
TEACHER REFLECTION FORM (NEW SET........).docx
 
4.16.24 Poverty and Precarity--Desmond.pptx
4.16.24 Poverty and Precarity--Desmond.pptx4.16.24 Poverty and Precarity--Desmond.pptx
4.16.24 Poverty and Precarity--Desmond.pptx
 
Q4-PPT-Music9_Lesson-1-Romantic-Opera.pptx
Q4-PPT-Music9_Lesson-1-Romantic-Opera.pptxQ4-PPT-Music9_Lesson-1-Romantic-Opera.pptx
Q4-PPT-Music9_Lesson-1-Romantic-Opera.pptx
 
Incoming and Outgoing Shipments in 3 STEPS Using Odoo 17
Incoming and Outgoing Shipments in 3 STEPS Using Odoo 17Incoming and Outgoing Shipments in 3 STEPS Using Odoo 17
Incoming and Outgoing Shipments in 3 STEPS Using Odoo 17
 
Measures of Position DECILES for ungrouped data
Measures of Position DECILES for ungrouped dataMeasures of Position DECILES for ungrouped data
Measures of Position DECILES for ungrouped data
 
EMBODO Lesson Plan Grade 9 Law of Sines.docx
EMBODO Lesson Plan Grade 9 Law of Sines.docxEMBODO Lesson Plan Grade 9 Law of Sines.docx
EMBODO Lesson Plan Grade 9 Law of Sines.docx
 
Presentation Activity 2. Unit 3 transv.pptx
Presentation Activity 2. Unit 3 transv.pptxPresentation Activity 2. Unit 3 transv.pptx
Presentation Activity 2. Unit 3 transv.pptx
 

400-million years of 'fishes': a survey of sampling biases based on the UK record

  • 1. 400-million years of 'fishes': a survey of sampling biases based on the UK record Graeme T. Lloyd Matt Friedman
  • 2. Extant Vertebrate Diversity ‘fishes’ (ca. 28,000) species counts from Nelson (2006)
  • 4. Historical ‘Fish’ Diversity Benton 1998 (data from Fossil Record 2)
  • 5. The Database  1678 occurrences  100 localities  683 species  437 genera  70 geologic formations
  • 10. Grid occupancy 1 2 3 4 0.5-degree net localities grids sampled grids occupied
  • 12. Correlations Correlation Raw (rho) G.D. (rho) Genus richness vs. Formations 0.66 0.48 Genus richness vs. Localities 0.67 0.59 Genus richness vs. Grids 0.75 0.66 p > 0.05 p < 0.05
  • 13. Sampling correction - rarefaction
  • 14. Sampling correction - formations
  • 15. Sampling correction - localities
  • 19. Modeling - formations Chondrichthyes Osteichthyes Raw (rho) G.D. (rho) Raw (rho) G.D. (rho) 0.87 0.65 0.70 0.53 p > 0.05 p < 0.05
  • 20. Modeling - localities Chondrichthyes Osteichthyes Raw (rho) G.D. (rho) Raw (rho) G.D. (rho) 0.94 0.87 0.69 0.37 p > 0.05 p < 0.05
  • 21. Modeling – grid occupancy Chondrichthyes Osteichthyes Raw (rho) G.D. (rho) Raw (rho) G.D. (rho) 0.93 0.83 0.72 0.57 p > 0.05 p < 0.05
  • 22. Global curves Agassiz 1833/43 – Benton 1993 – European Global Species families Carroll 1988 – Sepkoski 2002 – Global Marine genera genera
  • 23. Dataset correlations UK Agassiz1 Benton Carroll Sepkoski2 UK 0.39 0.76 0.67 0.68 Spearman Agassiz1 0.43 -0.11 -0.26 0.18 Benton 0.61 -0.15 0.52 0.72 Carroll 0.51 -0.20 0.78 0.38 Sepkoski2 0.65 0.26 0.90 0.71 Pearson p > 0.05 p < 0.05 1 European taxa only 2 marine taxa only (Correlations based on generalized differences of log10 data)
  • 24. Dataset correlations UK Agassiz1 Benton Carroll Sepkoski2 UK 0.39 0.76 0.67 0.68 Spearman Agassiz1 0.43 -0.11 -0.26 0.18 Benton 0.61 -0.15 0.52 0.72 Carroll 0.51 -0.20 0.78 0.38 Sepkoski2 0.65 0.26 0.90 0.71 Pearson p > 0.05 p < 0.05 1 European taxa only 2 marine taxa only (Correlations based on generalized differences of log10 data)
  • 25. Dataset correlations UK Agassiz1 Benton Carroll Sepkoski2 UK 0.39 0.76 0.67 0.68 Spearman Agassiz1 0.43 -0.11 -0.26 0.18 Benton 0.61 -0.15 0.52 0.72 Carroll 0.51 -0.20 0.78 0.38 Sepkoski2 0.65 0.26 0.90 0.71 Pearson p > 0.05 p < 0.05 1 European taxa only 2 marine taxa only (Correlations based on generalized differences of log10 data)
  • 26. Dataset correlations UK Agassiz1 Benton Carroll Sepkoski2 UK 0.39 0.76 0.67 0.68 Spearman Agassiz1 0.43 -0.11 -0.26 0.18 Benton 0.61 -0.15 0.52 0.72 Carroll 0.51 -0.20 0.78 0.38 Sepkoski2 0.65 0.26 0.90 0.71 Pearson p > 0.05 p < 0.05 1 European taxa only 2 marine taxa only (Correlations based on generalized differences of log10 data)
  • 27. Le conclusions • First sampling corrected curves of fish richness:
  • 28. Le conclusions • First sampling corrected curves of fish richness: • Devonian diversity is far lower than expected…
  • 29. Le conclusions • First sampling corrected curves of fish richness: • Devonian diversity is far lower than expected… • …yet Paleogene rise survives…
  • 30. Le conclusions • First sampling corrected curves of fish richness: • Devonian diversity is far lower than expected… • …yet Paleogene rise survives… • …Cenozoic true “age of fishes”?
  • 31. Le conclusions • First sampling corrected curves of fish richness: • Devonian diversity is far lower than expected… • …yet Paleogene rise survives… • …Cenozoic true “age of fishes”? • Chondricthyans are more correlated with sampling than osteichthyans
  • 32. Le conclusions • First sampling corrected curves of fish richness: • Devonian diversity is far lower than expected… • …yet Paleogene rise survives… • …Cenozoic true “age of fishes”? • Chondricthyans are more correlated with sampling than osteichthyans • UK record accounts for one half to two-thirds of global signal
  • 33. Le conclusions • First sampling corrected curves of fish richness: • Devonian diversity is far lower than expected… • …yet Paleogene rise survives… • …Cenozoic true “age of fishes”? • Chondricthyans are more correlated with sampling than osteichthyans • UK record accounts for one half to two-thirds of global signal • Estimates of global fish richness have changed substantially in last 170 years