1. Monthly Market Commentary November 10, 2009
MACDOUGALL, MACDOUGALL & MACTIER INC.
Service to Investors since 1849
MONTHLY MARKET COMMENTARY
INVESTMENT RESEARCH NOVEMBER 2009
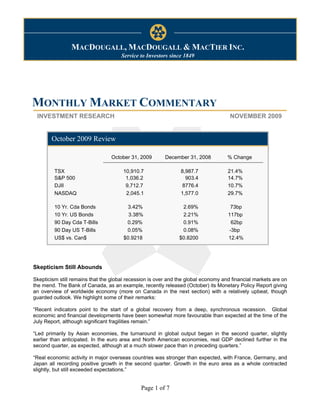
October 2009 Review
October 31, 2009 December 31, 2008 % Change
TSX 10,910.7 8,987.7 21.4%
S&P 500 1,036.2 903.4 14.7%
DJII 9,712.7 8776.4 10.7%
NASDAQ 2,045.1 1,577.0 29.7%
10 Yr. Cda Bonds 3.42% 2.69% 73bp
10 Yr. US Bonds 3.38% 2.21% 117bp
90 Day Cda T-Bills 0.29% 0.91% 62bp
90 Day US T-Bills 0.05% 0.08% -3bp
US$ vs. Can$ $0.9218 $0.8200 12.4%
Skepticism Still Abounds
Skepticism still remains that the global recession is over and the global economy and financial markets are on
the mend. The Bank of Canada, as an example, recently released (October) its Monetary Policy Report giving
an overview of worldwide economy (more on Canada in the next section) with a relatively upbeat, though
guarded outlook. We highlight some of their remarks:
“Recent indicators point to the start of a global recovery from a deep, synchronous recession. Global
economic and financial developments have been somewhat more favourable than expected at the time of the
July Report, although significant fragilities remain.”
“Led primarily by Asian economies, the turnaround in global output began in the second quarter, slightly
earlier than anticipated. In the euro area and North American economies, real GDP declined further in the
second quarter, as expected, although at a much slower pace than in preceding quarters.”
“Real economic activity in major overseas countries was stronger than expected, with France, Germany, and
Japan all recording positive growth in the second quarter. Growth in the euro area as a whole contracted
slightly, but still exceeded expectations.”
Page 1 of 7
2. Monthly Market Commentary November 10, 2009
As for the Canadian economy, recent (October) data for job creation was poor. While the unemployment
rate rose to 8.6% from 8.4% 43,000 jobs were lost. We do not view this as a major setback for Canada as in
the previous two months job data was very strong, with jobs being created as opposed to being lost. We
illustrate below the Canadian three month change in jobs.
We find the above graph encouraging as part-time employment is being displaced by full-time employment.
Employers will only hire more full-time employees than part-time when confidence and/or business conditions
are improving.
Turning to the stock market, in Canada, October was the first month since February that the TSX fell. The
monthly decline came in at -4.2%. The year-to-date performance numbers are still very positive at 21.4%.
Since the bottom of the market (month end numbers), the TSX has risen an impressive 34%. We do not view
October’s loss as a “trend-reversal” i.e. entering a bear market. We still see further potential for gains, as
corporate profits improve and skepticism subsides. Even the most sophisticated money managers have not
committed their resources to the equity markets. We illustrate this below.
Gap Between Actual Weights vs Historical Weights
3.00%
2.00%
1.00%
0.00%
-1.00% Cash Equity Bonds
-2.00%
-3.00%
-4.00%
-5.00%
Source: J.P. Morgan
This graph is an estimate of the weightings by professional money managers towards the three broad asset
classes at the end of October. The total dollar amount of all asset classes is estimated at $127 trillion.
Equities are still being underweighted from their historical averages in favour of bonds and cash. One may
think the underweighting by professional money managers is relatively small at -4.3%, but this translates into
a “potential” of $5.1 trillion U.S. ($127 trillion times 4.3%) to reach historical averages. Though there may be
some that think these professional money managers “know” something we do not, we believe it is more a
Page 2 of 7
3. Monthly Market Commentary November 10, 2009
matter of a quick rise in equity markets that have caused this under-weighting. When equity managers
become very positive they tend to over-weight equities versus bonds and cash. We are far from this situation.
There is a school of thought that the economic rebound will be strong, much stronger than the consensus
view. History does lie with this view as we illustrate below. This current recession in the U.S. brought a
contraction in their economy close to 4%. History does show the bigger the downturn, the larger the upturn.
Below we illustrate this.
Source: BCA Research
The “X” axis is the contraction (expressed as a percentage of the Gross Domestic Product) in the economy
during the recession, while the “Y” axis is the growth rate immediately after the end of the recession. The
graph goes back to 1892. Note the linearity of the line, implying the greater the fall in the economy the greater
the bounce back. For 2008 the U.S. contraction is about -3.8% suggesting a “bounce-back” of close to 8%.
There is no economist we know that is forecasting that magnitude of a bounce-back. Surprises to the
economy could be on the upside.
The Canadian Economy
As previously mentioned, the Bank of Canada has released its Monetary Policy Report outlining the state and
projections of the Canadian economy. The Bank has actually increased its growth projection for the balance
of 2009 from its July report, but slightly reduced its growth projection for 2010. The graph on the following
page illustrates their projections. The Canadian economy has contracted for the past three quarters, but is
expected to show growth in the third quarter (the figures are yet to be released) and show further strength in
the fourth quarter of the year and to further strengthen in the first, second and third quarter before leveling off
to a more modest pace of growth. The official forecast calls for the Canadian economy to grow by 3.0% in
2010 and 3.3% in 2011.
Page 3 of 7
4. Monthly Market Commentary November 10, 2009
By historical measures this pattern of economic growth is muted. The Bank is expecting a sub-par rate of
growth versus previous cycles. Their forecast in relation to past economic cycles is illustrated below.
The growth drivers in Canada and the world remain; low interest rates and government stimuli. While
government stimuli will likely have less of a positive impact in 2010, central banks have stated low levels of
interest rates will remain in place for the foreseeable future. Below we show the dramatic drop in interest
rates over the past year affecting consumers and businesses.
Page 4 of 7
5. Monthly Market Commentary November 10, 2009
The consequence of lower interest rates in Canada has led to a dramatic turnaround in housing sales,
affordability and consumer confidence.
There is no doubt Canada faces challenges in 2010 and beyond like many other developed countries, but a
combination of low interest rates, rising commodity prices (especially important for Western Canada) and
rising consumer confidence 2010 will deliver a much better year than 2009.
Ian Nakamoto
Director of Research
Page 5 of 7
6. Monthly Market Commentary November 10, 2009
Recommended Stocks:
Goldcorp (G-TSX)
Canadian Oil Sands (COS.UN-TSX)
TD Bank (TD-TSX)
Enbridge (ENB-TSX)
Microsoft Corporation (MSFT-NYSE)
Important Disclosures
Company Ticker Disclosures
Goldcorp G-TSX 1
Canadian Oil Sands Trust COS.UN-TSX -
Agrium Inc. TD-TSX -
Enbridge Inc. ENB-TSX -
Microsoft Corporation MSFT-NYSE -
The research analyst (s) who authored this report certify that the views expressed therein accurately reflect their personal views and that no part of the analyst’s compensation will be related to those
views.
Conflict of Interest Policy for Analysts
1. Refers to share ownership of the company in question by the Analyst. In the disclaimer section of a report, the number 1 will indicate that the analyst or a member of the analyst’s family has
any position (equity, derivative or other) in the shares in question.
2. Refers to share ownership of the company in question by the Director of Research or Supervisory Analyst. In the disclaimer section of a report, the number 2 will appear if the Director of
Research or Supervisory Analyst has a position (equity, derivative or other) in the shares in question.
3. Refers to any relationship the Analyst, a member of the family thereof, or firm has with the company in question. A relationship includes anything except the simple trading of stock for the
company. In the disclaimer section of a report, the number 3 will appear if the analyst, a family member thereof or the firm has a relationship with the company in question.
4. Refers to whether Analysts have visited facilities and/or key operations of the company.
5. Refers to whether the company in question defrayed any of the costs of traveling to see the company in question’s facilities. In the disclaimer section of the report, the number 5 will appear if
the company has paid any portion of the analyst’s travel expenses related to viewing facilities.
6. Refers to MacDougall, MacDougall & MacTier Inc. having undertaken any underwriting business from the company in question. If, in the previous 18 months, MacDougall, MacDougall &
MacTier Inc. has acted as an underwriter to the company in question, it will be included in the disclaimer section of a report with footnote number 6.
7. Collective ownership by 3Macs and its affiliates of 1% or more of any class of the issuer’s equity shares for a period of 60 days preceding the issuance of the report.
Definition of Equity Research Ratings & Risk Ratings
Equity Research Ratings
The rating system for recommendations on research reports published by MacDougall, MacDougall & MacTier Inc. will be as follows:
BUY - will represent opportunities that potentially offer in excess of a 20% return on investment within a 12-18 month period.
HOLD - will represent opportunities that offer between 5% and 20% potential return on investment within a 12-18 month period.
SELL- will represent opportunities that offer less than 5% return on investment within a 12-18 month period.
Risk Ratings
MacDougall, MacDougall & MacTier Inc. employs two risk ratings with its research reports; Above Market Risk and Market Risk.
Above Market Risk denotes a company, which operates in an inherently speculative industry, or one that is more volatile than the market as measured by its beta. Above Market Risk may also
indicate weakness in the company’s balance sheet, low debt ratings, and the lack of a dividend, low liquidity or other deficiencies.
Market Risk denotes a company, which is expected to present, on average, the volatility present with the overall market, measured by its beta. Market Risk companies will generally have sound
balance sheets, will be established, large cap companies in industries generally regarded as stable and for the most part will pay a dividend.
Page 6 of 7
7. Monthly Market Commentary November 10, 2009
MacDougall, MacDougall & MacTier Inc. Equity Research Ratings Distribution
100
90
80
70
60
50
40
30
20
10
0
BUY HOLD SELL
■ Percentage of companies covered by MacDougall, MacDougall & MacTier Inc. Equity Research within each rating category.
Glossary of Terms:
EPS Earnings per Share
P/E Price to Earnings Ratio
EBITDA Earnings before Interest, Taxes, Depreciation and Amortization
Market Cap Total Shares Outstanding multiplied by Shares Price
Enterprise Value Fully Diluted Shares Outstanding
PEG P/E Multiple Divided by Growth Rate
ADR American Depository Receipt
WACC Weighted Average Cost of Capital
Risk Free Rate 10 Year Treasury bond
Yield Dividend divided by Share Price
ASP Average Price
DSOs Days Sales Outstanding
Capex Capital Expenditures
CPU Cost per Unit
EVA Economic value Added
EV / EBITDA Enterprise Value / Earnings before Interest, Taxes, Depreciation and Amortization
DCF Discounted Cash Flow
Holts DCF Holts Discounted Cash Flow
DYT Dividend Yield Target
Yield Yield
BSOPM Black Scholes Options Pricing Model
BETA Quantitative measure of the volatility of a stock, mutual fund, or portfolio, relative to the overall market
MF Mutual Fund
This research report has been prepared and circulated for general information only. It does not account for the specific investment objectives and financial situation of any person receiving this
report. Investors should seek professional advice regarding the appropriateness of investing in any securities discussed or recommended in this report and should recognize that statements
regarding future prospects may not be realized. This report is not to be construed as an offer to sell or as a solicitation for an offer to buy any securities.
The information presented in this report has been compiled from sources believed to be reliable but no guarantee is made as to its accuracy, completeness, or correctness. All opinions and estimates
contained in this report are provided in good faith and are subject to change without notice.
Montreal 514-394-3000 Quebec 418-656-1212 Toronto 416-597-7900 London 519-645-1110
Page 7 of 7