8 9 Temec
•
0 likes•392 views

July housing numbers for Temecula

Recommended
More Related Content
More from Southwest Riverside County Association of Realtors
More from Southwest Riverside County Association of Realtors (20)
Recently uploaded
Recently uploaded (20)
8 9 Temec
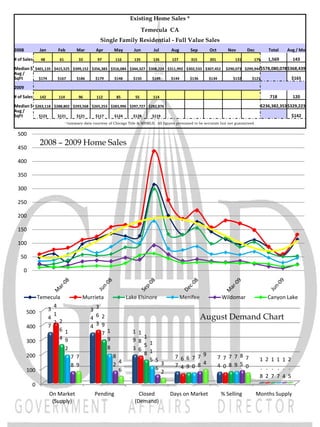
- 1. Existing Home Sales * Temecula CA Single Family Residential - Full Value Sales 2008 Jan Feb Mar Apr May Jun Jul Aug Sep Oct Nov Dec Total Avg / Mo # of Sales 48 61 33 97 116 135 126 127 315 201 131 179 1,569 143 Median $ $401,135 $415,525 $399,152 $356,383 $316,084 $344,327 $308,224 $311,992 $302,533 $307,452 $290,073 $299,944$578,080,078 $368,439 Avg / SqFt $174 $167 $186 $179 $148 $150 $145 $144 $136 $134 $132 $123 $165 2009 # of Sales 142 114 96 112 85 55 114 718 120 Median $ $263,118 $288,802 $293,568 $265,253 $283,996 $297,727 $282,876 $236,382,353 $329,223 Avg / SqFt $123 $121 $121 $117 $124 $128 $119 $142 * Summary data courtesy of Chicago Title & MRMLS. All figures presumed to be accurate but not guaranteed. 500 2008 – 2009 Home Sales 450 400 350 300 250 200 150 100 50 0 Temecula Murrieta Lake Elsinore Menifee Wildomar Canyon Lake 4 500 3 3 3 1 4 4 6 2 August Demand Chart 2 2 400 7 4 3 9 6 1 7 1 1 1 4 9 9 1 300 9 8 8 5 1 2 3 6 8 1 200 7 7 8 5 5 7 6 6 7 7 9 7 7 7 7 8 7 1 2 1 1 1 2 4 8 9 2 3 7 4 9 0 8 4 4 0 8 9 5 0 . . . . . . 100 6 6 2 8 2 7 7 4 5 0 On Market Pending Closed Days on Market % Selling Months Supply (Supply) (Demand)