SlideShare ist ein Scribd-Unternehmen logo
1 von 602
2030년 9월

2029년 9월

2028년 9월

1,000,000

2027년 9월

2026년 9월

2025년 9월

2024년 9월

2023년 9월

2022년 9월

2021년 9월

2020년 9월

2019년 9월

2018년 9월

2017년 9월

2016년 9월

2015년 9월

2014년 9월

2013년 9월

2012년 9월

2011년 9월

2010년 9월

1,200,000
Equity

Leverage

Free Cash Flow

Equity

Implied Exit Valuation

800,000

600,000

400,000

200,000

-
800

Cum Free Cash Flow
Leverage
Equity
Implied Exit Valuation
Out of Pocket Investment

9,000/Mcfe/d
Exit Valuation
@ 5 years

700

600

($MM)

500

400

300

200

100

2010

2012

2014

2016

2018

2020

2022

2024

2026

2028

2030
Leverage
Cum Cash Flow
Initial
Capex
Implied Exit Valuation
Equity
Leverage
Free Cash Flow
Equity
Implied Exit Valuation
Out of Pocket Investment

Equity
Leverage
Cum Free Cash Flow
Implied Exit Valuation
Out of Pocket Investment

50
Sep-10
30,000
63

Oct-10
30,000
63

Nov-10
30,000
63

Dec-10
30,000
2,136

Jan-11
30,000
2,074

-

-

-

-

-

30,000
32,163

30,000
32,225

30,000
32,288

30,000
34,428

30,000
36,509

Feb-11
30,000
2,074

Mar-11
30,000
2,555

Apr-11
30,000
10,640

May-11
30,000
5,338

Jun-11
30,000
5,207

Jul-11
30,000
4,725

Aug-11
30,000
5,338

-

-

-

42,617

52,328

55,134

59,769

30,000
38,592

30,000
41,161

30,000
51,817

30,000
12,617
42,617
56,352

30,000
22,328
52,328
60,601

30,000
25,134
55,134
64,271

30,000
29,769
59,769
68,454

gazhoo.com

12-31-10 12-31-11 12-31-12 12-31-13 12-31-14 12-31-15 12-31-16 12-31-17 12-31-18 12-31-19 12-31-20 12-31-21
30,000
66,812 152,803 196,278 266,583 317,216 379,205 432,139 387,697 233,045 179,361 137,896
17,247
47,515
74,290 112,994 154,507 206,382 259,945 281,604 269,183 252,211 237,707
61,093 134,961 226,880 338,411 455,233 549,869 631,436
30,000
84,059 200,317 270,568 379,576 471,723 585,587 692,084 669,301 502,228 431,573 375,603
30,000
84,059 200,317 270,568 379,576 471,723 585,587 692,084 669,301 502,228 431,573 375,603
34,428
82,890 123,000 123,000 123,000 123,000 123,000 123,000 123,000 123,000 123,000 123,000
Leverage
Cum Cash Flow
Initial
Capex

Sep-11
5,207
30,000
5,207

Oct-11
9,932
30,000
4,725

Nov-11
15,270
30,000
5,338

Dec-11
17,247
30,000
5,207

Jan-12
16,946
30,000
3,395

Feb-12
16,678
30,000
3,395

Mar-12
16,434
30,000
3,877

Apr-12
25,985
30,000
19,915

Implied Exit Valuation

70,610

72,338

78,790

84,059

87,349

83,090

70,877

67,761

142,501

156,380

157,972

165,168

30,000
5,207
35,403
70,610
72,340

30,000
9,932
32,406
72,338
75,649

30,000
15,270
33,520
78,790
79,445

30,000
17,247
36,812
84,059
82,890

30,000
16,946
40,403
87,349
84,441

30,000
16,678
36,412
83,090
86,211

30,000
16,434
24,443
70,877
88,639

30,000
25,985
11,776
67,761
107,269

30,000
29,085
83,417
142,501
113,596

30,000
31,657
94,724
156,380
115,857

30,000
34,206
93,766
157,972
117,687

30,000
37,227
97,940
165,168
119,700

Equity
Leverage
Free Cash Flow
Equity
Implied Exit Valuation
Out of Pocket Investment

Equity
Leverage
Cum Free Cash Flow
Implied Exit Valuation
Out of Pocket Investment

m

May-12
29,085
30,000
9,212

12-31-22 12-31-23 12-31-24 12-31-25 12-31-26 12-31-27 12-31-28
12-31-29
12-31-30
120,896 113,605 107,377 102,001
97,264
92,983
89,008
85,243
81,656
216,972 195,674 178,969 165,279 153,710 143,652 134,679
126,473
118,832
694,989 749,461 801,843 851,765 899,180 944,083 986,481 1,026,365 1,063,756
337,867 309,278 286,346 267,280 250,973 236,636 223,687
211,717
200,488
337,867 309,278 286,346 267,280 250,973 236,636 223,687
211,717
200,488
123,000 123,000 123,000 123,000 123,000 123,000 123,000
123,000
123,000

Jun-12
31,657
30,000
5,335

Jul-12
34,206
30,000
5,060

Aug-12
37,227
30,000
5,410
Leverage
Cum Cash Flow
Initial
Capex

Sep-12
39,713
30,000
5,335

Oct-12
42,175
30,000
5,060

Nov-12
45,111
30,000
5,410

Dec-12
47,515
30,000
5,335

Jan-13
46,804
30,000
1,400

Feb-13
46,162
30,000
2,310

Mar-13
45,570
30,000
2,585

Apr-13
56,339
30,000
13,265

May-13
59,171
30,000
4,780

Jun-13
61,400
30,000
6,525

Jul-13
62,086
30,000
2,915

Aug-13
66,486
30,000
7,205

Implied Exit Valuation

182,315

183,176

196,140

200,317

206,260

206,348

172,038

166,177

245,714

259,272

249,887

239,330

Equity
Leverage
Free Cash Flow
Equity
Implied Exit Valuation
Out of Pocket Investment

30,000
39,713
112,602
182,315
121,401

30,000
42,175
111,001
183,176
122,651

30,000
45,111
121,029
196,140
124,011

30,000
47,515
122,803
200,317
124,951

30,000
46,804
129,456
206,260
124,951

30,000
46,162
130,186
206,348
124,951

30,000
45,570
96,469
172,038
124,951

30,000
56,339
79,838
166,177
128,701

30,000
59,171
156,544
245,714
128,701

30,000
61,400
167,872
259,272
129,556

30,000
62,086
157,801
249,887
129,556

30,000
66,486
142,844
239,330
129,556

Equity
Leverage
Cum Free Cash Flow
Implied Exit Valuation
Out of Pocket Investment
Leverage
Cum Cash Flow
Initial
Capex

Sep-13
67,117
30,000
4,100

Oct-13
69,340
30,000
5,340

Nov-13
72,129
30,000
4,780

Dec-13
74,290
30,000
8,345

Jan-14
73,351
30,000
1,820

Feb-14
72,488
30,000
2,730

Mar-14
71,680
30,000
2,095

Apr-14
89,040
30,000
19,745

May-14
91,496
30,000
5,200

Jun-14
95,161
30,000
7,550

Jul-14
Aug-14
97,167 101,333
30,000
30,000
4,850
7,625

Implied Exit Valuation

274,635

252,746

266,790

270,568

272,568

277,417

234,545

229,226

380,287

371,268

366,771

357,967

Equity
Leverage
Free Cash Flow
Equity
Implied Exit Valuation
Out of Pocket Investment

30,000
67,117
177,517
274,635
129,556

30,000
69,340
153,406
252,746
129,556

30,000
72,129
164,661
266,790
129,556

30,000
74,290
166,278
270,568
129,556

30,000
73,351
169,217
272,568
129,556

30,000
72,488
174,929
277,417
129,556

30,000
71,680
132,864
234,545
129,556

30,000
89,040
110,186
229,226
133,966

30,000
91,496
258,791
380,287
133,966

30,000
95,161
246,107
371,268
133,966

30,000
97,167
239,605
366,771
133,966

30,000
101,333
226,634
357,967
133,966

Equity
Leverage
Cum Free Cash Flow
Implied Exit Valuation
Out of Pocket Investment
Leverage
Cum Cash Flow
Initial
Capex

Sep-14
Oct-14
Nov-14
Dec-14
Jan-15
Feb-15
Mar-15
Apr-15
May-15
Jun-15
Jul-15
Aug-15
103,311 106,947 109,398 112,994 111,639 110,417 109,278 127,621 132,383 134,534 136,744 143,271
532
3,627
9,687
17,617
22,432
29,069
36,503
30,000
30,000
30,000
30,000
30,000
30,000
30,000
30,000
30,000
30,000
30,000
30,000
5,125
7,275
5,200
9,370
1,820
1,820
3,005
18,835
6,715
6,945
4,850
8,230

Implied Exit Valuation

387,275

367,940

394,337

379,576

393,340

392,829

330,704

322,989

474,716

476,914

444,688

436,762

Equity
Leverage
Free Cash Flow
Equity
Implied Exit Valuation
Out of Pocket Investment

30,000
103,311
253,964
387,275
133,966

30,000
106,947
230,993
367,940
133,966

30,000
109,398
254,939
394,337
133,966

30,000
112,994
236,583
379,576
133,966

30,000
111,639
251,702
393,340
133,966

30,000
110,417
532
252,412
392,829
133,966

30,000
109,278
3,627
191,426
330,704
133,966

30,000
127,621
9,687
165,369
322,989
133,966

30,000
132,383
17,617
312,333
474,716
133,966

30,000
134,534
22,432
312,380
476,914
133,966

30,000
136,744
29,069
277,944
444,688
133,966

30,000
143,271
36,503
263,491
436,762
133,966

Equity
Leverage
Cum Free Cash Flow
Implied Exit Valuation
Out of Pocket Investment
Leverage
Cum Cash Flow
Initial
Capex

Sep-15
Oct-15
Nov-15
Dec-15
Jan-16
Feb-16
Mar-16
Apr-16
May-16
Jun-16
Jul-16
Aug-16
145,392 147,554 152,391 154,507 152,903 151,411 150,001 175,176 179,949 182,691 187,067 191,818
42,450
49,443
57,330
61,093
65,599
70,397
73,552
81,973
89,448
96,133 102,857 110,583
30,000
30,000
30,000
30,000
30,000
30,000
30,000
30,000
30,000
30,000
30,000
30,000
6,035
4,850
6,715
8,765
4,140
3,230
4,415
25,305
10,050
8,460
9,700
9,140

Implied Exit Valuation

486,091

458,500

468,159

471,723

465,661

462,960

409,452

403,610

586,034

591,053

556,828

561,981

Equity
Leverage
Free Cash Flow
Equity
Implied Exit Valuation
Out of Pocket Investment

30,000
145,392
42,450
310,699
486,091
133,966

30,000
147,554
49,443
280,947
458,500
133,966

30,000
152,391
57,330
285,769
468,159
133,966

30,000
154,507
61,093
287,216
471,723
133,966

30,000
152,903
65,599
282,758
465,661
133,966

30,000
151,411
70,397
281,549
462,960
133,966

30,000
150,001
73,552
229,451
409,452
133,966

30,000
175,176
81,973
198,433
403,610
133,966

30,000
179,949
89,448
376,085
586,034
133,966

30,000
182,691
96,133
378,363
591,053
133,966

30,000
187,067
102,857
339,761
556,828
133,966

30,000
191,818
110,583
340,163
561,981
133,966

Equity
Leverage
Cum Free Cash Flow
Implied Exit Valuation
Out of Pocket Investment
Leverage
Cum Cash Flow
Initial
Capex

Sep-16
Oct-16
Nov-16
Dec-16
Jan-17
Feb-17
Mar-17
Apr-17
May-17
Jun-17
Jul-17
Aug-17
196,143 198,866 203,687 206,382 204,380 202,508 200,731 230,195 234,122 237,639 241,195 245,260
117,238 125,081 132,106 134,961 141,724 147,796 153,082 159,996 169,105 177,343 185,653 194,027
30,000
30,000
30,000
30,000
30,000
30,000
30,000
30,000
30,000
30,000
30,000
30,000
9,975
7,275
10,050
12,350
3,640
3,640
3,915
33,040
10,050
9,975
9,700
10,050

Implied Exit Valuation

590,731

577,625

590,932

585,587

581,365

601,730

515,821

510,072

720,098

717,719

683,741

679,748

Equity
Leverage
Free Cash Flow
Equity
Implied Exit Valuation
Out of Pocket Investment

30,000
196,143
117,238
364,588
590,731
133,966

30,000
198,866
125,081
348,759
577,625
133,966

30,000
203,687
132,106
357,245
590,932
133,966

30,000
206,382
134,961
349,205
585,587
133,966

30,000
204,380
141,724
346,985
581,365
133,966

30,000
202,508
147,796
369,223
601,730
133,966

30,000
200,731
153,082
285,090
515,821
133,966

30,000
230,195
159,996
249,877
510,072
133,966

30,000
234,122
169,105
455,977
720,098
133,966

30,000
237,639
177,343
450,080
717,719
133,966

30,000
241,195
185,653
412,546
683,741
133,966

30,000
245,260
194,027
404,488
679,748
133,966

Equity
Leverage
Cum Free Cash Flow
Implied Exit Valuation
Out of Pocket Investment
Leverage
Cum Cash Flow
Initial
Capex

Sep-17
Oct-17
Nov-17
Dec-17
Jan-18
Feb-18
Mar-18
Apr-18
May-18
Jun-18
Jul-18
Aug-18
248,818 252,373 256,419 259,945 257,552 255,312 253,183 269,367 271,818 272,352 272,959 277,065
202,031 210,308 218,749 226,880 237,296 246,909 254,758 263,033 273,888 282,239 292,299 302,174
30,000
30,000
30,000
30,000
30,000
30,000
30,000
30,000
30,000
30,000
30,000
30,000
9,975
9,700
10,050
9,975
1,820
1,820
3,005
20,350
6,715
6,945
4,850
8,230

Implied Exit Valuation

705,778

683,666

708,339

692,084

694,817

719,769

618,313

612,791

719,488

726,444

681,834

667,975

Equity
Leverage
Free Cash Flow
Equity
Implied Exit Valuation
Out of Pocket Investment

30,000
248,818
202,031
426,960
705,778
133,966

30,000
252,373
210,308
401,293
683,666
133,966

30,000
256,419
218,749
421,920
708,339
133,966

30,000
259,945
226,880
402,139
692,084
133,966

30,000
257,552
237,296
407,265
694,817
133,966

30,000
255,312
246,909
434,457
719,769
133,966

30,000
253,183
254,758
335,130
618,313
133,966

30,000
269,367
263,033
313,423
612,791
133,966

30,000
271,818
273,888
417,670
719,488
133,966

30,000
272,352
282,239
424,092
726,444
133,966

30,000
272,959
292,299
378,876
681,834
133,966

30,000
277,065
302,174
360,910
667,975
133,966

Equity
Leverage
Cum Free Cash Flow
Implied Exit Valuation
Out of Pocket Investment
Leverage
Cum Cash Flow
Initial
Capex

Sep-18
Oct-18
Nov-18
Dec-18
Jan-19
Feb-19
Mar-19
Apr-19
May-19
Jun-19
Jul-19
Aug-19
277,658 278,302 280,954 281,604 279,332 277,167 275,082 282,426 280,947 279,010 277,120 275,769
311,102 320,944 330,709 338,411 349,926 360,888 371,155 381,277 391,408 400,925 410,469 419,933
30,000
30,000
30,000
30,000
30,000
30,000
30,000
30,000
30,000
30,000
30,000
30,000
6,035
4,850
6,715
6,945
275
9,440
350
275
350

Implied Exit Valuation

708,556

670,997

683,038

669,301

659,554

695,891

605,252

605,585

573,529

581,299

548,715

536,187

Equity
Leverage
Free Cash Flow
Equity
Implied Exit Valuation
Out of Pocket Investment

30,000
277,658
311,102
400,898
708,556
133,966

30,000
278,302
320,944
362,696
670,997
133,966

30,000
280,954
330,709
372,083
683,038
133,966

30,000
281,604
338,411
357,697
669,301
133,966

30,000
279,332
349,926
350,221
659,554
133,966

30,000
277,167
360,888
388,723
695,891
133,966

30,000
275,082
371,155
300,169
605,252
133,966

30,000
282,426
381,277
293,159
605,585
133,966

30,000
280,947
391,408
262,582
573,529
133,966

30,000
279,010
400,925
272,290
581,299
133,966

30,000
277,120
410,469
241,596
548,715
133,966

30,000
275,769
419,933
230,418
536,187
133,966

Equity
Leverage
Cum Free Cash Flow
Implied Exit Valuation
Out of Pocket Investment
Leverage
Cum Cash Flow
Initial
Capex

Sep-19
Oct-19
Nov-19
Dec-19
Jan-20
Feb-20
Mar-20
Apr-20
May-20
Jun-20
Jul-20
Aug-20
273,948 272,165 270,913 269,183 267,485 265,816 264,176 263,058 261,951 260,359 258,791 257,743
428,847 437,838 446,793 455,233 463,782 472,174 480,141 488,391 496,591 504,315 512,182 520,071
30,000
30,000
30,000
30,000
30,000
30,000
30,000
30,000
30,000
30,000
30,000
30,000
275
350
275
275
350
350
275
350

Implied Exit Valuation

546,364

517,779

524,569

502,228

493,021

517,835

476,357

484,367

465,550

477,757

455,134

448,356

Equity
Leverage
Free Cash Flow
Equity
Implied Exit Valuation
Out of Pocket Investment

30,000
273,948
428,847
242,416
546,364
133,966

30,000
272,165
437,838
215,614
517,779
133,966

30,000
270,913
446,793
223,656
524,569
133,966

30,000
269,183
455,233
203,045
502,228
133,966

30,000
267,485
463,782
195,536
493,021
133,966

30,000
265,816
472,174
222,019
517,835
133,966

30,000
264,176
480,141
182,181
476,357
133,966

30,000
263,058
488,391
191,309
484,367
133,966

30,000
261,951
496,591
173,599
465,550
133,966

30,000
260,359
504,315
187,398
477,757
133,966

30,000
258,791
512,182
166,343
455,134
133,966

30,000
257,743
520,071
160,613
448,356
133,966

Equity
Leverage
Cum Free Cash Flow
Implied Exit Valuation
Out of Pocket Investment
Leverage
Cum Cash Flow
Initial
Capex

Sep-20
Oct-20
Nov-20
Dec-20
Jan-21
Feb-21
Mar-21
Apr-21
May-21
Jun-21
Jul-21
Aug-21
256,207 254,693 253,698 252,211 250,745 249,298 247,869 246,955 246,057 244,679 243,316 242,465
527,499 535,083 542,701 549,869 557,203 564,433 571,290 578,475 585,569 592,156 598,935 605,782
30,000
30,000
30,000
30,000
30,000
30,000
30,000
30,000
30,000
30,000
30,000
30,000
275
350
275
275
350
350
275
350

Implied Exit Valuation

460,819

439,481

447,804

431,573

425,662

465,078

414,759

423,345

404,829

413,523

395,710

391,408

Equity
Leverage
Free Cash Flow
Equity
Implied Exit Valuation
Out of Pocket Investment

30,000
256,207
527,499
174,612
460,819
133,966

30,000
254,693
535,083
154,788
439,481
133,966

30,000
253,698
542,701
164,106
447,804
133,966

30,000
252,211
549,869
149,361
431,573
133,966

30,000
250,745
557,203
144,917
425,662
133,966

30,000
249,298
564,433
185,780
465,078
133,966

30,000
247,869
571,290
136,890
414,759
133,966

30,000
246,955
578,475
146,390
423,345
133,966

30,000
246,057
585,569
128,772
404,829
133,966

30,000
244,679
592,156
138,844
413,523
133,966

30,000
243,316
598,935
122,394
395,710
133,966

30,000
242,465
605,782
118,943
391,408
133,966

Equity
Leverage
Cum Free Cash Flow
Implied Exit Valuation
Out of Pocket Investment
Leverage
Cum Cash Flow
Initial
Capex

Sep-21
Oct-21
Nov-21
Dec-21
Jan-22
Feb-22
Mar-22
Apr-22
May-22
Jun-22
Jul-22
Aug-22
241,131 239,811 239,001 237,707 236,426 235,157 233,900 233,151 232,413 230,289 227,904 225,591
612,130 618,679 625,303 631,436 637,777 644,053 649,990 656,288 662,525 667,382 672,186 676,645
30,000
30,000
30,000
30,000
30,000
30,000
30,000
30,000
30,000
30,000
30,000
30,000
275
350
275
275
350
350
275
350

Implied Exit Valuation

400,160

383,242

392,002

375,603

371,962

407,909

364,997

373,716

358,407

367,093

352,167

349,170

Equity
Leverage
Free Cash Flow
Equity
Implied Exit Valuation
Out of Pocket Investment

30,000
241,131
612,130
129,029
400,160
133,966

30,000
239,811
618,679
113,432
383,242
133,966

30,000
239,001
625,303
123,001
392,002
133,966

30,000
237,707
631,436
107,896
375,603
133,966

30,000
236,426
637,777
105,536
371,962
133,966

30,000
235,157
644,053
142,752
407,909
133,966

30,000
233,900
649,990
101,097
364,997
133,966

30,000
233,151
656,288
110,566
373,716
133,966

30,000
232,413
662,525
95,994
358,407
133,966

30,000
230,289
667,382
106,804
367,093
133,966

30,000
227,904
672,186
94,263
352,167
133,966

30,000
225,591
676,645
93,579
349,170
133,966

Equity
Leverage
Cum Free Cash Flow
Implied Exit Valuation
Out of Pocket Investment
Leverage
Cum Cash Flow
Initial
Capex

Sep-22
Oct-22
Nov-22
Dec-22
Jan-23
Feb-23
Mar-23
Apr-23
May-23
Jun-23
Jul-23
Aug-23
223,345 221,162 219,038 216,972 214,957 212,994 211,079 209,209 207,384 205,600 203,856 202,149
681,182 685,995 690,456 694,989 699,791 704,587 709,101 713,530 717,950 722,433 727,179 731,563
30,000
30,000
30,000
30,000
30,000
30,000
30,000
30,000
30,000
30,000
30,000
30,000
275
350
275
275
350
350
275
350

Implied Exit Valuation

357,776

343,385

351,939

337,867

335,199

368,236

330,047

338,468

325,105

333,465

320,359

318,060

Equity
Leverage
Free Cash Flow
Equity
Implied Exit Valuation
Out of Pocket Investment

30,000
223,345
681,182
104,431
357,776
133,966

30,000
221,162
685,995
92,223
343,385
133,966

30,000
219,038
690,456
102,900
351,939
133,966

30,000
216,972
694,989
90,896
337,867
133,966

30,000
214,957
699,791
90,242
335,199
133,966

30,000
212,994
704,587
125,242
368,236
133,966

30,000
211,079
709,101
88,968
330,047
133,966

30,000
209,209
713,530
99,258
338,468
133,966

30,000
207,384
717,950
87,721
325,105
133,966

30,000
205,600
722,433
97,865
333,465
133,966

30,000
203,856
727,179
86,504
320,359
133,966

30,000
202,149
731,563
85,911
318,060
133,966

Equity
Leverage
Cum Free Cash Flow
Implied Exit Valuation
Out of Pocket Investment
Leverage
Cum Cash Flow
Initial
Capex

Sep-23
Oct-23
Nov-23
Dec-23
Jan-24
Feb-24
Mar-24
Apr-24
May-24
Jun-24
Jul-24
Aug-24
200,480 198,845 197,243 195,674 194,136 192,626 191,146 189,694 188,268 186,869 185,494 184,144
736,009 740,716 745,058 749,461 754,124 758,770 763,127 767,392 771,641 775,949 780,515 784,715
30,000
30,000
30,000
30,000
30,000
30,000
30,000
30,000
30,000
30,000
30,000
30,000
275
350
275
275
350
350
275
350

Implied Exit Valuation

326,324

313,588

321,785

309,278

307,188

326,169

303,107

311,150

299,163

307,147

295,350

293,495

Equity
Leverage
Free Cash Flow
Equity
Implied Exit Valuation
Out of Pocket Investment

30,000
200,480
736,009
95,844
326,324
133,966

30,000
198,845
740,716
84,744
313,588
133,966

30,000
197,243
745,058
94,542
321,785
133,966

30,000
195,674
749,461
83,605
309,278
133,966

30,000
194,136
754,124
83,053
307,188
133,966

30,000
192,626
758,770
103,543
326,169
133,966

30,000
191,146
763,127
81,961
303,107
133,966

30,000
189,694
767,392
91,456
311,150
133,966

30,000
188,268
771,641
80,895
299,163
133,966

30,000
186,869
775,949
90,278
307,147
133,966

30,000
185,494
780,515
79,856
295,350
133,966

30,000
184,144
784,715
79,352
293,495
133,966

Equity
Leverage
Cum Free Cash Flow
Implied Exit Valuation
Out of Pocket Investment
Leverage
Cum Cash Flow
Initial
Capex

Sep-24
Oct-24
Nov-24
Dec-24
Jan-25
Feb-25
Mar-25
Apr-25
May-25
Jun-25
Jul-25
Aug-25
182,817 181,512 180,230 178,969 177,728 176,508 175,306 174,123 172,959 171,812 170,683 169,570
788,973 793,488 797,637 801,843 806,308 810,755 814,909 818,970 823,015 827,117 831,477 835,470
30,000
30,000
30,000
30,000
30,000
30,000
30,000
30,000
30,000
30,000
30,000
30,000
275
350
275
275
350
350
275
350

Implied Exit Valuation

301,389

289,861

297,690

286,346

284,632

313,256

281,268

288,943

278,009

285,623

274,839

273,290

Equity
Leverage
Free Cash Flow
Equity
Implied Exit Valuation
Out of Pocket Investment

30,000
182,817
788,973
88,572
301,389
133,966

30,000
181,512
793,488
78,349
289,861
133,966

30,000
180,230
797,637
87,460
297,690
133,966

30,000
178,969
801,843
77,377
286,346
133,966

30,000
177,728
806,308
76,904
284,632
133,966

30,000
176,508
810,755
106,748
313,256
133,966

30,000
175,306
814,909
75,962
281,268
133,966

30,000
174,123
818,970
84,820
288,943
133,966

30,000
172,959
823,015
75,050
278,009
133,966

30,000
171,812
827,117
83,811
285,623
133,966

30,000
170,683
831,477
74,156
274,839
133,966

30,000
169,570
835,470
73,720
273,290
133,966

Equity
Leverage
Cum Free Cash Flow
Implied Exit Valuation
Out of Pocket Investment
Leverage
Cum Cash Flow
Initial
Capex

Sep-25
Oct-25
Nov-25
Dec-25
Jan-26
Feb-26
Mar-26
Apr-26
May-26
Jun-26
Jul-26
Aug-26
168,474 167,394 166,330 165,279 164,244 163,223 162,215 161,221 160,240 159,272 158,316 157,372
839,520 843,828 847,768 851,765 856,021 860,259 864,204 868,057 871,893 875,787 879,937 883,720
30,000
30,000
30,000
30,000
30,000
30,000
30,000
30,000
30,000
30,000
30,000
30,000
275
350
275
275
350
350
275
350

Implied Exit Valuation

280,819

270,247

277,717

267,280

265,839

292,736

262,984

270,308

260,211

267,472

257,496

256,163

Equity
Leverage
Free Cash Flow
Equity
Implied Exit Valuation
Out of Pocket Investment

30,000
168,474
839,520
82,344
280,819
133,966

30,000
167,394
843,828
72,853
270,247
133,966

30,000
166,330
847,768
81,387
277,717
133,966

30,000
165,279
851,765
72,001
267,280
133,966

30,000
164,244
856,021
71,596
265,839
133,966

30,000
163,223
860,259
99,514
292,736
133,966

30,000
162,215
864,204
70,769
262,984
133,966

30,000
161,221
868,057
79,086
270,308
133,966

30,000
160,240
871,893
69,971
260,211
133,966

30,000
159,272
875,787
78,199
267,472
133,966

30,000
158,316
879,937
69,179
257,496
133,966

30,000
157,372
883,720
68,791
256,163
133,966

Equity
Leverage
Cum Free Cash Flow
Implied Exit Valuation
Out of Pocket Investment
Leverage
Cum Cash Flow
Initial
Capex

Sep-26
Oct-26
Nov-26
Dec-26
Jan-27
Feb-27
Mar-27
Apr-27
May-27
Jun-27
Jul-27
Aug-27
156,440 155,519 154,609 153,710 152,821 151,941 151,072 150,213 149,363 148,522 147,689 146,866
887,561 891,660 895,391 899,180 903,226 907,254 910,990 914,634 918,261 921,945 925,886 929,460
30,000
30,000
30,000
30,000
30,000
30,000
30,000
30,000
30,000
30,000
30,000
30,000
275
350
275
275
350
350
275
350

Implied Exit Valuation

263,343

253,540

260,665

250,973

249,720

275,091

247,229

254,210

244,802

251,717

242,408

241,237

Equity
Leverage
Free Cash Flow
Equity
Implied Exit Valuation
Out of Pocket Investment

30,000
156,440
887,561
76,903
263,343
133,966

30,000
155,519
891,660
68,021
253,540
133,966

30,000
154,609
895,391
76,057
260,665
133,966

30,000
153,710
899,180
67,264
250,973
133,966

30,000
152,821
903,226
66,900
249,720
133,966

30,000
151,941
907,254
93,150
275,091
133,966

30,000
151,072
910,990
66,156
247,229
133,966

30,000
150,213
914,634
73,997
254,210
133,966

30,000
149,363
918,261
65,439
244,802
133,966

30,000
148,522
921,945
73,195
251,717
133,966

30,000
147,689
925,886
64,719
242,408
133,966

30,000
146,866
929,460
64,371
241,237
133,966

Equity
Leverage
Cum Free Cash Flow
Implied Exit Valuation
Out of Pocket Investment
Leverage
Cum Cash Flow
Initial
Capex

Sep-27
Oct-27
Nov-27
Dec-27
Jan-28
Feb-28
Mar-28
Apr-28
May-28
Jun-28
Jul-28
Aug-28
146,050 145,243 144,443 143,652 142,867 142,090 141,321 140,558 139,801 139,051 138,308 137,571
933,092 936,981 940,503 944,083 947,920 951,739 955,267 958,702 962,119 965,594 969,328 972,694
30,000
30,000
30,000
30,000
30,000
30,000
30,000
30,000
30,000
30,000
30,000
30,000
275
350
275
275
350
350
275
350

Implied Exit Valuation

248,071

238,910

245,695

236,636

235,505

250,553

233,284

239,927

231,091

237,676

228,940

227,879

Equity
Leverage
Free Cash Flow
Equity
Implied Exit Valuation
Out of Pocket Investment

30,000
146,050
933,092
72,021
248,071
133,966

30,000
145,243
936,981
63,667
238,910
133,966

30,000
144,443
940,503
71,252
245,695
133,966

30,000
143,652
944,083
62,983
236,636
133,966

30,000
142,867
947,920
62,637
235,505
133,966

30,000
142,090
951,739
78,463
250,553
133,966

30,000
141,321
955,267
61,963
233,284
133,966

30,000
140,558
958,702
69,369
239,927
133,966

30,000
139,801
962,119
61,290
231,091
133,966

30,000
139,051
965,594
68,625
237,676
133,966

30,000
138,308
969,328
60,632
228,940
133,966

30,000
137,571
972,694
60,308
227,879
133,966

Equity
Leverage
Cum Free Cash Flow
Implied Exit Valuation
Out of Pocket Investment
Leverage
Cum Cash Flow
Initial
Capex

Sep-28
Oct-28
Nov-28
Dec-28
Jan-29
Feb-29
Mar-29
Apr-29
May-29
Jun-29
Jul-29
Aug-29
136,839 136,113 135,393 134,679 133,969 133,264 132,565 131,871 131,181 130,495 129,815 129,138
976,116 979,796 983,110 986,481 990,108 993,719 997,038 ######## ######## ######## ######## ########
30,000
30,000
30,000
30,000
30,000
30,000
30,000
30,000
30,000
30,000
30,000
30,000
275
350
275
275
350
350
275
350

Implied Exit Valuation

234,368

225,762

232,213

223,687

222,646

245,371

220,612

Equity
Leverage
Free Cash Flow
Equity
Implied Exit Valuation
Out of Pocket Investment

30,000
136,839
976,116
67,529
234,368
133,966

30,000
136,113
979,796
59,649
225,762
133,966

30,000
135,393
983,110
66,820
232,213
133,966

30,000
134,679
986,481
59,008
223,687
133,966

30,000
133,969
990,108
58,677
222,646
133,966

30,000
133,264
993,719
82,106
245,371
133,966

30,000
30,000
30,000
132,565 131,871 131,181
997,038 ######## ########
58,047
65,049
57,408
220,612 226,920 218,589
133,966 133,966 133,966

Equity
Leverage
Cum Free Cash Flow
Implied Exit Valuation
Out of Pocket Investment

226,920

218,589

224,841

216,599

215,613

30,000
130,495
########
64,345
224,841
133,966

30,000
129,815
########
56,785
216,599
133,966

30,000
129,138
########
56,475
215,613
133,966
Leverage
Cum Cash Flow
Initial
Capex
Implied Exit Valuation
Equity
Leverage
Free Cash Flow
Equity
Implied Exit Valuation
Out of Pocket Investment

Equity
Leverage
Cum Free Cash Flow
Implied Exit Valuation
Out of Pocket Investment

Sep-29
Oct-29
Nov-29
Dec-29
Jan-30
Feb-30
Mar-30
Apr-30
May-30
Jun-30
Jul-30
Aug-30
128,466 127,798 127,133 126,473 125,817 125,165 124,516 123,870 123,229 122,591 121,956 121,324
######## ######## ######## ######## ######## ######## ######## ######## ######## ######## ######## ########
30,000
30,000
30,000
30,000
30,000
30,000
30,000
30,000
30,000
30,000
30,000
30,000
275
350
275
275
350
350
275
350
221,778

213,650

219,768

211,717

210,748

232,267

208,840

214,824

206,951

212,875

205,077

204,148

30,000
128,466
########
63,312
221,778
133,966

30,000
127,798
########
55,852
213,650
133,966

30,000
127,133
########
62,634
219,768
133,966

30,000
126,473
########
55,243
211,717
133,966

30,000
125,817
########
54,931
210,748
133,966

30,000
125,165
########
77,102
232,267
133,966

30,000
124,516
########
54,324
208,840
133,966

30,000
123,870
########
60,954
214,824
133,966

30,000
123,229
########
53,722
206,951
133,966

30,000
122,591
########
60,285
212,875
133,966

30,000
121,956
########
53,121
205,077
133,966

30,000
121,324
########
52,824
204,148
133,966
Leverage
Cum Cash Flow
Initial
Capex
Implied Exit Valuation
Equity
Leverage
Free Cash Flow
Equity
Implied Exit Valuation
Out of Pocket Investment

Equity
Leverage
Cum Free Cash Flow
Implied Exit Valuation
Out of Pocket Investment

Sep-30
Oct-30
Nov-30
Dec-30
Jan-31
Feb-31
Mar-31
Apr-31
May-31
Jun-31
Jul-31
120,697 120,072 119,450 118,832 118,217 117,605 116,996 116,390 115,788 115,188 114,592
######## ######## ######## ######## ######## ######## ######## ######## ######## ######## ########
30,000
30,000
30,000
30,000
30,000
30,000
30,000
30,000
30,000
30,000
30,000
275
350
275
275
975
625
210,003

202,305

208,106

200,488

199,580

219,960

197,778

203,449

196,005

201,620

194,240

30,000
120,697
########
59,307
210,003
133,966

30,000
120,072
########
52,234
202,305
133,966

30,000
119,450
########
58,656
208,106
133,966

30,000
118,832
########
51,656
200,488
133,966

30,000
118,217
########
51,363
199,580
133,966

30,000
117,605
########
72,355
219,960
133,966

30,000
116,996
########
50,782
197,778
133,966

30,000
116,390
########
57,059
203,449
133,966

30,000
115,788
########
50,217
196,005
133,966

30,000
115,188
########
56,431
201,620
133,966

30,000
114,592
########
49,647
194,240
133,966

x
x
x
x
x
x
x
x
x
x
x
x
x
x
x
x
x
x
x
x
x
x
SUMMARY ASSUMPTIONS (data in US$000s, except per unit data)
General Assumptions
Model Name
Model Start Date
Choose Drilling Case

Silicon
09-30-10
2
1 = Slow
2 = Base
3 = Accelerated

Choose Location Case

4
1 = 1,000'
2 = 500'
3 = Google Location
4 = Dev Plan
92%
251
1
Oil ($/bbl)
1 = Strip
2 = Strip
3 = Strip
4 = Strip

M arcellus Summary Drilling Schedule
Targeted Wells Per Year
2012
2013
28
28
24
24
4
4

Discount Rate
Tax Rate

2010
2
1
1

2011
16
12
4

1

Slow
Hz Dry
Hz Wet
Vert Dry
Vert Wet

2
1
1

160
16
25
119

160
16
102
42

2

Base
Hz Dry
Hz Wet
Vert Dry
Vert Wet

2
1
1

16
12
4

3

Location Risking (Non-reviewed)
1,000 ft Locations
Choose Pricing Case
Gas ($/MMBtu)
1 = Strip
2 = $4.00 - LT
3 = $6.00 - LT
4 = $7.00 - LT

Name /
Type
Base
Hz Dry
Hz Wet
Vert Dry
Vert Wet

Accelerated
Hz Dry
Hz Wet
Vert Dry
Vert Wet

2
1
1

168
24
25
119

Case
2

2015
36
13
19
4

2016
52
48
4

63
16
47
-

32
32
-

32
1
31
-

32
32
-

28
24
4

28
24
4

36
32
4

36
13
19
4

52
48
4

172
28
102
42

83
36
47
-

48
25
23
-

48
48
-

48
48
-

Horizontal
Wet
17
17

Unrisked Well I nventory Summary
Pennsylvania
Well Type
Vertical
Vertical
Horizontal
Dry
Wet
Total
96
17
15
16
20
16
45
25
7
22
9
4
10
6
17
14
123
96
120

Vertical
Total
96
15
20
45
7
9
10
17
219

Dry
Total
31
36
70
29
13
16
31
226

Wet
Total
113
113

Horizontal
Wet
56
39
95
112

Unrisked Well I nventory Summary
West Virginia
Well Type
Vertical
Vertical
Horizontal
Dry
Wet
Total
3
2
13
11
2
2
2
35
56
25
21
8
2
3
1
31
39
56
66
134
179
162
254

Vertical
Total
3
13
2
2
35
25
8
3
31
122
341

Dry
Total
5
24
2
4
46
10
4
95
321

Wet
Total
91
70
161
274

Risked Well I nventory Summary
Pennsylvania
Risking
% of
Risk
Horizontal
Locations
Factor
Dry
100%
100%
100%
100%
16
100%
100%
16
100%
100%
25
100%
100%
22
92%
100%
3
100%
100%
6
100%
100%
14
102

Horizontal
Wet
17
17

Vertical
Dry
15
20
45
7
8
10
17
122

Vertical
Wet
96
96

Vertical
Dry
2
11
1
2
25
8
3
52
174

Vertical
Wet
35
31
66
162

gazhoo.com

10.0%
35.0%

Advisory Fees
Misc Fees

2014
36
32
4

$1,750
$350
Joint Venture Assumptions

Committed Investment
Upfront
Carry

42.9%

$70,000
$30,000
$40,000

I nitial Working I nterest Until Carry is Satisfied
Apple WI
Google WI
Apple % Funding of Google Capex

50.0%
50.0%
75.0%

Working I nterest Post Carry
Apple WI
Google WI
Apple % Funding of Google Capex

50.0%
50.0%
0.0%

Area
Butler
Cambria
Clarion
Clearfield
Fayette
Greene
Jefferson
Somerset

Horizontal
Dry
16
16
25
22
4
6
14
103

Reserve Assumptions
Estimated Ultimate Recovery (M M cfe)
PA
WV
Marshall
Wetzel
Clearfield
Fayette
Butler
Vertical Wet
Vertical Dry
Devonian

2,955
2,955
3,093
3,269
3,235
3,164
4,319
994
1,143
166

Risking of EURs and IPs (+ / -)

-

Area
Doddridge
Gilmer
Harrison
Lewis
Marion
Marshall
Monongalia
Pleasants
Tyler
Wetzel

Operating
Marcellus
LOE per well ($000 / month)
Year 1
Year 2
Year 3
Max
Cost escalation

$4.5
$4.0
$3.5
$4.5
PA

Sev Tax (% of Rev)
Additional Sev.($ / Mcf)
Sev Tax (Year Start)
Ad Valorem Tax

WV
5.0%
2012

Devonian
LOE per well ($000 / month)
Severance Tax
Ad Valorem

5.0%
$0.047
2010
-

Reviewed = 1
1
1
1
1
1
1
1

$0.9
5.0%
4.5%

Horizontal
Drilling
Completion
Land Cost

Capital Expenditures
Clearfield
$2,000
$2,530
$320

Other
$1,500
$3,030
$320

Horizontal
Drilling
Completion
Land Cost

Fayette
$1,500
$3,030
$320

Butler
$1,500
$3,030
$320

Vertical
Drilling
Completion
Land Cost

$390
$700
$160

Devonian
1st Month
2nd Month
3rd Month

$175
$175
$75

CAPEX Increase (Decrease)

Area
Butler
Cambria
Clarion
Clearfield
Fayette
Greene
Jefferson
Somerset

Horizontal
Dry
2
11
2
21
2
1
39
142

Area
Doddridge
Gilmer
Harrison
Lewis
Marion
Marshall
Monongalia
Pleasants
Tyler
Wetzel

Reviewed = 1
1
1
1
1
1
1

Drilling Assumptions (wells per rig per month)
Horizontal
Vertical

0.67
4.00

Production Delay (Months)

% Intangible Drilling Capex

Risked Well I nventory Summary
West Virginia
Risking
% of
Risk
Horizontal
Locations
Factor
Dry
92%
100%
1
92%
100%
92%
100%
10
92%
100%
100%
100%
2
100%
100%
100%
100%
21
100%
100%
2
100%
100%
1
100%
100%
37
139
Total Locations

75%

Well Type

Well Type
Horizontal
Wet
56
39
95
112
251

Leverage Assumptions
Total Debt / PDP Reserves ($/Mcfe)
Total Debt / EBITDAX
Interest Rate

336

$1.00
2.5x
6.0%

I mplied Asset Value Assumptions
PDP Reserves ($/Mcfe)
Production ($/Mcfe/d)

$2.00
$9,000
APPLE RETURN PROJECTIONS (data in US$000s, except per unit data)

60
($106,768)
-

Cum FCF
ROI
IRR

Unlevered After-Tax Economics
M onths
96
108
$25,110
$144,164
1.2x
2.1x
3.3%
12.6%

84
($51,233)
-

Cum FCF + Asset
ROI
IRR

240
$680,784
6.1x
22.4%

I mplied Asset Value Based on PDP Reserves ($2.00 / M cfe)
M onths
36
48
60
$3,654
$74,246
$179,774
1.0x
1.6x
2.3x
1.4%
16.3%
24.4%

84
$439,287
4.3x
29.1%

Cum FCF + Asset
ROI
IRR

120
$237,040
2.8x
16.6%

I mplied Asset Value Based on Production ($9,000 / M cfe /d)
M onths
36
48
60
$110,012
$229,546
$329,994
1.8x
2.7x
3.5x
34.8%
39.5%
37.0%

84
$628,515
5.7x
35.2%

Project After-Tax NPV - Apple I nterest (@ t=0)
NPV
$276,216
$171,484
$105,970

APPLE SUM M ARY STATI STI CS (data in US$000s, except per unit data)
M onth
36
Gross Producing Well Summary
Other PA Cos
Other WV Cos
Marshall
Wetzel
Clearfield
Fayette
Butler
Vertical Wet
Vertical Dry
Devonian
Total
total recovery (MMcfe)
Apple Production and Reserves
Production Rate (MMcfe/d)
Remaining PDP Reserves (Bcfe)
Cumulative Production (Bcfe)
Cum Apple Drilling Capex

44
1
10
55
572,809

Unlevered
$191,981
$83,450
$21,682

60

Discount
10%
15%
20%

72

84

96

120

144

192

240

240

240

56
37
5
6
18
122
237,715.56

5
56
39
10
16
17
22
165

34
56
39
25
22
17
26
219

68
5
56
39
25
22
17
30
262

78
14
56
39
25
22
17
38
289

78
14
56
39
25
22
17
46
297

78
14
56
39
25
22
17
62
313

78
14
56
39
25
22
17
78
329

78
14
56
39
25
22
17
78
329

78
14
56
39
25
22
17
78
329

26.6
66.5
13.4

48.5
143.3
41.7

62.4
191.8
61.7

75.5
245.3
86.6

74.2
277.1
114.4

49.8
257.7
159.9

38.8
229.3
192.3

28.5
188.4
241.2

22.7
158.6
278.9

22.7
158.6
278.9

22.7
158.6
278.9

₩

178,478

331,847

432,652

556,312

649,747

687,482

692,482

702,482

712,482

712,482

712,482

Unlevered After-Tax Data
Investment
Apple Equity JV Investment

$129,556

$133,966

$133,966

$133,966

$133,966

$133,966

$133,966

$133,966

$133,966

$133,966

$133,966

Cash Flow
Cum Apple Operating Cash Flow
Cum Apple Free Cash Flow

$81,259
(129,318)

$257,179
(106,768)

$383,517
(81,235)

$537,179
(51,233)

$706,957
25,110

$956,622
237,040

$1,091,130
366,548

$1,282,367
547,785

$1,425,366
680,784

$1,425,366
680,784

$1,425,366
680,784

Returns (Cash Flow)
Apple ROI
Apple IRR
Apple Remaining Project PV@10.0%

$413,341

$476,037

$496,497

$514,404

1.2x
3.3%
$485,582

2.8x
16.6%
$351,677

3.7x
19.8%
$281,559

5.1x
21.8%
$188,089

6.1x
22.4%
$111,478

6.1x
22.4%
$111,478

6.1x
22.4%
$111,478

1.8x
34.8%

3.5x
37.0%

4.6x
36.7%

5.8x
35.2%

6.2x
31.9%

6.1x
26.4%

6.4x
24.4%

7.0x
23.1%

7.6x
22.7%

7.6x
22.7%

7.6x
22.7%

Levered After-Tax Data
Investment
Apple Equity JV Investment

$85,203

$85,203

$85,203

$85,203

$85,203

$85,203

$85,203

$85,203

$85,203

$85,203

$85,203

Cash Flow
Cum Apple Operating Cash Flow
Cum Apple Free Cash Flow

$77,054
(67,038)

$241,100
20,424

$357,705
84,771

$498,495
155,343

$652,616
247,834

$894,866
433,027

$1,020,783
521,793

$1,182,925
605,715

$1,304,372
681,114

$1,304,372
681,114

$1,304,372
681,114

$517,415

1.2x
6.768%
$601,966

2.0x
19.752%
$635,056

2.8x
27.098%
$666,819

3.9x
32.399%
$653,237

6.1x
37.410%
$528,268

7.1x
38.462%
$429,516

8.1x
38.806%
$288,766

9.0x
38.889%
$171,435

9.0x
38.889%
$171,435

9.0x
38.889%
$171,435

2.2x
41.1%

4.7x
46.7%

6.4x
47.4%

8.0x
46.5%

8.5x
43.8%

8.3x
40.0%

8.5x
39.2%

9.2x
38.8%

9.9x
38.8%

9.9x
38.8%

9.9x
38.8%

Implied Asset Value (Production)
Apple ROI
Apple IRR

Returns (Cash Flow)
Apple ROI
Apple IRR
Apple Remaining Project PV@10.0%
Implied Asset Value (Production)
Apple ROI
Apple IRR
Monthly Projections (Summary)
2010
Sep-10

2010
Oct-10

2010
Nov-10

2010
Dec-10

2011
Jan-11

2011
Feb-11

2011
M ar-11

2011
Apr-11

2011
M ay-11

2011
Jun-11

2011
Jul-11

2011
Aug-11

3.75
3.75
4.00
3.79
3.75
4.00
61.78
39.74
0.00
0.00
0.00
0.00
0.00
0.00
125.00
0.00
-30,000.00
-32,162.50
-32,162.50

3.75
3.75
4.00
3.79
3.75
4.00
61.78
39.74
0.00
0.00
0.00
0.00
0.00
0.00
125.00
0.00
0.00
-62.50
-32,225.00

3.96
3.96
4.21
3.99
3.96
4.21
62.66
40.28
0.00
0.00
0.00
0.00
0.00
0.00
125.00
0.00
0.00
-62.50
-32,287.50

4.22
4.22
4.47
4.24
4.22
4.47
63.51
40.79
0.00
0.00
0.00
0.00
9.00
-9.00
2,495.00
-4.50
0.00
-2,140.75
-34,428.25

4.42
4.42
4.67
4.42
4.42
4.67
64.28
41.27
0.00
0.00
0.00
0.00
13.50
-13.50
2,783.17
-6.75
0.00
-2,080.83
-36,509.08

4.42
4.42
4.67
4.43
4.42
4.67
64.96
41.68
0.00
0.00
0.00
0.00
18.00
-18.00
2,783.17
-9.00
0.00
-2,083.08
-38,592.17

4.36
4.36
4.61
4.37
4.36
4.61
65.53
42.03
0.00
0.00
0.00
0.00
27.00
-27.00
3,333.17
-13.50
0.00
-2,568.83
-41,161.00

4.27
4.27
4.52
4.29
4.27
4.52
65.96
42.29
0.00
0.00
0.00
0.00
31.50
-31.50
12,573.17
-15.75
0.00
-10,656.08
-51,817.08

4.30
4.30
4.55
4.31
4.30
4.55
66.32
42.51
835.18
477.77
397.84
1,710.78
104.48
1,606.31
6,513.17
803.15
0.00
-4,534.68
-56,351.76

4.36
4.36
4.61
4.37
4.36
4.61
66.64
42.70
1,024.29
569.60
444.74
2,038.63
123.63
1,915.00
6,363.17
957.50
0.00
-4,249.09
-60,600.85

4.43
4.43
4.68
4.44
4.43
4.68
66.94
42.89
1,124.91
622.75
501.04
2,248.71
137.68
2,111.03
5,813.17
1,055.51
0.00
-3,669.82
-64,270.67

4.49
4.49
4.74
4.49
4.49
4.74
67.18
43.03
1,227.51
675.85
557.70
2,461.06
151.73
2,309.33
6,513.17
1,154.67
0.00
-4,183.17
-68,453.84

2010

Date
Realized Prices
Marshall Gas ($/Mcf)
Wetzel Gas ($/Mcf)
Clearfield Gas ($/Mcf)
Fayette Gas ($/Mcf)
Butler Gas ($/Mcf)
Dry Gas ($/Mcf)
Oil ($/bbl)
NGL ($/bbl)
Total Gas Revenues
Total Oil Revenues
Total NGL Revenues
Total Revenues
Total Operating Expenses
Operating Cash Flow
Total Capital Expenditures
Apple Operating Cash Flow
Apple Upfront Payment
Apple Net Free Cash Flow
Apple Cumulative Cash Flow (I

2011

2012

2013

2014

2015

2016

2017

2018

2019

2020

2021

3.92
3.92
4.17
3.95
3.92
4.17
62.43
40.14
0.00
0.00
0.00
0.00
9.00
-9.00
2,870.00
-4.50
-30,000.00

4.52
4.52
4.77
4.53
4.52
4.77
66.57
42.66
10,933.18
5,728.46
4,664.01
21,325.65
1,394.06
19,931.59
71,728.00
9,965.80
0.00

5.20
5.20
5.45
5.17
5.20
5.45
69.10
44.20
39,887.79
18,836.67
16,299.40
75,023.86
5,660.16
69,363.69
120,390.00
34,681.85
0.00

5.53
5.53
5.78
5.48
5.53
5.78
70.47
45.03
70,172.67
29,912.94
28,201.96
128,287.57
9,636.05
118,651.52
127,096.00
59,325.76
0.00

5.67
5.67
5.92
5.62
5.67
5.92
71.55
45.69
105,724.22
34,245.22
42,995.78
182,965.22
13,507.32
169,457.89
157,170.00
84,728.95
0.00

5.85
5.85
6.10
5.79
5.85
6.10
72.85
46.49
149,338.52
32,221.11
51,561.92
233,121.55
16,720.98
216,400.57
157,170.00
108,200.28
0.00

6.23
6.23
6.48
6.15
6.23
6.48
73.52
46.89
221,403.79
26,904.61
45,090.75
293,399.15
21,233.37
272,165.78
228,180.00
136,082.89
0.00

6.23
6.23
6.48
6.15
6.23
6.48
73.52
46.89
296,186.83
20,435.19
34,374.88
350,996.90
26,865.44
324,131.45
247,420.00
162,065.73
0.00

6.23
6.23
6.48
6.15
6.23
6.48
73.52
46.89
319,648.14
17,352.18
28,797.19
365,797.51
29,494.09
336,303.42
156,560.00
168,151.71
0.00

6.23
6.23
6.48
6.15
6.23
6.48
73.52
46.89
267,964.43
15,551.48
25,310.29
308,826.19
27,159.61
281,666.59
23,180.00
140,833.29
0.00

6.23
6.23
6.48
6.15
6.23
6.48
73.52
46.89
215,170.64
14,340.22
22,825.86
252,336.71
24,121.08
228,215.63
5,000.00
114,107.82
0.00

6.23
6.23
6.48
6.15
6.23
6.48
73.52
46.89
185,991.17
12,747.60
20,929.22
219,667.98
22,525.56
197,142.42
5,000.00
98,571.21
0.00

Yearly Projections (Summary)
Realized Prices
Marshall Gas ($/Mcf)
Wetzel Gas ($/Mcf)
Clearfield Gas ($/Mcf)
Fayette Gas ($/Mcf)
Butler Gas ($/Mcf)
Dry Gas ($/Mcf)
Oil ($/bbl)
NGL ($/bbl)
Total Gas Revenues
Total Oil Revenues
Total NGL Revenues
Total Revenues
Total Operating Expenses
Operating Cash Flow
Total Capital Expenditures
Apple Operating Cash Flow
Apple Upfront Payment
Monthly Projections (Summ
2011
Sep-11

2011
Oct-11

2011
Nov-11

2011
Dec-11

2012
Jan-12

2012
Feb-12

2012
M ar-12

4.52
4.52
4.77
4.52
4.52
4.77
67.40
43.16
1,432.33
767.94
612.79
2,813.06
171.81
2,641.26
6,363.17
1,320.63
0.00
-3,885.96
-72,339.79

4.61
4.61
4.86
4.61
4.61
4.86
67.62
43.30
1,538.43
813.66
665.91
3,017.99
185.75
2,832.24
5,813.17
1,416.12
0.00
-3,309.21
-75,649.00

4.88
4.88
5.13
4.87
4.88
5.13
67.86
43.44
1,710.70
858.30
717.20
3,286.20
202.31
3,083.89
6,513.17
1,541.95
0.00
-3,795.89
-79,444.89

5.22
5.22
5.47
5.19
5.22
5.47
68.11
43.60
2,039.83
942.58
766.80
3,749.21
226.67
3,522.54
6,363.17
1,761.27
0.00
-3,445.31
-82,890.20

5.42
5.42
5.67
5.38
5.42
5.67
68.27
43.69
2,191.01
979.26
813.54
3,983.81
294.65
3,689.16
4,060.83
1,844.58
0.00
-1,550.84
-84,441.04

5.38
5.38
5.63
5.35
5.38
5.63
68.42
43.79
1,942.08
864.61
722.02
3,528.70
278.76
3,249.94
4,060.83
1,624.97
0.00
-1,770.45
-86,211.49

5.25
5.25
5.50
5.22
5.25
5.50
68.58
43.88
1,731.22
780.62
658.69
3,170.53
272.99
2,897.53
4,610.83
1,448.77
0.00
-2,427.90
-88,639.39

4.93
4.93
5.18
4.92
4.93
5.18
68.73
43.98
1,510.12
715.13
610.49
2,835.74
264.15
2,571.59
22,940.83
1,285.80
0.00
-18,629.62
-107,269.01

4.94
4.94
5.19
4.93
4.94
5.19
68.89
44.07
3,217.14
1,613.33
1,396.85
6,227.32
457.82
5,769.50
10,820.83
2,884.75
0.00
-6,326.92
-113,595.92

4.98
4.98
5.23
4.96
4.98
5.23
69.04
44.16
3,459.10
1,719.31
1,459.91
6,638.32
489.80
6,148.52
10,670.83
3,074.26
0.00
-2,261.15
-115,857.08

2022

Date
Realized Prices
Marshall Gas ($/Mcf)
Wetzel Gas ($/Mcf)
Clearfield Gas ($/Mcf)
Fayette Gas ($/Mcf)
Butler Gas ($/Mcf)
Dry Gas ($/Mcf)
Oil ($/bbl)
NGL ($/bbl)
Total Gas Revenues
Total Oil Revenues
Total NGL Revenues
Total Revenues
Total Operating Expenses
Operating Cash Flow
Total Capital Expenditures
Apple Operating Cash Flow
Apple Upfront Payment
Apple Net Free Cash Flow
Apple Cumulative Cash Flow (I

2012

2023

2024

2025

2026

2027

2028

2029

2030

2031

6.23
6.23
6.48
6.15
6.23
6.48
73.52
46.89
164,558.27
10,979.96
19,407.17
194,945.41
21,368.17
173,577.24
5,000.00
86,788.62
0.00

6.23
6.23
6.48
6.15
6.23
6.48
73.52
46.89
149,212.06
9,724.25
18,130.21
177,066.52
20,527.48
156,539.04
5,000.00
78,269.52
0.00

6.23
6.23
6.48
6.15
6.23
6.48
73.52
46.89
137,314.87
8,713.59
17,020.28
163,048.74
19,873.63
143,175.10
5,000.00
71,587.55
0.00

6.23
6.23
6.48
6.15
6.23
6.48
73.52
46.89
127,663.59
7,858.96
16,035.13
151,557.68
19,334.43
132,223.25
5,000.00
66,111.62
0.00

6.23
6.23
6.48
6.15
6.23
6.48
73.52
46.89
119,578.81
7,122.75
15,143.32
141,844.88
18,877.18
122,967.70
5,000.00
61,483.85
0.00

6.23
6.23
6.48
6.15
6.23
6.48
73.52
46.89
112,608.83
6,477.06
14,315.24
133,401.13
18,479.35
114,921.78
5,000.00
57,460.89
0.00

6.23
6.23
6.48
6.15
6.23
6.48
73.52
46.89
106,429.19
5,902.90
13,535.02
125,867.12
18,124.31
107,742.80
5,000.00
53,871.40
0.00

6.23
6.23
6.48
6.15
6.23
6.48
73.52
46.89
100,793.80
5,386.65
12,797.68
118,978.13
17,799.58
101,178.55
5,000.00
50,589.28
0.00

6.23
6.23
6.48
6.15
6.23
6.48
73.52
46.89
95,537.53
4,923.67
12,101.02
112,562.22
17,496.93
95,065.29
5,000.00
47,532.64
0.00

6.23
6.23
6.48
6.15
6.23
6.48
73.52
46.89
53,424.12
2,678.92
6,752.50
62,855.54
10,074.17
52,781.37
3,750.00
26,390.68
0.00

Apr-12

2012
M ay-12

2012
Jun-12

Yearly Projections (Summa
Realized Prices
Marshall Gas ($/Mcf)
Wetzel Gas ($/Mcf)
Clearfield Gas ($/Mcf)
Fayette Gas ($/Mcf)
Butler Gas ($/Mcf)
Dry Gas ($/Mcf)
Oil ($/bbl)
NGL ($/bbl)
Total Gas Revenues
Total Oil Revenues
Total NGL Revenues
Total Revenues
Total Operating Expenses
Operating Cash Flow
Total Capital Expenditures
Apple Operating Cash Flow
Apple Upfront Payment
Monthly Projections (Summ
2012
Date
Realized Prices
Marshall Gas ($/Mcf)
Wetzel Gas ($/Mcf)
Clearfield Gas ($/Mcf)
Fayette Gas ($/Mcf)
Butler Gas ($/Mcf)
Dry Gas ($/Mcf)
Oil ($/bbl)
NGL ($/bbl)
Total Gas Revenues
Total Oil Revenues
Total NGL Revenues
Total Revenues
Total Operating Expenses
Operating Cash Flow
Total Capital Expenditures
Apple Operating Cash Flow
Apple Upfront Payment
Apple Net Free Cash Flow
Apple Cumulative Cash Flow (I

Yearly Projections (Summa
Realized Prices
Marshall Gas ($/Mcf)
Wetzel Gas ($/Mcf)
Clearfield Gas ($/Mcf)
Fayette Gas ($/Mcf)
Butler Gas ($/Mcf)
Dry Gas ($/Mcf)
Oil ($/bbl)
NGL ($/bbl)
Total Gas Revenues
Total Oil Revenues
Total NGL Revenues
Total Revenues
Total Operating Expenses
Operating Cash Flow
Total Capital Expenditures
Apple Operating Cash Flow
Apple Upfront Payment

2012
Aug-12

2013

Jul-12

Sep-12

2012
Oct-12

2012
Nov-12

2012
Dec-12

2012
Jan-13

2013
Feb-13

2013
M ar-13

5.03
5.03
5.28
5.01
5.03
5.28
69.18
44.25
3,636.25
1,796.09
1,546.98
6,979.32
517.38
6,461.94
10,120.83
3,230.97
0.00
-1,829.45
-117,686.53

5.08
5.08
5.33
5.05
5.08
5.33
69.33
44.34
3,824.60
1,877.32
1,638.96
7,340.89
546.37
6,794.52
10,820.83
3,397.26
0.00
-2,013.16
-119,699.69

5.09
5.09
5.34
5.07
5.09
5.34
69.47
44.43
4,120.07
2,000.47
1,730.64
7,851.18
583.20
7,267.98
10,670.83
3,633.99
0.00
-1,701.43
-121,401.11

5.18
5.18
5.43
5.15
5.18
5.43
69.62
44.52
4,338.19
2,075.93
1,820.39
8,234.51
612.58
7,621.93
10,120.83
3,810.97
0.00
-1,249.45
-122,650.56

5.42
5.42
5.67
5.38
5.42
5.67
69.77
44.61
4,690.23
2,150.20
1,907.93
8,748.36
648.14
8,100.23
10,820.83
4,050.11
0.00
-1,360.30
-124,010.87

5.69
5.69
5.94
5.64
5.69
5.94
69.92
44.70
5,227.78
2,264.40
1,992.99
9,485.17
694.32
8,790.86
10,670.83
4,395.43
0.00
-939.99
-124,950.86

5.87
5.87
6.12
5.81
5.87
6.12
69.99
44.74
5,539.49
2,327.90
2,073.24
9,940.63
721.25
9,219.38
2,799.67
4,609.69
0.00
3,209.86
-121,741.00

5.82
5.82
6.07
5.76
5.82
6.07
70.06
44.78
4,975.51
2,081.49
1,871.63
8,928.63
673.97
8,254.66
4,619.67
4,127.33
0.00
1,817.50
-119,923.50

5.66
5.66
5.91
5.61
5.66
5.91
70.14
44.83
4,480.57
1,898.75
1,729.14
8,108.45
642.38
7,466.08
5,169.67
3,733.04
0.00
1,148.21
-118,775.30
Monthly Projections (Summ
2013
Date
Realized Prices
Marshall Gas ($/Mcf)
Wetzel Gas ($/Mcf)
Clearfield Gas ($/Mcf)
Fayette Gas ($/Mcf)
Butler Gas ($/Mcf)
Dry Gas ($/Mcf)
Oil ($/bbl)
NGL ($/bbl)
Total Gas Revenues
Total Oil Revenues
Total NGL Revenues
Total Revenues
Total Operating Expenses
Operating Cash Flow
Total Capital Expenditures
Apple Operating Cash Flow
Apple Upfront Payment
Apple Net Free Cash Flow
Apple Cumulative Cash Flow (I

Yearly Projections (Summa
Realized Prices
Marshall Gas ($/Mcf)
Wetzel Gas ($/Mcf)
Clearfield Gas ($/Mcf)
Fayette Gas ($/Mcf)
Butler Gas ($/Mcf)
Dry Gas ($/Mcf)
Oil ($/bbl)
NGL ($/bbl)
Total Gas Revenues
Total Oil Revenues
Total NGL Revenues
Total Revenues
Total Operating Expenses
Operating Cash Flow
Total Capital Expenditures
Apple Operating Cash Flow
Apple Upfront Payment

Apr-13
5.27
5.27
5.52
5.24
5.27
5.52
70.22
44.88
3,910.19
1,755.19
1,619.07
7,284.46
606.79
6,677.66
26,529.67
3,338.83
0.00
-9,926.00
-128,701.30

2013
M ay-13
5.26
5.26
5.51
5.23
5.26
5.51
70.31
44.93
5,903.33
2,763.26
2,510.91
11,177.49
821.95
10,355.55
9,559.67
5,177.77
0.00
397.94
-128,303.36

Jun-13

2013
Jul-13

2013

2013
Aug-13

Sep-13

2013
Oct-13

2013
Nov-13

2013
Dec-13

2013

5.29
5.29
5.54
5.26
5.29
5.54
70.40
44.99
6,123.06
2,702.69
2,557.16
11,382.91
839.26
10,543.65
13,049.67
5,271.83
0.00
-1,253.01
-129,556.37

5.33
5.33
5.58
5.30
5.33
5.58
70.49
45.05
6,126.56
2,726.60
2,558.05
11,411.21
845.52
10,565.69
5,829.67
5,282.85
0.00
2,368.01
-127,188.36

5.38
5.38
5.63
5.34
5.38
5.63
70.59
45.11
5,914.21
2,608.39
2,457.32
10,979.92
830.10
10,149.82
14,409.67
5,074.91
0.00
-2,129.92
-129,318.28

5.40
5.40
5.65
5.36
5.40
5.65
70.70
45.17
6,641.42
2,800.64
2,736.76
12,178.83
897.80
11,281.03
8,199.67
5,640.52
0.00
1,540.68
-127,777.60

5.48
5.48
5.73
5.44
5.48
5.73
70.80
45.23
6,399.66
2,686.78
2,605.03
11,691.46
879.77
10,811.69
10,679.67
5,405.85
0.00
66.01
-127,711.59

5.67
5.67
5.92
5.62
5.67
5.92
70.91
45.30
6,750.17
2,766.32
2,679.04
12,195.54
910.20
11,285.33
9,559.67
5,642.67
0.00
862.83
-126,848.75

5.89
5.89
6.14
5.83
5.89
6.14
71.02
45.37
7,408.51
2,794.92
2,804.62
13,008.04
967.07
12,040.97
16,689.67
6,020.49
0.00
-2,324.35
-129,173.10
Monthly Projections (Summ
2014
Date
Realized Prices
Marshall Gas ($/Mcf)
Wetzel Gas ($/Mcf)
Clearfield Gas ($/Mcf)
Fayette Gas ($/Mcf)
Butler Gas ($/Mcf)
Dry Gas ($/Mcf)
Oil ($/bbl)
NGL ($/bbl)
Total Gas Revenues
Total Oil Revenues
Total NGL Revenues
Total Revenues
Total Operating Expenses
Operating Cash Flow
Total Capital Expenditures
Apple Operating Cash Flow
Apple Upfront Payment
Apple Net Free Cash Flow
Apple Cumulative Cash Flow (I

Yearly Projections (Summa
Realized Prices
Marshall Gas ($/Mcf)
Wetzel Gas ($/Mcf)
Clearfield Gas ($/Mcf)
Fayette Gas ($/Mcf)
Butler Gas ($/Mcf)
Dry Gas ($/Mcf)
Oil ($/bbl)
NGL ($/bbl)
Total Gas Revenues
Total Oil Revenues
Total NGL Revenues
Total Revenues
Total Operating Expenses
Operating Cash Flow
Total Capital Expenditures
Apple Operating Cash Flow
Apple Upfront Payment

2014

Jan-14

Feb-14

6.06
6.06
6.31
5.99
6.06
6.31
71.09
45.41
7,639.14
2,864.43
2,836.20
13,339.76
993.73
12,346.03
3,640.00
6,173.02
0.00
4,353.02
-124,820.08

6.00
6.00
6.25
5.94
6.00
6.25
71.16
45.45
6,975.87
2,613.44
2,606.12
12,195.43
945.33
11,250.09
5,460.00
5,625.05
0.00
2,895.05
-121,925.04

2014
M ar-14
5.82
5.82
6.07
5.76
5.82
6.07
71.23
45.50
6,336.33
2,423.83
2,442.13
11,202.28
905.52
10,296.76
4,190.00
5,148.38
0.00
3,053.38
-118,871.66

2014
Apr-14
5.41
5.41
5.66
5.37
5.41
5.66
71.31
45.55
5,580.29
2,272.00
2,313.57
10,165.86
864.26
9,301.60
39,490.00
4,650.80
0.00
-15,094.20
-133,965.86

2014
M ay-14
5.40
5.40
5.65
5.36
5.40
5.65
71.39
45.60
9,661.18
3,338.81
4,168.99
17,168.99
1,211.49
15,957.50
10,400.00
7,978.75
0.00
2,778.75
-131,187.11

Jun-14

2014
Jul-14

2014

2014
Aug-14

Sep-14

2014

5.42
5.42
5.67
5.38
5.42
5.67
71.48
45.65
9,212.98
3,146.64
3,898.52
16,258.14
1,176.25
15,081.88
15,100.00
7,540.94
0.00
-9.06
-131,196.17

5.47
5.47
5.72
5.42
5.47
5.72
71.57
45.71
9,512.94
3,070.39
4,028.57
16,611.90
1,193.34
15,418.56
9,700.00
7,709.28
0.00
2,859.28
-128,336.88

5.51
5.51
5.76
5.46
5.51
5.76
71.67
45.76
9,370.75
2,943.66
3,952.59
16,267.01
1,185.66
15,081.35
15,250.00
7,540.68
0.00
-84.32
-128,421.21

5.53
5.53
5.78
5.48
5.53
5.78
71.77
45.82
9,904.83
2,970.46
4,139.83
17,015.12
1,224.83
15,790.29
10,250.00
7,895.14
0.00
2,770.14
-125,651.06
Monthly Projections (Summ
2014
Date
Realized Prices
Marshall Gas ($/Mcf)
Wetzel Gas ($/Mcf)
Clearfield Gas ($/Mcf)
Fayette Gas ($/Mcf)
Butler Gas ($/Mcf)
Dry Gas ($/Mcf)
Oil ($/bbl)
NGL ($/bbl)
Total Gas Revenues
Total Oil Revenues
Total NGL Revenues
Total Revenues
Total Operating Expenses
Operating Cash Flow
Total Capital Expenditures
Apple Operating Cash Flow
Apple Upfront Payment
Apple Net Free Cash Flow
Apple Cumulative Cash Flow (I

Yearly Projections (Summa
Realized Prices
Marshall Gas ($/Mcf)
Wetzel Gas ($/Mcf)
Clearfield Gas ($/Mcf)
Fayette Gas ($/Mcf)
Butler Gas ($/Mcf)
Dry Gas ($/Mcf)
Oil ($/bbl)
NGL ($/bbl)
Total Gas Revenues
Total Oil Revenues
Total NGL Revenues
Total Revenues
Total Operating Expenses
Operating Cash Flow
Total Capital Expenditures
Apple Operating Cash Flow
Apple Upfront Payment

2014

2014

2015

2015

Oct-14

Nov-14

Dec-14

Jan-15

Feb-15

5.61
5.61
5.86
5.56
5.61
5.86
71.88
45.89
9,880.65
2,875.54
4,086.90
16,843.08
1,225.07
15,618.01
14,550.00
7,809.01
0.00
534.01
-125,117.06

5.81
5.81
6.06
5.75
5.81
6.06
72.00
45.96
10,634.15
2,879.51
4,285.40
17,799.06
1,274.27
16,524.79
10,400.00
8,262.39
0.00
3,062.39
-122,054.67

6.03
6.03
6.28
5.96
6.03
6.28
72.12
46.04
11,015.11
2,846.52
4,236.96
18,098.59
1,307.56
16,791.03
18,740.00
8,395.52
0.00
-974.48
-123,029.15

6.21
6.21
6.46
6.13
6.21
6.46
72.23
46.10
11,758.33
2,860.54
4,437.04
19,055.91
1,355.28
17,700.63
3,640.00
8,850.32
0.00
7,030.32
-115,998.83

6.16
6.16
6.41
6.08
6.16
6.41
72.34
46.17
10,515.89
2,639.98
3,985.19
17,141.06
1,272.53
15,868.54
3,640.00
7,934.27
0.00
6,114.27
-109,884.57

2015
M ar-15
5.98
5.98
6.23
5.91
5.98
6.23
72.45
46.24
9,509.22
2,477.23
3,711.21
15,697.66
1,219.29
14,478.36
6,010.00
7,239.18
0.00
4,234.18
-105,650.38

2015
Apr-15
5.59
5.59
5.84
5.54
5.59
5.84
72.56
46.31
8,405.44
2,346.85
3,508.84
14,261.12
1,157.29
13,103.84
37,670.00
6,551.92
0.00
-12,283.08
-117,933.47

2015
M ay-15
5.57
5.57
5.82
5.52
5.57
5.82
72.67
46.37
13,185.93
2,971.57
5,074.66
21,232.16
1,467.13
19,765.03
13,430.00
9,882.52
0.00
3,167.52
-114,765.95

2015
Jun-15
5.60
5.60
5.85
5.55
5.60
5.85
72.78
46.44
13,052.67
2,898.58
4,712.37
20,663.62
1,445.63
19,217.99
13,890.00
9,608.99
0.00
2,663.99
-112,101.96
Monthly Projections (Summ
2015
Date
Realized Prices
Marshall Gas ($/Mcf)
Wetzel Gas ($/Mcf)
Clearfield Gas ($/Mcf)
Fayette Gas ($/Mcf)
Butler Gas ($/Mcf)
Dry Gas ($/Mcf)
Oil ($/bbl)
NGL ($/bbl)
Total Gas Revenues
Total Oil Revenues
Total NGL Revenues
Total Revenues
Total Operating Expenses
Operating Cash Flow
Total Capital Expenditures
Apple Operating Cash Flow
Apple Upfront Payment
Apple Net Free Cash Flow
Apple Cumulative Cash Flow (I

Yearly Projections (Summa
Realized Prices
Marshall Gas ($/Mcf)
Wetzel Gas ($/Mcf)
Clearfield Gas ($/Mcf)
Fayette Gas ($/Mcf)
Butler Gas ($/Mcf)
Dry Gas ($/Mcf)
Oil ($/bbl)
NGL ($/bbl)
Total Gas Revenues
Total Oil Revenues
Total NGL Revenues
Total Revenues
Total Operating Expenses
Operating Cash Flow
Total Capital Expenditures
Apple Operating Cash Flow
Apple Upfront Payment

2015
Aug-15

2015

Jul-15

Sep-15

2015
Oct-15

2015
Nov-15

2015
Dec-15

2016
Jan-16

2016
Feb-16

2016
M ar-16

2016
Apr-16

5.65
5.65
5.90
5.60
5.65
5.90
72.90
46.51
12,777.75
2,752.15
4,441.62
19,971.53
1,416.25
18,555.28
9,700.00
9,277.64
0.00
4,427.64
-107,674.32

5.70
5.70
5.95
5.65
5.70
5.95
73.02
46.59
12,753.16
2,647.14
4,279.78
19,680.07
1,407.23
18,272.84
16,460.00
9,136.42
0.00
906.42
-106,767.90

5.73
5.73
5.98
5.67
5.73
5.98
73.14
46.66
13,904.88
2,765.47
4,528.91
21,199.26
1,477.07
19,722.18
12,070.00
9,861.09
0.00
3,826.09
-102,941.81

5.81
5.81
6.06
5.75
5.81
6.06
73.26
46.74
13,828.68
2,656.35
4,341.63
20,826.66
1,465.65
19,361.01
9,700.00
9,680.50
0.00
4,830.50
-98,111.30

6.01
6.01
6.26
5.94
6.01
6.26
73.39
46.81
14,207.29
2,573.23
4,230.86
21,011.38
1,479.49
19,531.90
13,430.00
9,765.95
0.00
3,050.95
-95,060.35

6.23
6.23
6.48
6.15
6.23
6.48
73.52
46.89
15,439.29
2,632.02
4,309.80
22,381.11
1,558.15
20,822.97
17,530.00
10,411.48
0.00
1,646.48
-93,413.87

6.23
6.23
6.48
6.15
6.23
6.48
73.52
46.89
15,303.56
2,549.58
4,203.49
22,056.63
1,556.15
20,500.48
8,280.00
10,250.24
0.00
6,110.24
-87,303.63

6.23
6.23
6.48
6.15
6.23
6.48
73.52
46.89
14,169.74
2,402.50
3,971.75
20,543.99
1,504.54
19,039.45
6,460.00
9,519.73
0.00
6,289.73
-81,013.90

6.23
6.23
6.48
6.15
6.23
6.48
73.52
46.89
13,358.05
2,283.79
3,796.61
19,438.45
1,478.13
17,960.32
8,830.00
8,980.16
0.00
4,565.16
-76,448.74

6.23
6.23
6.48
6.15
6.23
6.48
73.52
46.89
12,716.33
2,183.43
3,652.85
18,552.61
1,450.68
17,101.93
50,610.00
8,550.96
0.00
-16,754.04
-93,202.78
Monthly Projections (Summ
Date
Realized Prices
Marshall Gas ($/Mcf)
Wetzel Gas ($/Mcf)
Clearfield Gas ($/Mcf)
Fayette Gas ($/Mcf)
Butler Gas ($/Mcf)
Dry Gas ($/Mcf)
Oil ($/bbl)
NGL ($/bbl)
Total Gas Revenues
Total Oil Revenues
Total NGL Revenues
Total Revenues
Total Operating Expenses
Operating Cash Flow
Total Capital Expenditures
Apple Operating Cash Flow
Apple Upfront Payment
Apple Net Free Cash Flow
Apple Cumulative Cash Flow (I

Yearly Projections (Summa
Realized Prices
Marshall Gas ($/Mcf)
Wetzel Gas ($/Mcf)
Clearfield Gas ($/Mcf)
Fayette Gas ($/Mcf)
Butler Gas ($/Mcf)
Dry Gas ($/Mcf)
Oil ($/bbl)
NGL ($/bbl)
Total Gas Revenues
Total Oil Revenues
Total NGL Revenues
Total Revenues
Total Operating Expenses
Operating Cash Flow
Total Capital Expenditures
Apple Operating Cash Flow
Apple Upfront Payment

2016
M ay-16

2016
Jun-16

2016
Jul-16

2016
Aug-16

2016
Sep-16

2016
Oct-16

2016
Nov-16

2016
Dec-16

2017
Jan-17

2017
Feb-17

6.23
6.23
6.48
6.15
6.23
6.48
73.52
46.89
20,456.17
2,539.94
4,364.73
27,360.84
1,856.60
25,504.24
20,100.00
12,752.12
0.00
2,702.12
-90,500.66

6.23
6.23
6.48
6.15
6.23
6.48
73.52
46.89
20,218.55
2,410.19
4,031.04
26,659.77
1,854.60
24,805.18
16,920.00
12,402.59
0.00
3,942.59
-86,558.07

6.23
6.23
6.48
6.15
6.23
6.48
73.52
46.89
19,837.33
2,276.65
3,825.17
25,939.14
1,843.64
24,095.50
19,400.00
12,047.75
0.00
2,347.75
-84,210.32

6.23
6.23
6.48
6.15
6.23
6.48
73.52
46.89
20,262.52
2,170.21
3,670.26
26,102.99
1,871.89
24,231.10
18,280.00
12,115.55
0.00
2,975.55
-81,234.77

6.23
6.23
6.48
6.15
6.23
6.48
73.52
46.89
20,854.91
2,124.38
3,543.66
26,522.94
1,914.34
24,608.60
19,950.00
12,304.30
0.00
2,329.30
-78,905.47

6.23
6.23
6.48
6.15
6.23
6.48
73.52
46.89
21,254.15
2,042.91
3,435.45
26,732.51
1,940.91
24,791.60
14,550.00
12,395.80
0.00
5,120.80
-73,784.67

6.23
6.23
6.48
6.15
6.23
6.48
73.52
46.89
21,144.53
1,970.54
3,340.41
26,455.48
1,947.66
24,507.83
20,100.00
12,253.91
0.00
2,203.91
-71,580.76

6.23
6.23
6.48
6.15
6.23
6.48
73.52
46.89
21,827.96
1,950.50
3,255.33
27,033.80
2,014.24
25,019.56
24,700.00
12,509.78
0.00
159.78
-71,420.98

6.23
6.23
6.48
6.15
6.23
6.48
73.52
46.89
21,763.71
1,887.83
3,178.20
26,829.74
2,019.92
24,809.81
7,280.00
12,404.91
0.00
8,764.91
-62,656.07

6.23
6.23
6.48
6.15
6.23
6.48
73.52
46.89
20,182.60
1,831.91
3,107.52
25,122.04
1,953.41
23,168.63
7,280.00
11,584.31
0.00
7,944.31
-54,711.75
Monthly Projections (Summ
Date
Realized Prices
Marshall Gas ($/Mcf)
Wetzel Gas ($/Mcf)
Clearfield Gas ($/Mcf)
Fayette Gas ($/Mcf)
Butler Gas ($/Mcf)
Dry Gas ($/Mcf)
Oil ($/bbl)
NGL ($/bbl)
Total Gas Revenues
Total Oil Revenues
Total NGL Revenues
Total Revenues
Total Operating Expenses
Operating Cash Flow
Total Capital Expenditures
Apple Operating Cash Flow
Apple Upfront Payment
Apple Net Free Cash Flow
Apple Cumulative Cash Flow (I

Yearly Projections (Summa
Realized Prices
Marshall Gas ($/Mcf)
Wetzel Gas ($/Mcf)
Clearfield Gas ($/Mcf)
Fayette Gas ($/Mcf)
Butler Gas ($/Mcf)
Dry Gas ($/Mcf)
Oil ($/bbl)
NGL ($/bbl)
Total Gas Revenues
Total Oil Revenues
Total NGL Revenues
Total Revenues
Total Operating Expenses
Operating Cash Flow
Total Capital Expenditures
Apple Operating Cash Flow
Apple Upfront Payment

2017
M ar-17

2017
Apr-17

2017
M ay-17

2017
Jun-17

2017
Jul-17

2017
Aug-17

2017
Sep-17

2017
Oct-17

2017
Nov-17

2017
Dec-17

6.23
6.23
6.48
6.15
6.23
6.48
73.52
46.89
19,046.08
1,780.62
3,042.28
23,868.97
1,914.19
21,954.78
7,830.00
10,977.39
0.00
7,062.39
-47,649.36

6.23
6.23
6.48
6.15
6.23
6.48
73.52
46.89
18,146.12
1,732.64
2,981.65
22,860.41
1,880.32
20,980.10
66,080.00
10,490.05
0.00
-22,549.95
-70,199.32

6.23
6.23
6.48
6.15
6.23
6.48
73.52
46.89
28,200.65
1,733.62
2,925.01
32,859.28
2,393.28
30,466.00
20,100.00
15,233.00
0.00
5,183.00
-65,016.32

6.23
6.23
6.48
6.15
6.23
6.48
73.52
46.89
27,140.10
1,732.27
2,871.88
31,744.24
2,354.79
29,389.46
19,950.00
14,694.73
0.00
4,719.73
-60,296.59

6.23
6.23
6.48
6.15
6.23
6.48
73.52
46.89
26,749.44
1,686.06
2,821.85
31,257.36
2,346.71
28,910.65
19,400.00
14,455.33
0.00
4,755.33
-55,541.26

6.23
6.23
6.48
6.15
6.23
6.48
73.52
46.89
26,653.23
1,643.82
2,774.57
31,071.62
2,355.33
28,716.29
20,100.00
14,358.15
0.00
4,308.15
-51,233.12

6.23
6.23
6.48
6.15
6.23
6.48
73.52
46.89
26,844.33
1,648.69
2,729.80
31,222.82
2,380.23
28,842.59
19,950.00
14,421.30
0.00
4,446.30
-46,786.82

6.23
6.23
6.48
6.15
6.23
6.48
73.52
46.89
26,945.44
1,608.11
2,687.25
31,240.80
2,397.53
28,843.27
19,400.00
14,421.64
0.00
4,721.64
-42,065.18

6.23
6.23
6.48
6.15
6.23
6.48
73.52
46.89
27,093.65
1,570.48
2,646.77
31,310.90
2,419.14
28,891.76
20,100.00
14,445.88
0.00
4,395.88
-37,669.30

6.23
6.23
6.48
6.15
6.23
6.48
73.52
46.89
27,421.47
1,579.12
2,608.11
31,608.70
2,450.60
29,158.10
19,950.00
14,579.05
0.00
4,604.05
-33,065.25
Monthly Projections (Summ
Date
Realized Prices
Marshall Gas ($/Mcf)
Wetzel Gas ($/Mcf)
Clearfield Gas ($/Mcf)
Fayette Gas ($/Mcf)
Butler Gas ($/Mcf)
Dry Gas ($/Mcf)
Oil ($/bbl)
NGL ($/bbl)
Total Gas Revenues
Total Oil Revenues
Total NGL Revenues
Total Revenues
Total Operating Expenses
Operating Cash Flow
Total Capital Expenditures
Apple Operating Cash Flow
Apple Upfront Payment
Apple Net Free Cash Flow
Apple Cumulative Cash Flow (I

Yearly Projections (Summa
Realized Prices
Marshall Gas ($/Mcf)
Wetzel Gas ($/Mcf)
Clearfield Gas ($/Mcf)
Fayette Gas ($/Mcf)
Butler Gas ($/Mcf)
Dry Gas ($/Mcf)
Oil ($/bbl)
NGL ($/bbl)
Total Gas Revenues
Total Oil Revenues
Total NGL Revenues
Total Revenues
Total Operating Expenses
Operating Cash Flow
Total Capital Expenditures
Apple Operating Cash Flow
Apple Upfront Payment

2018
Jan-18

2018
Feb-18

2018
M ar-18

2018
Apr-18

2018
M ay-18

2018
Jun-18

2018
Jul-18

2018
Aug-18

2018
Sep-18

2018
Oct-18

2018
Nov-18

6.23
6.23
6.48
6.15
6.23
6.48
73.52
46.89
27,604.80
1,542.61
2,571.21
31,718.63
2,459.78
29,258.85
3,640.00
14,629.42
0.00
12,809.42
-20,255.83

6.23
6.23
6.48
6.15
6.23
6.48
73.52
46.89
25,667.03
1,508.39
2,535.86
29,711.28
2,366.83
27,344.44
3,640.00
13,672.22
0.00
11,852.22
-8,403.60

6.23
6.23
6.48
6.15
6.23
6.48
73.52
46.89
24,301.70
1,476.89
2,501.97
28,280.57
2,312.00
25,968.56
6,010.00
12,984.28
0.00
9,979.28
1,575.68

6.23
6.23
6.48
6.15
6.23
6.48
73.52
46.89
23,224.61
1,446.62
2,469.41
27,140.65
2,261.00
24,879.65
40,700.00
12,439.82
0.00
-7,910.18
-6,334.50

6.23
6.23
6.48
6.15
6.23
6.48
73.52
46.89
28,889.94
1,462.86
2,438.14
32,790.93
2,553.34
30,237.60
13,430.00
15,118.80
0.00
8,403.80
2,069.30

6.23
6.23
6.48
6.15
6.23
6.48
73.52
46.89
28,174.76
1,475.91
2,408.02
32,058.69
2,534.01
29,524.68
13,890.00
14,762.34
0.00
7,817.34
9,886.64

6.23
6.23
6.48
6.15
6.23
6.48
73.52
46.89
27,279.33
1,442.82
2,379.02
31,101.17
2,494.52
28,606.66
9,700.00
14,303.33
0.00
9,453.33
19,339.97

6.23
6.23
6.48
6.15
6.23
6.48
73.52
46.89
26,707.56
1,412.66
2,351.00
30,471.22
2,472.01
27,999.21
16,460.00
13,999.60
0.00
5,769.60
25,109.57

6.23
6.23
6.48
6.15
6.23
6.48
73.52
46.89
27,514.11
1,428.51
2,323.99
31,266.61
2,528.48
28,738.13
12,070.00
14,369.06
0.00
8,334.06
33,443.64

6.23
6.23
6.48
6.15
6.23
6.48
73.52
46.89
26,903.00
1,397.99
2,297.85
30,598.83
2,501.97
28,096.87
9,700.00
14,048.43
0.00
9,198.43
42,642.07

6.23
6.23
6.48
6.15
6.23
6.48
73.52
46.89
26,499.65
1,369.81
2,272.59
30,142.05
2,487.65
27,654.41
13,430.00
13,827.20
0.00
7,112.20
49,754.28
Monthly Projections (Summ
Date
Realized Prices
Marshall Gas ($/Mcf)
Wetzel Gas ($/Mcf)
Clearfield Gas ($/Mcf)
Fayette Gas ($/Mcf)
Butler Gas ($/Mcf)
Dry Gas ($/Mcf)
Oil ($/bbl)
NGL ($/bbl)
Total Gas Revenues
Total Oil Revenues
Total NGL Revenues
Total Revenues
Total Operating Expenses
Operating Cash Flow
Total Capital Expenditures
Apple Operating Cash Flow
Apple Upfront Payment
Apple Net Free Cash Flow
Apple Cumulative Cash Flow (I

Yearly Projections (Summa
Realized Prices
Marshall Gas ($/Mcf)
Wetzel Gas ($/Mcf)
Clearfield Gas ($/Mcf)
Fayette Gas ($/Mcf)
Butler Gas ($/Mcf)
Dry Gas ($/Mcf)
Oil ($/bbl)
NGL ($/bbl)
Total Gas Revenues
Total Oil Revenues
Total NGL Revenues
Total Revenues
Total Operating Expenses
Operating Cash Flow
Total Capital Expenditures
Apple Operating Cash Flow
Apple Upfront Payment

2018
Dec-18

2019
Jan-19

2019
Feb-19

2019
M ar-19

2019
Apr-19

2019
M ay-19

2019
Jun-19

2019
Jul-19

2019
Aug-19

2019
Sep-19

6.23
6.23
6.48
6.15
6.23
6.48
73.52
46.89
26,881.64
1,387.11
2,248.12
30,516.87
2,522.51
27,994.37
13,890.00
13,997.18
0.00
7,052.18
56,806.46

6.23
6.23
6.48
6.15
6.23
6.48
73.52
46.89
26,487.95
1,358.65
2,224.41
30,071.00
2,496.55
27,574.46
0.00
13,787.23
0.00
13,787.23
70,593.69

6.23
6.23
6.48
6.15
6.23
6.48
73.52
46.89
25,143.20
1,331.86
2,201.43
28,676.50
2,423.00
26,253.50
0.00
13,126.75
0.00
13,126.75
83,720.44

6.23
6.23
6.48
6.15
6.23
6.48
73.52
46.89
24,140.68
1,307.31
2,179.11
27,627.10
2,372.07
25,255.03
550.00
12,627.52
0.00
12,352.52
96,072.95

6.23
6.23
6.48
6.15
6.23
6.48
73.52
46.89
23,319.38
1,283.93
2,157.44
26,760.75
2,324.57
24,436.17
18,880.00
12,218.09
0.00
2,778.09
98,851.04

6.23
6.23
6.48
6.15
6.23
6.48
73.52
46.89
22,765.59
1,305.83
2,136.39
26,207.82
2,289.13
23,918.68
700.00
11,959.34
0.00
11,609.34
110,460.38

6.23
6.23
6.48
6.15
6.23
6.48
73.52
46.89
22,281.87
1,324.86
2,115.94
25,722.66
2,262.19
23,460.48
550.00
11,730.24
0.00
11,455.24
121,915.62

6.23
6.23
6.48
6.15
6.23
6.48
73.52
46.89
21,701.16
1,297.57
2,096.05
25,094.78
2,227.34
22,867.44
0.00
11,433.72
0.00
11,433.72
133,349.34

6.23
6.23
6.48
6.15
6.23
6.48
73.52
46.89
21,176.73
1,272.47
2,076.66
24,525.86
2,197.32
22,328.54
700.00
11,164.27
0.00
10,814.27
144,163.61

6.23
6.23
6.48
6.15
6.23
6.48
73.52
46.89
20,848.05
1,293.19
2,057.81
24,199.06
2,178.48
22,020.58
550.00
11,010.29
0.00
10,735.29
154,898.90
Monthly Projections (Summ
Date
Realized Prices
Marshall Gas ($/Mcf)
Wetzel Gas ($/Mcf)
Clearfield Gas ($/Mcf)
Fayette Gas ($/Mcf)
Butler Gas ($/Mcf)
Dry Gas ($/Mcf)
Oil ($/bbl)
NGL ($/bbl)
Total Gas Revenues
Total Oil Revenues
Total NGL Revenues
Total Revenues
Total Operating Expenses
Operating Cash Flow
Total Capital Expenditures
Apple Operating Cash Flow
Apple Upfront Payment
Apple Net Free Cash Flow
Apple Cumulative Cash Flow (I

Yearly Projections (Summa
Realized Prices
Marshall Gas ($/Mcf)
Wetzel Gas ($/Mcf)
Clearfield Gas ($/Mcf)
Fayette Gas ($/Mcf)
Butler Gas ($/Mcf)
Dry Gas ($/Mcf)
Oil ($/bbl)
NGL ($/bbl)
Total Gas Revenues
Total Oil Revenues
Total NGL Revenues
Total Revenues
Total Operating Expenses
Operating Cash Flow
Total Capital Expenditures
Apple Operating Cash Flow
Apple Upfront Payment

2019
Oct-19

2019
Nov-19

2019
Dec-19

2020
Jan-20

2020
Feb-20

2020
M ar-20

2020
Apr-20

2020
M ay-20

2020
Jun-20

6.23
6.23
6.48
6.15
6.23
6.48
73.52
46.89
20,393.13
1,267.31
2,039.44
23,699.88
2,150.75
21,549.13
0.00
10,774.57
0.00
10,774.57
165,673.46

6.23
6.23
6.48
6.15
6.23
6.48
73.52
46.89
19,973.35
1,243.53
2,021.52
23,238.40
2,126.22
21,112.19
700.00
10,556.09
0.00
10,206.09
175,879.56

6.23
6.23
6.48
6.15
6.23
6.48
73.52
46.89
19,733.33
1,264.98
2,004.07
23,002.38
2,111.99
20,890.39
550.00
10,445.20
0.00
7,543.37
183,422.93

6.23
6.23
6.48
6.15
6.23
6.48
73.52
46.89
19,354.72
1,240.12
1,987.02
22,581.86
2,087.75
20,494.11
0.00
10,247.05
0.00
7,242.02
190,664.95

6.23
6.23
6.48
6.15
6.23
6.48
73.52
46.89
19,001.62
1,217.49
1,970.41
22,189.51
2,068.75
20,120.76
0.00
10,060.38
0.00
7,114.69
197,779.65

6.23
6.23
6.48
6.15
6.23
6.48
73.52
46.89
18,670.49
1,196.42
1,954.17
21,821.08
2,055.29
19,765.79
550.00
9,882.89
0.00
6,789.71
204,569.35

6.23
6.23
6.48
6.15
6.23
6.48
73.52
46.89
18,358.75
1,176.09
1,938.30
21,473.14
2,036.69
19,436.45
700.00
9,718.22
0.00
6,582.11
211,151.46

6.23
6.23
6.48
6.15
6.23
6.48
73.52
46.89
18,213.93
1,201.12
1,922.78
21,337.83
2,024.84
19,312.99
700.00
9,656.50
0.00
6,525.78
217,677.24

6.23
6.23
6.48
6.15
6.23
6.48
73.52
46.89
18,070.02
1,223.51
1,907.64
21,201.17
2,017.87
19,183.31
550.00
9,591.65
0.00
6,521.30
224,198.54
Monthly Projections (Summ
Date
Realized Prices
Marshall Gas ($/Mcf)
Wetzel Gas ($/Mcf)
Clearfield Gas ($/Mcf)
Fayette Gas ($/Mcf)
Butler Gas ($/Mcf)
Dry Gas ($/Mcf)
Oil ($/bbl)
NGL ($/bbl)
Total Gas Revenues
Total Oil Revenues
Total NGL Revenues
Total Revenues
Total Operating Expenses
Operating Cash Flow
Total Capital Expenditures
Apple Operating Cash Flow
Apple Upfront Payment
Apple Net Free Cash Flow
Apple Cumulative Cash Flow (I

Yearly Projections (Summa
Realized Prices
Marshall Gas ($/Mcf)
Wetzel Gas ($/Mcf)
Clearfield Gas ($/Mcf)
Fayette Gas ($/Mcf)
Butler Gas ($/Mcf)
Dry Gas ($/Mcf)
Oil ($/bbl)
NGL ($/bbl)
Total Gas Revenues
Total Oil Revenues
Total NGL Revenues
Total Revenues
Total Operating Expenses
Operating Cash Flow
Total Capital Expenditures
Apple Operating Cash Flow
Apple Upfront Payment

2020
Jul-20

2020
Aug-20

2020
Sep-20

2020
Oct-20

2020
Nov-20

2020
Dec-20

2021
Jan-21

2021
Feb-21

2021
M ar-21

6.23
6.23
6.48
6.15
6.23
6.48
73.52
46.89
17,778.23
1,198.79
1,892.83
20,869.85
2,000.30
18,869.55
0.00
9,434.78
0.00
6,607.82
230,806.36

6.23
6.23
6.48
6.15
6.23
6.48
73.52
46.89
17,503.78
1,176.76
1,878.32
20,558.86
1,985.51
18,573.35
700.00
9,286.67
0.00
6,234.01
237,040.38

6.23
6.23
6.48
6.15
6.23
6.48
73.52
46.89
17,394.30
1,199.75
1,864.15
20,458.20
1,980.26
18,477.95
550.00
9,238.97
0.00
6,242.96
243,283.34

6.23
6.23
6.48
6.15
6.23
6.48
73.52
46.89
17,133.57
1,176.69
1,850.26
20,160.52
1,964.83
18,195.69
0.00
9,097.85
0.00
6,338.73
249,622.06

6.23
6.23
6.48
6.15
6.23
6.48
73.52
46.89
16,887.42
1,154.57
1,836.66
19,878.65
1,951.44
17,927.21
700.00
8,963.61
0.00
5,977.02
255,599.09

6.23
6.23
6.48
6.15
6.23
6.48
73.52
46.89
16,803.80
1,178.91
1,823.33
19,806.04
1,947.56
17,858.48
550.00
8,929.24
0.00
5,990.88
261,589.97

6.23
6.23
6.48
6.15
6.23
6.48
73.52
46.89
16,566.96
1,156.45
1,810.27
19,533.67
1,932.86
17,600.81
0.00
8,800.40
0.00
6,106.21
267,696.18

6.23
6.23
6.48
6.15
6.23
6.48
73.52
46.89
16,343.07
1,135.48
1,797.49
19,276.04
1,921.71
17,354.33
0.00
8,677.16
0.00
6,022.75
273,718.93

6.23
6.23
6.48
6.15
6.23
6.48
73.52
46.89
16,130.24
1,116.38
1,784.95
19,031.57
1,911.03
17,120.54
550.00
8,560.27
0.00
5,739.34
279,458.27
Monthly Projections (Summ
Date
Realized Prices
Marshall Gas ($/Mcf)
Wetzel Gas ($/Mcf)
Clearfield Gas ($/Mcf)
Fayette Gas ($/Mcf)
Butler Gas ($/Mcf)
Dry Gas ($/Mcf)
Oil ($/bbl)
NGL ($/bbl)
Total Gas Revenues
Total Oil Revenues
Total NGL Revenues
Total Revenues
Total Operating Expenses
Operating Cash Flow
Total Capital Expenditures
Apple Operating Cash Flow
Apple Upfront Payment
Apple Net Free Cash Flow
Apple Cumulative Cash Flow (I

Yearly Projections (Summa
Realized Prices
Marshall Gas ($/Mcf)
Wetzel Gas ($/Mcf)
Clearfield Gas ($/Mcf)
Fayette Gas ($/Mcf)
Butler Gas ($/Mcf)
Dry Gas ($/Mcf)
Oil ($/bbl)
NGL ($/bbl)
Total Gas Revenues
Total Oil Revenues
Total NGL Revenues
Total Revenues
Total Operating Expenses
Operating Cash Flow
Total Capital Expenditures
Apple Operating Cash Flow
Apple Upfront Payment

2021
Apr-21

2021
M ay-21

2021
Jun-21

2021
Jul-21

2021
Aug-21

2021
Sep-21

2021
Oct-21

2021
Nov-21

2021
Dec-21

6.23
6.23
6.48
6.15
6.23
6.48
73.52
46.89
15,927.22
1,098.34
1,772.61
18,798.17
1,899.74
16,898.43
700.00
8,449.21
0.00
5,573.74
285,032.01

6.23
6.23
6.48
6.15
6.23
6.48
73.52
46.89
15,733.03
1,080.73
1,760.52
18,574.28
1,889.79
16,684.49
700.00
8,342.24
0.00
5,493.73
290,525.74

6.23
6.23
6.48
6.15
6.23
6.48
73.52
46.89
15,546.98
1,064.99
1,748.69
18,360.66
1,880.30
16,480.36
550.00
8,240.18
0.00
5,472.55
295,998.29

6.23
6.23
6.48
6.15
6.23
6.48
73.52
46.89
15,368.07
1,049.78
1,737.05
18,154.90
1,870.12
16,284.78
0.00
8,142.39
0.00
5,602.82
301,601.11

6.23
6.23
6.48
6.15
6.23
6.48
73.52
46.89
15,195.92
1,035.73
1,725.60
17,957.25
1,861.27
16,095.98
700.00
8,047.99
0.00
5,271.76
306,872.87

6.23
6.23
6.48
6.15
6.23
6.48
73.52
46.89
15,030.02
1,021.55
1,714.38
17,765.96
1,852.65
15,913.31
550.00
7,956.65
0.00
5,257.84
312,130.71

6.23
6.23
6.48
6.15
6.23
6.48
73.52
46.89
14,869.80
1,008.64
1,703.35
17,581.79
1,843.37
15,738.42
0.00
7,869.21
0.00
5,395.86
317,526.57

6.23
6.23
6.48
6.15
6.23
6.48
73.52
46.89
14,714.89
995.60
1,692.50
17,402.98
1,835.26
15,567.73
700.00
7,783.86
0.00
5,071.81
322,598.38

6.23
6.23
6.48
6.15
6.23
6.48
73.52
46.89
14,564.97
983.92
1,681.82
17,230.70
1,827.45
15,403.25
550.00
7,701.63
0.00
5,061.17
327,659.55
Monthly Projections (Summ
Date
Realized Prices
Marshall Gas ($/Mcf)
Wetzel Gas ($/Mcf)
Clearfield Gas ($/Mcf)
Fayette Gas ($/Mcf)
Butler Gas ($/Mcf)
Dry Gas ($/Mcf)
Oil ($/bbl)
NGL ($/bbl)
Total Gas Revenues
Total Oil Revenues
Total NGL Revenues
Total Revenues
Total Operating Expenses
Operating Cash Flow
Total Capital Expenditures
Apple Operating Cash Flow
Apple Upfront Payment
Apple Net Free Cash Flow
Apple Cumulative Cash Flow (I

Yearly Projections (Summa
Realized Prices
Marshall Gas ($/Mcf)
Wetzel Gas ($/Mcf)
Clearfield Gas ($/Mcf)
Fayette Gas ($/Mcf)
Butler Gas ($/Mcf)
Dry Gas ($/Mcf)
Oil ($/bbl)
NGL ($/bbl)
Total Gas Revenues
Total Oil Revenues
Total NGL Revenues
Total Revenues
Total Operating Expenses
Operating Cash Flow
Total Capital Expenditures
Apple Operating Cash Flow
Apple Upfront Payment

2022
Jan-22

2022
Feb-22

2022
M ar-22

2022
Apr-22

2022
M ay-22

2022
Jun-22

2022
Jul-22

2022
Aug-22

2022
Sep-22

6.23
6.23
6.48
6.15
6.23
6.48
73.52
46.89
14,419.80
972.20
1,671.32
17,063.32
1,818.86
15,244.45
0.00
7,622.23
0.00
5,208.97
332,868.51

6.23
6.23
6.48
6.15
6.23
6.48
73.52
46.89
14,279.12
961.17
1,661.02
16,901.30
1,811.50
15,089.80
0.00
7,544.90
0.00
5,155.69
338,024.20

6.23
6.23
6.48
6.15
6.23
6.48
73.52
46.89
14,142.45
949.92
1,650.84
16,743.20
1,804.27
14,938.93
550.00
7,469.46
0.00
4,900.45
342,924.65

6.23
6.23
6.48
6.15
6.23
6.48
73.52
46.89
14,009.68
939.41
1,640.81
16,589.91
1,796.80
14,793.11
700.00
7,396.55
0.00
4,768.37
347,693.01

6.23
6.23
6.48
6.15
6.23
6.48
73.52
46.89
13,880.68
928.41
1,630.95
16,440.03
1,789.91
14,650.12
700.00
7,325.06
0.00
4,713.63
352,406.65

6.23
6.23
6.48
6.15
6.23
6.48
73.52
46.89
13,755.25
918.47
1,621.26
16,294.98
1,783.27
14,511.71
550.00
7,255.85
0.00
4,716.35
357,123.00

6.23
6.23
6.48
6.15
6.23
6.48
73.52
46.89
13,633.02
908.30
1,611.67
16,152.99
1,776.22
14,376.77
0.00
7,188.39
0.00
4,867.05
361,990.05

6.23
6.23
6.48
6.15
6.23
6.48
73.52
46.89
13,514.05
899.05
1,602.22
16,015.32
1,769.92
14,245.40
700.00
7,122.70
0.00
4,558.37
366,548.42

6.23
6.23
6.48
6.15
6.23
6.48
73.52
46.89
13,398.02
889.06
1,592.92
15,879.99
1,763.66
14,116.33
550.00
7,058.17
0.00
4,563.48
371,111.90
Monthly Projections (Summ
Date
Realized Prices
Marshall Gas ($/Mcf)
Wetzel Gas ($/Mcf)
Clearfield Gas ($/Mcf)
Fayette Gas ($/Mcf)
Butler Gas ($/Mcf)
Dry Gas ($/Mcf)
Oil ($/bbl)
NGL ($/bbl)
Total Gas Revenues
Total Oil Revenues
Total NGL Revenues
Total Revenues
Total Operating Expenses
Operating Cash Flow
Total Capital Expenditures
Apple Operating Cash Flow
Apple Upfront Payment
Apple Net Free Cash Flow
Apple Cumulative Cash Flow (I

Yearly Projections (Summa
Realized Prices
Marshall Gas ($/Mcf)
Wetzel Gas ($/Mcf)
Clearfield Gas ($/Mcf)
Fayette Gas ($/Mcf)
Butler Gas ($/Mcf)
Dry Gas ($/Mcf)
Oil ($/bbl)
NGL ($/bbl)
Total Gas Revenues
Total Oil Revenues
Total NGL Revenues
Total Revenues
Total Operating Expenses
Operating Cash Flow
Total Capital Expenditures
Apple Operating Cash Flow
Apple Upfront Payment

2022
Oct-22

2022
Nov-22

2022
Dec-22

2023
Jan-23

2023
Feb-23

2023
M ar-23

2023
Apr-23

2023
M ay-23

2023
Jun-23

6.23
6.23
6.48
6.15
6.23
6.48
73.52
46.89
13,284.99
880.32
1,583.75
15,749.06
1,757.16
13,991.90
0.00
6,995.95
0.00
4,718.64
375,830.54

6.23
6.23
6.48
6.15
6.23
6.48
73.52
46.89
13,174.48
870.93
1,574.67
15,620.09
1,751.16
13,868.92
700.00
6,934.46
0.00
4,412.30
380,242.84

6.23
6.23
6.48
6.15
6.23
6.48
73.52
46.89
13,066.75
862.72
1,565.75
15,495.22
1,745.43
13,749.79
550.00
6,874.89
0.00
4,419.65
384,662.50

6.23
6.23
6.48
6.15
6.23
6.48
73.52
46.89
12,961.51
853.84
1,556.92
15,372.28
1,739.25
13,633.03
0.00
6,816.52
0.00
4,582.12
389,244.62

6.23
6.23
6.48
6.15
6.23
6.48
73.52
46.89
12,858.74
845.89
1,548.22
15,252.85
1,733.73
13,519.12
0.00
6,759.56
0.00
4,542.70
393,787.32

6.23
6.23
6.48
6.15
6.23
6.48
73.52
46.89
12,758.11
837.55
1,539.60
15,135.26
1,728.28
13,406.98
550.00
6,703.49
0.00
4,300.67
398,087.99

6.23
6.23
6.48
6.15
6.23
6.48
73.52
46.89
12,659.72
829.38
1,531.11
15,020.21
1,722.95
13,297.26
700.00
6,648.63
0.00
4,187.46
402,275.45

6.23
6.23
6.48
6.15
6.23
6.48
73.52
46.89
12,563.46
821.50
1,522.71
14,907.66
1,717.72
13,189.94
700.00
6,594.97
0.00
4,145.74
406,421.19

6.23
6.23
6.48
6.15
6.23
6.48
73.52
46.89
12,469.33
813.28
1,514.43
14,797.04
1,712.57
13,084.47
550.00
6,542.23
0.00
4,159.81
410,581.00
Monthly Projections (Summ
Date
Realized Prices
Marshall Gas ($/Mcf)
Wetzel Gas ($/Mcf)
Clearfield Gas ($/Mcf)
Fayette Gas ($/Mcf)
Butler Gas ($/Mcf)
Dry Gas ($/Mcf)
Oil ($/bbl)
NGL ($/bbl)
Total Gas Revenues
Total Oil Revenues
Total NGL Revenues
Total Revenues
Total Operating Expenses
Operating Cash Flow
Total Capital Expenditures
Apple Operating Cash Flow
Apple Upfront Payment
Apple Net Free Cash Flow
Apple Cumulative Cash Flow (I

Yearly Projections (Summa
Realized Prices
Marshall Gas ($/Mcf)
Wetzel Gas ($/Mcf)
Clearfield Gas ($/Mcf)
Fayette Gas ($/Mcf)
Butler Gas ($/Mcf)
Dry Gas ($/Mcf)
Oil ($/bbl)
NGL ($/bbl)
Total Gas Revenues
Total Oil Revenues
Total NGL Revenues
Total Revenues
Total Operating Expenses
Operating Cash Flow
Total Capital Expenditures
Apple Operating Cash Flow
Apple Upfront Payment

2023
Jul-23

2023
Aug-23

2023
Sep-23

2023
Oct-23

2023
Nov-23

2023
Dec-23

2024
Jan-24

2024
Feb-24

2024
M ar-24

6.23
6.23
6.48
6.15
6.23
6.48
73.52
46.89
12,376.97
805.77
1,506.19
14,688.92
1,707.54
12,981.38
0.00
6,490.69
0.00
4,322.91
414,903.91

6.23
6.23
6.48
6.15
6.23
6.48
73.52
46.89
12,286.65
798.21
1,498.08
14,582.95
1,702.63
12,880.31
700.00
6,440.16
0.00
4,024.47
418,928.38

6.23
6.23
6.48
6.15
6.23
6.48
73.52
46.89
12,198.00
790.44
1,490.06
14,478.50
1,697.73
12,780.77
550.00
6,390.38
0.00
4,040.85
422,969.22

6.23
6.23
6.48
6.15
6.23
6.48
73.52
46.89
12,111.20
783.53
1,482.13
14,376.87
1,693.03
12,683.84
0.00
6,341.92
0.00
4,205.95
427,175.17

6.23
6.23
6.48
6.15
6.23
6.48
73.52
46.89
12,025.93
775.72
1,474.26
14,275.91
1,688.28
12,587.62
700.00
6,293.81
0.00
3,909.73
431,084.90

6.23
6.23
6.48
6.15
6.23
6.48
73.52
46.89
11,942.43
769.14
1,466.51
14,178.08
1,683.75
12,494.33
550.00
6,247.16
0.00
3,927.76
435,012.66

6.23
6.23
6.48
6.15
6.23
6.48
73.52
46.89
11,860.52
762.45
1,458.83
14,081.80
1,679.29
12,402.51
0.00
6,201.26
0.00
4,099.88
439,112.54

6.23
6.23
6.48
6.15
6.23
6.48
73.52
46.89
11,780.07
755.21
1,451.22
13,986.50
1,674.81
12,311.69
0.00
6,155.84
0.00
4,069.51
443,182.05

6.23
6.23
6.48
6.15
6.23
6.48
73.52
46.89
11,701.01
748.88
1,443.68
13,893.58
1,670.48
12,223.09
550.00
6,111.55
0.00
3,836.67
447,018.73
Monthly Projections (Summ
Date
Realized Prices
Marshall Gas ($/Mcf)
Wetzel Gas ($/Mcf)
Clearfield Gas ($/Mcf)
Fayette Gas ($/Mcf)
Butler Gas ($/Mcf)
Dry Gas ($/Mcf)
Oil ($/bbl)
NGL ($/bbl)
Total Gas Revenues
Total Oil Revenues
Total NGL Revenues
Total Revenues
Total Operating Expenses
Operating Cash Flow
Total Capital Expenditures
Apple Operating Cash Flow
Apple Upfront Payment
Apple Net Free Cash Flow
Apple Cumulative Cash Flow (I

Yearly Projections (Summa
Realized Prices
Marshall Gas ($/Mcf)
Wetzel Gas ($/Mcf)
Clearfield Gas ($/Mcf)
Fayette Gas ($/Mcf)
Butler Gas ($/Mcf)
Dry Gas ($/Mcf)
Oil ($/bbl)
NGL ($/bbl)
Total Gas Revenues
Total Oil Revenues
Total NGL Revenues
Total Revenues
Total Operating Expenses
Operating Cash Flow
Total Capital Expenditures
Apple Operating Cash Flow
Apple Upfront Payment

2024
Apr-24

2024
M ay-24

2024
Jun-24

2024
Jul-24

2024
Aug-24

2024
Sep-24

2024
Oct-24

2024
Nov-24

2024
Dec-24

6.23
6.23
6.48
6.15
6.23
6.48
73.52
46.89
11,623.40
741.63
1,436.23
13,801.26
1,666.15
12,135.11
700.00
6,067.56
0.00
3,740.45
450,759.18

6.23
6.23
6.48
6.15
6.23
6.48
73.52
46.89
11,547.16
735.48
1,428.85
13,711.49
1,661.96
12,049.54
700.00
6,024.77
0.00
3,709.87
454,469.05

6.23
6.23
6.48
6.15
6.23
6.48
73.52
46.89
11,472.32
728.58
1,421.57
13,622.47
1,657.78
11,964.69
550.00
5,982.34
0.00
3,734.72
458,203.77

6.23
6.23
6.48
6.15
6.23
6.48
73.52
46.89
11,398.68
722.35
1,414.31
13,535.35
1,653.70
11,881.64
0.00
5,940.82
0.00
3,908.41
462,112.18

6.23
6.23
6.48
6.15
6.23
6.48
73.52
46.89
11,326.36
716.29
1,407.16
13,449.81
1,649.71
11,800.10
700.00
5,900.05
0.00
3,620.38
465,732.57

6.23
6.23
6.48
6.15
6.23
6.48
73.52
46.89
11,255.18
710.16
1,400.08
13,365.41
1,645.75
11,719.66
550.00
5,859.83
0.00
3,647.05
469,379.61

6.23
6.23
6.48
6.15
6.23
6.48
73.52
46.89
11,185.20
703.57
1,393.04
13,281.82
1,641.83
11,639.99
0.00
5,819.99
0.00
3,821.84
473,201.46

6.23
6.23
6.48
6.15
6.23
6.48
73.52
46.89
11,116.36
697.34
1,386.09
13,199.79
1,637.97
11,561.82
700.00
5,780.91
0.00
3,535.55
476,737.01

6.23
6.23
6.48
6.15
6.23
6.48
73.52
46.89
11,048.61
691.64
1,379.21
13,119.46
1,634.20
11,485.26
550.00
5,742.63
0.00
3,563.09
480,300.10
Monthly Projections (Summ
Date
Realized Prices
Marshall Gas ($/Mcf)
Wetzel Gas ($/Mcf)
Clearfield Gas ($/Mcf)
Fayette Gas ($/Mcf)
Butler Gas ($/Mcf)
Dry Gas ($/Mcf)
Oil ($/bbl)
NGL ($/bbl)
Total Gas Revenues
Total Oil Revenues
Total NGL Revenues
Total Revenues
Total Operating Expenses
Operating Cash Flow
Total Capital Expenditures
Apple Operating Cash Flow
Apple Upfront Payment
Apple Net Free Cash Flow
Apple Cumulative Cash Flow (I

Yearly Projections (Summa
Realized Prices
Marshall Gas ($/Mcf)
Wetzel Gas ($/Mcf)
Clearfield Gas ($/Mcf)
Fayette Gas ($/Mcf)
Butler Gas ($/Mcf)
Dry Gas ($/Mcf)
Oil ($/bbl)
NGL ($/bbl)
Total Gas Revenues
Total Oil Revenues
Total NGL Revenues
Total Revenues
Total Operating Expenses
Operating Cash Flow
Total Capital Expenditures
Apple Operating Cash Flow
Apple Upfront Payment

2025
Jan-25

2025
Feb-25

2025
M ar-25

2025
Apr-25

2025
M ay-25

2025
Jun-25

2025
Jul-25

2025
Aug-25

2025
Sep-25

6.23
6.23
6.48
6.15
6.23
6.48
73.52
46.89
10,981.95
686.10
1,372.38
13,040.44
1,630.52
11,409.91
0.00
5,704.96
0.00
3,741.35
484,041.46

6.23
6.23
6.48
6.15
6.23
6.48
73.52
46.89
10,916.43
680.18
1,365.63
12,962.23
1,626.84
11,335.40
0.00
5,667.70
0.00
3,717.07
487,758.52

6.23
6.23
6.48
6.15
6.23
6.48
73.52
46.89
10,851.77
674.04
1,358.91
12,884.72
1,623.20
11,261.53
550.00
5,630.76
0.00
3,490.18
491,248.71

6.23
6.23
6.48
6.15
6.23
6.48
73.52
46.89
10,788.15
668.12
1,352.28
12,808.55
1,619.59
11,188.96
700.00
5,594.48
0.00
3,407.38
494,656.09

6.23
6.23
6.48
6.15
6.23
6.48
73.52
46.89
10,725.45
663.10
1,345.68
12,734.23
1,616.12
11,118.11
700.00
5,559.05
0.00
3,384.29
498,040.38

6.23
6.23
6.48
6.15
6.23
6.48
73.52
46.89
10,663.86
656.94
1,339.19
12,659.99
1,612.63
11,047.36
550.00
5,523.68
0.00
3,416.55
501,456.92

6.23
6.23
6.48
6.15
6.23
6.48
73.52
46.89
10,603.05
651.68
1,332.72
12,587.45
1,609.21
10,978.24
0.00
5,489.12
0.00
3,596.83
505,053.76

6.23
6.23
6.48
6.15
6.23
6.48
73.52
46.89
10,543.08
646.63
1,326.29
12,516.00
1,605.86
10,910.14
700.00
5,455.07
0.00
3,316.52
508,370.27

6.23
6.23
6.48
6.15
6.23
6.48
73.52
46.89
10,484.02
641.24
1,319.93
12,445.19
1,602.55
10,842.64
550.00
5,421.32
0.00
3,349.83
511,720.11
Monthly Projections (Summ
Date
Realized Prices
Marshall Gas ($/Mcf)
Wetzel Gas ($/Mcf)
Clearfield Gas ($/Mcf)
Fayette Gas ($/Mcf)
Butler Gas ($/Mcf)
Dry Gas ($/Mcf)
Oil ($/bbl)
NGL ($/bbl)
Total Gas Revenues
Total Oil Revenues
Total NGL Revenues
Total Revenues
Total Operating Expenses
Operating Cash Flow
Total Capital Expenditures
Apple Operating Cash Flow
Apple Upfront Payment
Apple Net Free Cash Flow
Apple Cumulative Cash Flow (I

Yearly Projections (Summa
Realized Prices
Marshall Gas ($/Mcf)
Wetzel Gas ($/Mcf)
Clearfield Gas ($/Mcf)
Fayette Gas ($/Mcf)
Butler Gas ($/Mcf)
Dry Gas ($/Mcf)
Oil ($/bbl)
NGL ($/bbl)
Total Gas Revenues
Total Oil Revenues
Total NGL Revenues
Total Revenues
Total Operating Expenses
Operating Cash Flow
Total Capital Expenditures
Apple Operating Cash Flow
Apple Upfront Payment

2025
Oct-25

2025
Nov-25

2025
Dec-25

2026
Jan-26

2026
Feb-26

2026
M ar-26

2026
Apr-26

2026
M ay-26

2026
Jun-26

6.23
6.23
6.48
6.15
6.23
6.48
73.52
46.89
10,425.79
635.70
1,313.62
12,375.11
1,599.22
10,775.89
0.00
5,387.94
0.00
3,530.89
515,251.00

6.23
6.23
6.48
6.15
6.23
6.48
73.52
46.89
10,368.39
630.43
1,307.36
12,306.18
1,595.98
10,710.20
700.00
5,355.10
0.00
3,251.36
518,502.36

6.23
6.23
6.48
6.15
6.23
6.48
73.52
46.89
10,311.64
624.82
1,301.14
12,237.60
1,592.73
10,644.88
550.00
5,322.44
0.00
3,285.38
521,787.74

6.23
6.23
6.48
6.15
6.23
6.48
73.52
46.89
10,255.74
620.64
1,294.95
12,171.34
1,589.65
10,581.69
0.00
5,290.85
0.00
3,467.61
525,255.35

6.23
6.23
6.48
6.15
6.23
6.48
73.52
46.89
10,200.68
615.45
1,288.84
12,104.97
1,586.52
10,518.45
0.00
5,259.23
0.00
3,447.00
528,702.35

6.23
6.23
6.48
6.15
6.23
6.48
73.52
46.89
10,146.24
609.86
1,282.74
12,038.83
1,583.37
10,455.47
550.00
5,227.73
0.00
3,223.66
531,926.01

6.23
6.23
6.48
6.15
6.23
6.48
73.52
46.89
10,092.48
605.14
1,276.69
11,974.31
1,580.34
10,393.98
700.00
5,196.99
0.00
3,148.31
535,074.32

6.23
6.23
6.48
6.15
6.23
6.48
73.52
46.89
10,039.38
600.76
1,270.67
11,910.81
1,577.38
10,333.43
700.00
5,166.71
0.00
3,128.58
538,202.89

6.23
6.23
6.48
6.15
6.23
6.48
73.52
46.89
9,987.06
595.54
1,264.70
11,847.30
1,574.36
10,272.95
550.00
5,136.47
0.00
3,164.18
541,367.07
Monthly Projections (Summ
Date
Realized Prices
Marshall Gas ($/Mcf)
Wetzel Gas ($/Mcf)
Clearfield Gas ($/Mcf)
Fayette Gas ($/Mcf)
Butler Gas ($/Mcf)
Dry Gas ($/Mcf)
Oil ($/bbl)
NGL ($/bbl)
Total Gas Revenues
Total Oil Revenues
Total NGL Revenues
Total Revenues
Total Operating Expenses
Operating Cash Flow
Total Capital Expenditures
Apple Operating Cash Flow
Apple Upfront Payment
Apple Net Free Cash Flow
Apple Cumulative Cash Flow (I

Yearly Projections (Summa
Realized Prices
Marshall Gas ($/Mcf)
Wetzel Gas ($/Mcf)
Clearfield Gas ($/Mcf)
Fayette Gas ($/Mcf)
Butler Gas ($/Mcf)
Dry Gas ($/Mcf)
Oil ($/bbl)
NGL ($/bbl)
Total Gas Revenues
Total Oil Revenues
Total NGL Revenues
Total Revenues
Total Operating Expenses
Operating Cash Flow
Total Capital Expenditures
Apple Operating Cash Flow
Apple Upfront Payment

2026
Jul-26

2026
Aug-26

2026
Sep-26

2026
Oct-26

2026
Nov-26

2026
Dec-26

2027
Jan-27

2027
Feb-27

2027
M ar-27

6.23
6.23
6.48
6.15
6.23
6.48
73.52
46.89
9,935.33
590.78
1,258.77
11,784.88
1,571.42
10,213.46
0.00
5,106.73
0.00
3,347.61
544,714.68

6.23
6.23
6.48
6.15
6.23
6.48
73.52
46.89
9,884.17
586.21
1,252.86
11,723.25
1,568.54
10,154.71
700.00
5,077.35
0.00
3,070.34
547,785.02

6.23
6.23
6.48
6.15
6.23
6.48
73.52
46.89
9,833.68
581.80
1,246.99
11,662.47
1,565.67
10,096.80
550.00
5,048.40
0.00
3,106.78
550,891.79

6.23
6.23
6.48
6.15
6.23
6.48
73.52
46.89
9,783.79
576.72
1,241.16
11,601.68
1,562.79
10,038.89
0.00
5,019.45
0.00
3,290.72
554,182.51

6.23
6.23
6.48
6.15
6.23
6.48
73.52
46.89
9,734.54
572.47
1,235.37
11,542.37
1,560.00
9,982.37
700.00
4,991.19
0.00
3,014.18
557,196.69

6.23
6.23
6.48
6.15
6.23
6.48
73.52
46.89
9,685.71
567.37
1,229.59
11,482.67
1,557.16
9,925.51
550.00
4,962.75
0.00
3,050.96
560,247.64

6.23
6.23
6.48
6.15
6.23
6.48
73.52
46.89
9,637.49
563.64
1,223.84
11,424.97
1,554.49
9,870.48
0.00
4,935.24
0.00
3,235.84
563,483.48

6.23
6.23
6.48
6.15
6.23
6.48
73.52
46.89
9,589.81
558.95
1,218.13
11,366.90
1,551.74
9,815.16
0.00
4,907.58
0.00
3,217.81
566,701.29

6.23
6.23
6.48
6.15
6.23
6.48
73.52
46.89
9,542.64
554.16
1,212.45
11,309.24
1,549.00
9,760.24
550.00
4,880.12
0.00
2,997.10
569,698.39
Monthly Projections (Summ
Date
Realized Prices
Marshall Gas ($/Mcf)
Wetzel Gas ($/Mcf)
Clearfield Gas ($/Mcf)
Fayette Gas ($/Mcf)
Butler Gas ($/Mcf)
Dry Gas ($/Mcf)
Oil ($/bbl)
NGL ($/bbl)
Total Gas Revenues
Total Oil Revenues
Total NGL Revenues
Total Revenues
Total Operating Expenses
Operating Cash Flow
Total Capital Expenditures
Apple Operating Cash Flow
Apple Upfront Payment
Apple Net Free Cash Flow
Apple Cumulative Cash Flow (I

Yearly Projections (Summa
Realized Prices
Marshall Gas ($/Mcf)
Wetzel Gas ($/Mcf)
Clearfield Gas ($/Mcf)
Fayette Gas ($/Mcf)
Butler Gas ($/Mcf)
Dry Gas ($/Mcf)
Oil ($/bbl)
NGL ($/bbl)
Total Gas Revenues
Total Oil Revenues
Total NGL Revenues
Total Revenues
Total Operating Expenses
Operating Cash Flow
Total Capital Expenditures
Apple Operating Cash Flow
Apple Upfront Payment

2027
Apr-27

2027
M ay-27

2027
Jun-27

2027
Jul-27

2027
Aug-27

2027
Sep-27

2027
Oct-27

2027
Nov-27

2027
Dec-27

6.23
6.23
6.48
6.15
6.23
6.48
73.52
46.89
9,495.96
550.17
1,206.79
11,252.92
1,546.35
9,706.57
700.00
4,853.28
0.00
2,924.30
572,622.68

6.23
6.23
6.48
6.15
6.23
6.48
73.52
46.89
9,449.76
546.15
1,201.16
11,197.07
1,543.74
9,653.33
700.00
4,826.67
0.00
2,906.95
575,529.63

6.23
6.23
6.48
6.15
6.23
6.48
73.52
46.89
9,404.05
541.40
1,195.57
11,141.02
1,541.10
9,599.92
550.00
4,799.96
0.00
2,944.85
578,474.49

6.23
6.23
6.48
6.15
6.23
6.48
73.52
46.89
9,358.78
537.16
1,189.99
11,085.93
1,538.48
9,547.45
0.00
4,773.73
0.00
3,130.57
581,605.05

6.23
6.23
6.48
6.15
6.23
6.48
73.52
46.89
9,313.92
533.55
1,184.44
11,031.90
1,535.96
9,495.95
700.00
4,747.97
0.00
2,855.66
584,460.71

6.23
6.23
6.48
6.15
6.23
6.48
73.52
46.89
9,269.63
529.09
1,178.92
10,977.65
1,533.39
9,444.26
550.00
4,722.13
0.00
2,894.13
587,354.84

6.23
6.23
6.48
6.15
6.23
6.48
73.52
46.89
9,225.65
524.72
1,173.44
10,923.80
1,530.85
9,392.95
0.00
4,696.48
0.00
3,080.22
590,435.06

6.23
6.23
6.48
6.15
6.23
6.48
73.52
46.89
9,182.16
520.97
1,167.97
10,871.09
1,528.37
9,342.73
700.00
4,671.36
0.00
2,805.73
593,240.79

6.23
6.23
6.48
6.15
6.23
6.48
73.52
46.89
9,138.99
517.11
1,162.53
10,818.63
1,525.89
9,292.74
550.00
4,646.37
0.00
2,844.75
596,085.54
Monthly Projections (Summ
Date
Realized Prices
Marshall Gas ($/Mcf)
Wetzel Gas ($/Mcf)
Clearfield Gas ($/Mcf)
Fayette Gas ($/Mcf)
Butler Gas ($/Mcf)
Dry Gas ($/Mcf)
Oil ($/bbl)
NGL ($/bbl)
Total Gas Revenues
Total Oil Revenues
Total NGL Revenues
Total Revenues
Total Operating Expenses
Operating Cash Flow
Total Capital Expenditures
Apple Operating Cash Flow
Apple Upfront Payment
Apple Net Free Cash Flow
Apple Cumulative Cash Flow (I

Yearly Projections (Summa
Realized Prices
Marshall Gas ($/Mcf)
Wetzel Gas ($/Mcf)
Clearfield Gas ($/Mcf)
Fayette Gas ($/Mcf)
Butler Gas ($/Mcf)
Dry Gas ($/Mcf)
Oil ($/bbl)
NGL ($/bbl)
Total Gas Revenues
Total Oil Revenues
Total NGL Revenues
Total Revenues
Total Operating Expenses
Operating Cash Flow
Total Capital Expenditures
Apple Operating Cash Flow
Apple Upfront Payment

2028
Jan-28

2028
Feb-28

2028
M ar-28

2028
Apr-28

2028
M ay-28

2028
Jun-28

2028
Jul-28

2028
Aug-28

2028
Sep-28

6.23
6.23
6.48
6.15
6.23
6.48
73.52
46.89
9,096.19
512.77
1,157.11
10,766.07
1,523.43
9,242.65
0.00
4,621.32
0.00
3,031.24
599,116.78

6.23
6.23
6.48
6.15
6.23
6.48
73.52
46.89
9,053.79
508.81
1,151.72
10,714.32
1,520.98
9,193.34
0.00
4,596.67
0.00
3,015.17
602,131.95

6.23
6.23
6.48
6.15
6.23
6.48
73.52
46.89
9,011.74
505.18
1,146.35
10,663.26
1,518.57
9,144.69
550.00
4,572.35
0.00
2,796.50
604,928.45

6.23
6.23
6.48
6.15
6.23
6.48
73.52
46.89
8,970.01
501.55
1,141.01
10,612.57
1,516.19
9,096.38
700.00
4,548.19
0.00
2,725.45
607,653.90

6.23
6.23
6.48
6.15
6.23
6.48
73.52
46.89
8,928.68
497.15
1,135.71
10,561.54
1,513.78
9,047.76
700.00
4,523.88
0.00
2,709.60
610,363.50

6.23
6.23
6.48
6.15
6.23
6.48
73.52
46.89
8,887.65
493.30
1,130.41
10,511.37
1,511.41
8,999.96
550.00
4,499.98
0.00
2,749.34
613,112.84

6.23
6.23
6.48
6.15
6.23
6.48
73.52
46.89
8,846.93
489.96
1,125.14
10,462.02
1,509.09
8,952.93
0.00
4,476.46
0.00
2,936.83
616,049.67

6.23
6.23
6.48
6.15
6.23
6.48
73.52
46.89
8,806.48
486.69
1,119.89
10,413.06
1,506.80
8,906.26
700.00
4,453.13
0.00
2,663.49
618,713.16

6.23
6.23
6.48
6.15
6.23
6.48
73.52
46.89
8,766.44
481.72
1,114.70
10,362.86
1,504.40
8,858.46
550.00
4,429.23
0.00
2,703.23
621,416.38
Monthly Projections (Summ
Date
Realized Prices
Marshall Gas ($/Mcf)
Wetzel Gas ($/Mcf)
Clearfield Gas ($/Mcf)
Fayette Gas ($/Mcf)
Butler Gas ($/Mcf)
Dry Gas ($/Mcf)
Oil ($/bbl)
NGL ($/bbl)
Total Gas Revenues
Total Oil Revenues
Total NGL Revenues
Total Revenues
Total Operating Expenses
Operating Cash Flow
Total Capital Expenditures
Apple Operating Cash Flow
Apple Upfront Payment
Apple Net Free Cash Flow
Apple Cumulative Cash Flow (I

Yearly Projections (Summa
Realized Prices
Marshall Gas ($/Mcf)
Wetzel Gas ($/Mcf)
Clearfield Gas ($/Mcf)
Fayette Gas ($/Mcf)
Butler Gas ($/Mcf)
Dry Gas ($/Mcf)
Oil ($/bbl)
NGL ($/bbl)
Total Gas Revenues
Total Oil Revenues
Total NGL Revenues
Total Revenues
Total Operating Expenses
Operating Cash Flow
Total Capital Expenditures
Apple Operating Cash Flow
Apple Upfront Payment

2028
Oct-28

2028
Nov-28

2028
Dec-28

2029
Jan-29

2029
Feb-29

2029
M ar-29

2029
Apr-29

2029
M ay-29

2029
Jun-29

6.23
6.23
6.48
6.15
6.23
6.48
73.52
46.89
8,726.53
478.65
1,109.49
10,314.67
1,502.15
8,812.52
0.00
4,406.26
0.00
2,891.07
624,307.45

6.23
6.23
6.48
6.15
6.23
6.48
73.52
46.89
8,687.02
475.30
1,104.32
10,266.65
1,499.89
8,766.76
700.00
4,383.38
0.00
2,618.03
626,925.48

6.23
6.23
6.48
6.15
6.23
6.48
73.52
46.89
8,647.72
471.83
1,099.19
10,218.74
1,497.63
8,721.10
550.00
4,360.55
0.00
2,658.47
629,583.95

6.23
6.23
6.48
6.15
6.23
6.48
73.52
46.89
8,608.66
467.45
1,094.07
10,170.18
1,495.33
8,674.85
0.00
4,337.42
0.00
2,846.20
632,430.15

6.23
6.23
6.48
6.15
6.23
6.48
73.52
46.89
8,569.88
464.18
1,088.96
10,123.02
1,493.12
8,629.90
0.00
4,314.95
0.00
2,831.56
635,261.71

6.23
6.23
6.48
6.15
6.23
6.48
73.52
46.89
8,531.29
461.11
1,083.88
10,076.29
1,490.93
8,585.36
550.00
4,292.68
0.00
2,614.23
637,875.94

6.23
6.23
6.48
6.15
6.23
6.48
73.52
46.89
8,493.01
457.50
1,078.84
10,029.34
1,488.70
8,540.64
700.00
4,270.32
0.00
2,544.34
640,420.28

6.23
6.23
6.48
6.15
6.23
6.48
73.52
46.89
8,454.89
453.65
1,073.84
9,982.38
1,486.48
8,495.90
700.00
4,247.95
0.00
2,529.76
642,950.05

6.23
6.23
6.48
6.15
6.23
6.48
73.52
46.89
8,417.05
450.05
1,068.82
9,935.92
1,484.28
8,451.65
550.00
4,225.82
0.00
2,570.65
645,520.70
Monthly Projections (Summ
Date
Realized Prices
Marshall Gas ($/Mcf)
Wetzel Gas ($/Mcf)
Clearfield Gas ($/Mcf)
Fayette Gas ($/Mcf)
Butler Gas ($/Mcf)
Dry Gas ($/Mcf)
Oil ($/bbl)
NGL ($/bbl)
Total Gas Revenues
Total Oil Revenues
Total NGL Revenues
Total Revenues
Total Operating Expenses
Operating Cash Flow
Total Capital Expenditures
Apple Operating Cash Flow
Apple Upfront Payment
Apple Net Free Cash Flow
Apple Cumulative Cash Flow (I

Yearly Projections (Summa
Realized Prices
Marshall Gas ($/Mcf)
Wetzel Gas ($/Mcf)
Clearfield Gas ($/Mcf)
Fayette Gas ($/Mcf)
Butler Gas ($/Mcf)
Dry Gas ($/Mcf)
Oil ($/bbl)
NGL ($/bbl)
Total Gas Revenues
Total Oil Revenues
Total NGL Revenues
Total Revenues
Total Operating Expenses
Operating Cash Flow
Total Capital Expenditures
Apple Operating Cash Flow
Apple Upfront Payment

2029
Jul-29

2029
Aug-29

2029
Sep-29

2029
Oct-29

2029
Nov-29

2029
Dec-29

2030
Jan-30

2030
Feb-30

2030
M ar-30

6.23
6.23
6.48
6.15
6.23
6.48
73.52
46.89
8,379.40
447.14
1,063.84
9,890.38
1,482.15
8,408.23
0.00
4,204.11
0.00
2,759.32
648,280.02

6.23
6.23
6.48
6.15
6.23
6.48
73.52
46.89
8,341.99
443.87
1,058.89
9,844.75
1,480.00
8,364.75
700.00
4,182.38
0.00
2,487.02
650,767.04

6.23
6.23
6.48
6.15
6.23
6.48
73.52
46.89
8,304.74
439.99
1,053.98
9,798.71
1,477.81
8,320.90
550.00
4,160.45
0.00
2,528.05
653,295.09

6.23
6.23
6.48
6.15
6.23
6.48
73.52
46.89
8,267.71
437.05
1,049.05
9,753.81
1,475.70
8,278.11
0.00
4,139.05
0.00
2,716.91
656,012.00

6.23
6.23
6.48
6.15
6.23
6.48
73.52
46.89
8,230.88
433.80
1,044.18
9,708.86
1,473.58
8,235.28
700.00
4,117.64
0.00
2,444.83
658,456.84

6.23
6.23
6.48
6.15
6.23
6.48
73.52
46.89
8,194.29
430.87
1,039.33
9,664.49
1,471.50
8,192.99
550.00
4,096.49
0.00
2,486.36
660,943.20

6.23
6.23
6.48
6.15
6.23
6.48
73.52
46.89
8,157.79
427.22
1,034.48
9,619.49
1,469.37
8,150.11
0.00
4,075.06
0.00
2,675.20
663,618.40

6.23
6.23
6.48
6.15
6.23
6.48
73.52
46.89
8,121.48
424.00
1,029.65
9,575.13
1,467.27
8,107.86
0.00
4,053.93
0.00
2,661.43
666,279.84

6.23
6.23
6.48
6.15
6.23
6.48
73.52
46.89
8,085.35
421.09
1,024.86
9,531.30
1,465.22
8,066.09
550.00
4,033.04
0.00
2,445.01
668,724.84
Monthly Projections (Summ
Date
Realized Prices
Marshall Gas ($/Mcf)
Wetzel Gas ($/Mcf)
Clearfield Gas ($/Mcf)
Fayette Gas ($/Mcf)
Butler Gas ($/Mcf)
Dry Gas ($/Mcf)
Oil ($/bbl)
NGL ($/bbl)
Total Gas Revenues
Total Oil Revenues
Total NGL Revenues
Total Revenues
Total Operating Expenses
Operating Cash Flow
Total Capital Expenditures
Apple Operating Cash Flow
Apple Upfront Payment
Apple Net Free Cash Flow
Apple Cumulative Cash Flow (I

Yearly Projections (Summa
Realized Prices
Marshall Gas ($/Mcf)
Wetzel Gas ($/Mcf)
Clearfield Gas ($/Mcf)
Fayette Gas ($/Mcf)
Butler Gas ($/Mcf)
Dry Gas ($/Mcf)
Oil ($/bbl)
NGL ($/bbl)
Total Gas Revenues
Total Oil Revenues
Total NGL Revenues
Total Revenues
Total Operating Expenses
Operating Cash Flow
Total Capital Expenditures
Apple Operating Cash Flow
Apple Upfront Payment

2030
Apr-30

2030
M ay-30

2030
Jun-30

2030
Jul-30

2030
Aug-30

2030
Sep-30

2030
Oct-30

2030
Nov-30

2030
Dec-30

6.23
6.23
6.48
6.15
6.23
6.48
73.52
46.89
8,049.53
417.88
1,020.12
9,487.53
1,463.14
8,024.39
700.00
4,012.19
0.00
2,376.11
671,100.95

6.23
6.23
6.48
6.15
6.23
6.48
73.52
46.89
8,013.73
414.87
1,015.37
9,443.97
1,461.08
7,982.88
700.00
3,991.44
0.00
2,362.58
673,463.53

6.23
6.23
6.48
6.15
6.23
6.48
73.52
46.89
7,978.15
411.37
1,010.64
9,400.17
1,459.02
7,941.15
550.00
3,970.58
0.00
2,404.29
675,867.82

6.23
6.23
6.48
6.15
6.23
6.48
73.52
46.89
7,942.76
408.50
1,005.93
9,357.18
1,456.99
7,900.19
0.00
3,950.09
0.00
2,593.76
678,461.58

6.23
6.23
6.48
6.15
6.23
6.48
73.52
46.89
7,907.51
405.45
1,001.27
9,314.22
1,454.95
7,859.27
700.00
3,929.64
0.00
2,322.30
680,783.88

6.23
6.23
6.48
6.15
6.23
6.48
73.52
46.89
7,872.45
402.83
996.61
9,271.90
1,452.97
7,818.93
550.00
3,909.46
0.00
2,364.46
683,148.34

6.23
6.23
6.48
6.15
6.23
6.48
73.52
46.89
7,837.60
399.48
991.97
9,229.04
1,450.93
7,778.11
0.00
3,889.06
0.00
2,553.98
685,702.32

6.23
6.23
6.48
6.15
6.23
6.48
73.52
46.89
7,802.85
396.76
987.36
9,186.97
1,448.97
7,738.00
700.00
3,869.00
0.00
2,282.78
687,985.10

6.23
6.23
6.48
6.15
6.23
6.48
73.52
46.89
7,768.33
394.22
982.77
9,145.32
1,447.01
7,698.31
550.00
3,849.16
0.00
2,325.16
690,310.25
Monthly Projections (Summ
Date
Realized Prices
Marshall Gas ($/Mcf)
Wetzel Gas ($/Mcf)
Clearfield Gas ($/Mcf)
Fayette Gas ($/Mcf)
Butler Gas ($/Mcf)
Dry Gas ($/Mcf)
Oil ($/bbl)
NGL ($/bbl)
Total Gas Revenues
Total Oil Revenues
Total NGL Revenues
Total Revenues
Total Operating Expenses
Operating Cash Flow
Total Capital Expenditures
Apple Operating Cash Flow
Apple Upfront Payment
Apple Net Free Cash Flow
Apple Cumulative Cash Flow (I

Yearly Projections (Summa
Realized Prices
Marshall Gas ($/Mcf)
Wetzel Gas ($/Mcf)
Clearfield Gas ($/Mcf)
Fayette Gas ($/Mcf)
Butler Gas ($/Mcf)
Dry Gas ($/Mcf)
Oil ($/bbl)
NGL ($/bbl)
Total Gas Revenues
Total Oil Revenues
Total NGL Revenues
Total Revenues
Total Operating Expenses
Operating Cash Flow
Total Capital Expenditures
Apple Operating Cash Flow
Apple Upfront Payment

2031
Jan-31

2031
Feb-31

2031
M ar-31

2031
Apr-31

2031
M ay-31

2031
Jun-31

2031
Jul-31

6.23
6.23
6.48
6.15
6.23
6.48
73.52
46.89
7,733.91
391.26
978.18
9,103.36
1,445.02
7,658.34
0.00
3,829.17
0.00
2,514.94
692,825.19

6.23
6.23
6.48
6.15
6.23
6.48
73.52
46.89
7,699.57
388.19
973.62
9,061.39
1,443.03
7,618.36
550.00
3,809.18
0.00
2,299.50
695,124.70

6.23
6.23
6.48
6.15
6.23
6.48
73.52
46.89
7,665.60
385.24
969.12
9,019.96
1,441.09
7,578.88
0.00
3,789.44
0.00
2,489.05
697,613.74

6.23
6.23
6.48
6.15
6.23
6.48
73.52
46.89
7,631.70
382.43
964.61
8,978.73
1,439.14
7,539.60
1,950.00
3,769.80
0.00
1,758.10
699,371.84

6.23
6.23
6.48
6.15
6.23
6.48
73.52
46.89
7,597.99
380.17
960.12
8,938.28
1,437.25
7,501.03
0.00
3,750.52
0.00
2,464.08
701,835.92

6.23
6.23
6.48
6.15
6.23
6.48
73.52
46.89
7,564.40
377.00
955.66
8,897.05
1,435.27
7,461.78
1,250.00
3,730.89
0.00
1,990.86
703,826.78

6.23
6.23
6.48
6.15
6.23
6.48
73.52
46.89
7,530.95
374.63
951.19
8,856.76
1,433.38
7,423.39
0.00
3,711.69
0.00
96,585.02
800,411.80
Oil and gas valuation model   700 sheets - gazhoo.com

Weitere ähnliche Inhalte

Andere mochten auch

Oil and Gas Case Law Update: Recent Decisions Impacting Oil and Gas Practice
Oil and Gas Case Law Update: Recent Decisions Impacting Oil and Gas PracticeOil and Gas Case Law Update: Recent Decisions Impacting Oil and Gas Practice
Oil and Gas Case Law Update: Recent Decisions Impacting Oil and Gas PracticeLisa McManus
 
Allocation Wells and What Makes Them Different
Allocation Wells and What Makes Them DifferentAllocation Wells and What Makes Them Different
Allocation Wells and What Makes Them DifferentBailey LeRoux
 
Advanced Insulation Deal Flyer
Advanced Insulation Deal FlyerAdvanced Insulation Deal Flyer
Advanced Insulation Deal FlyerHarry Walker
 
Economic &financial determinants of oil and gas
Economic &financial determinants of oil and gasEconomic &financial determinants of oil and gas
Economic &financial determinants of oil and gasNikhil Singh
 
Oil and Gas Technology Forum Drilling Day
Oil and Gas Technology Forum Drilling DayOil and Gas Technology Forum Drilling Day
Oil and Gas Technology Forum Drilling DayArena International
 
Common Oil and Gas Lease Conundrums eBook
Common Oil and Gas Lease Conundrums eBookCommon Oil and Gas Lease Conundrums eBook
Common Oil and Gas Lease Conundrums eBookMarcellus Drilling News
 
Marrison oilgasposter2012 nacaa
Marrison oilgasposter2012 nacaaMarrison oilgasposter2012 nacaa
Marrison oilgasposter2012 nacaanacaa
 
Oil & Gas Programs
Oil & Gas ProgramsOil & Gas Programs
Oil & Gas ProgramsREISA
 
Tips for Landowners with Respect to Oil & Gas Leases Expiring
Tips for Landowners with Respect to Oil & Gas Leases ExpiringTips for Landowners with Respect to Oil & Gas Leases Expiring
Tips for Landowners with Respect to Oil & Gas Leases ExpiringMarcellus Drilling News
 
2016 06-30 ppt- for presentation
2016 06-30 ppt- for presentation2016 06-30 ppt- for presentation
2016 06-30 ppt- for presentationpathomas
 
Energy power shift 09_2016
Energy power shift 09_2016 Energy power shift 09_2016
Energy power shift 09_2016 Vasilis Rallis
 
Ohio House Bill 493 "Truth in Leasing" for Oil & Gas Leases
Ohio House Bill 493 "Truth in Leasing" for Oil & Gas LeasesOhio House Bill 493 "Truth in Leasing" for Oil & Gas Leases
Ohio House Bill 493 "Truth in Leasing" for Oil & Gas LeasesMarcellus Drilling News
 

Andere mochten auch (13)

Oil and Gas Case Law Update: Recent Decisions Impacting Oil and Gas Practice
Oil and Gas Case Law Update: Recent Decisions Impacting Oil and Gas PracticeOil and Gas Case Law Update: Recent Decisions Impacting Oil and Gas Practice
Oil and Gas Case Law Update: Recent Decisions Impacting Oil and Gas Practice
 
Allocation Wells and What Makes Them Different
Allocation Wells and What Makes Them DifferentAllocation Wells and What Makes Them Different
Allocation Wells and What Makes Them Different
 
Advanced Insulation Deal Flyer
Advanced Insulation Deal FlyerAdvanced Insulation Deal Flyer
Advanced Insulation Deal Flyer
 
Economic &financial determinants of oil and gas
Economic &financial determinants of oil and gasEconomic &financial determinants of oil and gas
Economic &financial determinants of oil and gas
 
Oil and Gas Technology Forum Drilling Day
Oil and Gas Technology Forum Drilling DayOil and Gas Technology Forum Drilling Day
Oil and Gas Technology Forum Drilling Day
 
Common Oil and Gas Lease Conundrums eBook
Common Oil and Gas Lease Conundrums eBookCommon Oil and Gas Lease Conundrums eBook
Common Oil and Gas Lease Conundrums eBook
 
Marrison oilgasposter2012 nacaa
Marrison oilgasposter2012 nacaaMarrison oilgasposter2012 nacaa
Marrison oilgasposter2012 nacaa
 
Oil & Gas Programs
Oil & Gas ProgramsOil & Gas Programs
Oil & Gas Programs
 
Tips for Landowners with Respect to Oil & Gas Leases Expiring
Tips for Landowners with Respect to Oil & Gas Leases ExpiringTips for Landowners with Respect to Oil & Gas Leases Expiring
Tips for Landowners with Respect to Oil & Gas Leases Expiring
 
2016 06-30 ppt- for presentation
2016 06-30 ppt- for presentation2016 06-30 ppt- for presentation
2016 06-30 ppt- for presentation
 
Brown Dense Oil and Gas Leasing
Brown Dense Oil and Gas LeasingBrown Dense Oil and Gas Leasing
Brown Dense Oil and Gas Leasing
 
Energy power shift 09_2016
Energy power shift 09_2016 Energy power shift 09_2016
Energy power shift 09_2016
 
Ohio House Bill 493 "Truth in Leasing" for Oil & Gas Leases
Ohio House Bill 493 "Truth in Leasing" for Oil & Gas LeasesOhio House Bill 493 "Truth in Leasing" for Oil & Gas Leases
Ohio House Bill 493 "Truth in Leasing" for Oil & Gas Leases
 

Ähnlich wie Oil and gas valuation model 700 sheets - gazhoo.com

Presupuesto de efectivo con rotaciones
Presupuesto de efectivo con rotacionesPresupuesto de efectivo con rotaciones
Presupuesto de efectivo con rotacionesrrvn73
 
PROJECTED BUDGETING U'SWEDEN'E 2017
PROJECTED BUDGETING U'SWEDEN'E 2017PROJECTED BUDGETING U'SWEDEN'E 2017
PROJECTED BUDGETING U'SWEDEN'E 2017Fabrice CLAMAGIRAND
 
FHC USUEDEE FORECAST BUDGETING 2019
FHC USUEDEE FORECAST BUDGETING 2019FHC USUEDEE FORECAST BUDGETING 2019
FHC USUEDEE FORECAST BUDGETING 2019Fabrice CLAMAGIRAND
 
MonthMonthly Returns ()MonthMonthly Returns ()MonthMonth.pdf
MonthMonthly Returns ()MonthMonthly Returns ()MonthMonth.pdfMonthMonthly Returns ()MonthMonthly Returns ()MonthMonth.pdf
MonthMonthly Returns ()MonthMonthly Returns ()MonthMonth.pdfmckenziecast21211
 
FHC BERLIN FORECAST BUDGETING 2019
FHC BERLIN FORECAST BUDGETING 2019FHC BERLIN FORECAST BUDGETING 2019
FHC BERLIN FORECAST BUDGETING 2019Fabrice CLAMAGIRAND
 
Pay fixation charts from 1983 to 2017 Pakistan
Pay fixation charts from 1983 to 2017 PakistanPay fixation charts from 1983 to 2017 Pakistan
Pay fixation charts from 1983 to 2017 PakistanSyed Ahsan Ali Shah
 
1 PROJECTED BUDGETING FHC MADRID SHG 2017
1 PROJECTED BUDGETING FHC MADRID SHG 20171 PROJECTED BUDGETING FHC MADRID SHG 2017
1 PROJECTED BUDGETING FHC MADRID SHG 2017Fabrice CLAMAGIRAND
 
2 PROJECTED BUDGETING FHC MADRID SHG 2017
2 PROJECTED BUDGETING FHC MADRID SHG 20172 PROJECTED BUDGETING FHC MADRID SHG 2017
2 PROJECTED BUDGETING FHC MADRID SHG 2017Fabrice CLAMAGIRAND
 
PROJECTED BUDGETING R'PORTUGAL'M 2017
PROJECTED BUDGETING R'PORTUGAL'M 2017PROJECTED BUDGETING R'PORTUGAL'M 2017
PROJECTED BUDGETING R'PORTUGAL'M 2017Fabrice CLAMAGIRAND
 

Ähnlich wie Oil and gas valuation model 700 sheets - gazhoo.com (20)

Presupuesto de efectivo con rotaciones
Presupuesto de efectivo con rotacionesPresupuesto de efectivo con rotaciones
Presupuesto de efectivo con rotaciones
 
Pract.4
Pract.4Pract.4
Pract.4
 
FHC BUDGET ZDUBLINI 2017
FHC BUDGET ZDUBLINI 2017FHC BUDGET ZDUBLINI 2017
FHC BUDGET ZDUBLINI 2017
 
PROJECTED BUDGETING U'SWEDEN'E 2017
PROJECTED BUDGETING U'SWEDEN'E 2017PROJECTED BUDGETING U'SWEDEN'E 2017
PROJECTED BUDGETING U'SWEDEN'E 2017
 
FHC U SUEDE E 2017
FHC U SUEDE E 2017FHC U SUEDE E 2017
FHC U SUEDE E 2017
 
FHC USUEDEE FORECAST BUDGETING 2019
FHC USUEDEE FORECAST BUDGETING 2019FHC USUEDEE FORECAST BUDGETING 2019
FHC USUEDEE FORECAST BUDGETING 2019
 
FHC BUDGET DAUSTRALIAP 2017
FHC BUDGET DAUSTRALIAP 2017FHC BUDGET DAUSTRALIAP 2017
FHC BUDGET DAUSTRALIAP 2017
 
Sample Financial Projection- Perniagaan Pak Uteh-Bidor, Perak
Sample Financial Projection- Perniagaan Pak Uteh-Bidor, PerakSample Financial Projection- Perniagaan Pak Uteh-Bidor, Perak
Sample Financial Projection- Perniagaan Pak Uteh-Bidor, Perak
 
MonthMonthly Returns ()MonthMonthly Returns ()MonthMonth.pdf
MonthMonthly Returns ()MonthMonthly Returns ()MonthMonth.pdfMonthMonthly Returns ()MonthMonthly Returns ()MonthMonth.pdf
MonthMonthly Returns ()MonthMonthly Returns ()MonthMonth.pdf
 
FHC BERLIN FORECAST BUDGETING 2019
FHC BERLIN FORECAST BUDGETING 2019FHC BERLIN FORECAST BUDGETING 2019
FHC BERLIN FORECAST BUDGETING 2019
 
Pay fixation charts from 1983 to 2017 Pakistan
Pay fixation charts from 1983 to 2017 PakistanPay fixation charts from 1983 to 2017 Pakistan
Pay fixation charts from 1983 to 2017 Pakistan
 
1 PROJECTED BUDGETING FHC MADRID SHG 2017
1 PROJECTED BUDGETING FHC MADRID SHG 20171 PROJECTED BUDGETING FHC MADRID SHG 2017
1 PROJECTED BUDGETING FHC MADRID SHG 2017
 
FHC MADRID SHG 2017
FHC MADRID SHG 2017FHC MADRID SHG 2017
FHC MADRID SHG 2017
 
FHC MADRID SHG 2017
FHC MADRID SHG 2017FHC MADRID SHG 2017
FHC MADRID SHG 2017
 
FHC BUDGET RPORTUGALM 2017
FHC BUDGET RPORTUGALM 2017FHC BUDGET RPORTUGALM 2017
FHC BUDGET RPORTUGALM 2017
 
2019 In Review
 2019 In Review 2019 In Review
2019 In Review
 
FHC MADRID SHG 2017
FHC MADRID SHG 2017FHC MADRID SHG 2017
FHC MADRID SHG 2017
 
2 PROJECTED BUDGETING FHC MADRID SHG 2017
2 PROJECTED BUDGETING FHC MADRID SHG 20172 PROJECTED BUDGETING FHC MADRID SHG 2017
2 PROJECTED BUDGETING FHC MADRID SHG 2017
 
FHC R PORTUGAL M 2017
FHC R PORTUGAL M 2017FHC R PORTUGAL M 2017
FHC R PORTUGAL M 2017
 
PROJECTED BUDGETING R'PORTUGAL'M 2017
PROJECTED BUDGETING R'PORTUGAL'M 2017PROJECTED BUDGETING R'PORTUGAL'M 2017
PROJECTED BUDGETING R'PORTUGAL'M 2017
 

Mehr von gazhoo

Bankers sell your financial models wallstreethacks
Bankers sell your financial models wallstreethacksBankers sell your financial models wallstreethacks
Bankers sell your financial models wallstreethacksgazhoo
 
Wall street hacks
Wall street hacksWall street hacks
Wall street hacksgazhoo
 
Analysts - Sell your excel files
Analysts - Sell your excel filesAnalysts - Sell your excel files
Analysts - Sell your excel filesgazhoo
 
Gazhoo Consulting Tool Marketplace
Gazhoo Consulting Tool MarketplaceGazhoo Consulting Tool Marketplace
Gazhoo Consulting Tool Marketplacegazhoo
 
Growth strategy presentation
Growth strategy presentationGrowth strategy presentation
Growth strategy presentationgazhoo
 
Guide to competitive assessment
Guide to competitive assessment Guide to competitive assessment
Guide to competitive assessment gazhoo
 

Mehr von gazhoo (6)

Bankers sell your financial models wallstreethacks
Bankers sell your financial models wallstreethacksBankers sell your financial models wallstreethacks
Bankers sell your financial models wallstreethacks
 
Wall street hacks
Wall street hacksWall street hacks
Wall street hacks
 
Analysts - Sell your excel files
Analysts - Sell your excel filesAnalysts - Sell your excel files
Analysts - Sell your excel files
 
Gazhoo Consulting Tool Marketplace
Gazhoo Consulting Tool MarketplaceGazhoo Consulting Tool Marketplace
Gazhoo Consulting Tool Marketplace
 
Growth strategy presentation
Growth strategy presentationGrowth strategy presentation
Growth strategy presentation
 
Guide to competitive assessment
Guide to competitive assessment Guide to competitive assessment
Guide to competitive assessment
 

Kürzlich hochgeladen

Pharma Works Profile of Karan Communications
Pharma Works Profile of Karan CommunicationsPharma Works Profile of Karan Communications
Pharma Works Profile of Karan Communicationskarancommunications
 
Grateful 7 speech thanking everyone that has helped.pdf
Grateful 7 speech thanking everyone that has helped.pdfGrateful 7 speech thanking everyone that has helped.pdf
Grateful 7 speech thanking everyone that has helped.pdfPaul Menig
 
VIP Call Girls In Saharaganj ( Lucknow ) 🔝 8923113531 🔝 Cash Payment (COD) 👒
VIP Call Girls In Saharaganj ( Lucknow  ) 🔝 8923113531 🔝  Cash Payment (COD) 👒VIP Call Girls In Saharaganj ( Lucknow  ) 🔝 8923113531 🔝  Cash Payment (COD) 👒
VIP Call Girls In Saharaganj ( Lucknow ) 🔝 8923113531 🔝 Cash Payment (COD) 👒anilsa9823
 
9599632723 Top Call Girls in Delhi at your Door Step Available 24x7 Delhi
9599632723 Top Call Girls in Delhi at your Door Step Available 24x7 Delhi9599632723 Top Call Girls in Delhi at your Door Step Available 24x7 Delhi
9599632723 Top Call Girls in Delhi at your Door Step Available 24x7 DelhiCall Girls in Delhi
 
Value Proposition canvas- Customer needs and pains
Value Proposition canvas- Customer needs and painsValue Proposition canvas- Customer needs and pains
Value Proposition canvas- Customer needs and painsP&CO
 
Mondelez State of Snacking and Future Trends 2023
Mondelez State of Snacking and Future Trends 2023Mondelez State of Snacking and Future Trends 2023
Mondelez State of Snacking and Future Trends 2023Neil Kimberley
 
Call Girls Navi Mumbai Just Call 9907093804 Top Class Call Girl Service Avail...
Call Girls Navi Mumbai Just Call 9907093804 Top Class Call Girl Service Avail...Call Girls Navi Mumbai Just Call 9907093804 Top Class Call Girl Service Avail...
Call Girls Navi Mumbai Just Call 9907093804 Top Class Call Girl Service Avail...Dipal Arora
 
Enhancing and Restoring Safety & Quality Cultures - Dave Litwiller - May 2024...
Enhancing and Restoring Safety & Quality Cultures - Dave Litwiller - May 2024...Enhancing and Restoring Safety & Quality Cultures - Dave Litwiller - May 2024...
Enhancing and Restoring Safety & Quality Cultures - Dave Litwiller - May 2024...Dave Litwiller
 
Cash Payment 9602870969 Escort Service in Udaipur Call Girls
Cash Payment 9602870969 Escort Service in Udaipur Call GirlsCash Payment 9602870969 Escort Service in Udaipur Call Girls
Cash Payment 9602870969 Escort Service in Udaipur Call GirlsApsara Of India
 
BEST ✨ Call Girls In Indirapuram Ghaziabad ✔️ 9871031762 ✔️ Escorts Service...
BEST ✨ Call Girls In  Indirapuram Ghaziabad  ✔️ 9871031762 ✔️ Escorts Service...BEST ✨ Call Girls In  Indirapuram Ghaziabad  ✔️ 9871031762 ✔️ Escorts Service...
BEST ✨ Call Girls In Indirapuram Ghaziabad ✔️ 9871031762 ✔️ Escorts Service...noida100girls
 
Russian Faridabad Call Girls(Badarpur) : ☎ 8168257667, @4999
Russian Faridabad Call Girls(Badarpur) : ☎ 8168257667, @4999Russian Faridabad Call Girls(Badarpur) : ☎ 8168257667, @4999
Russian Faridabad Call Girls(Badarpur) : ☎ 8168257667, @4999Tina Ji
 
KYC-Verified Accounts: Helping Companies Handle Challenging Regulatory Enviro...
KYC-Verified Accounts: Helping Companies Handle Challenging Regulatory Enviro...KYC-Verified Accounts: Helping Companies Handle Challenging Regulatory Enviro...
KYC-Verified Accounts: Helping Companies Handle Challenging Regulatory Enviro...Any kyc Account
 
Monte Carlo simulation : Simulation using MCSM
Monte Carlo simulation : Simulation using MCSMMonte Carlo simulation : Simulation using MCSM
Monte Carlo simulation : Simulation using MCSMRavindra Nath Shukla
 
Unlocking the Secrets of Affiliate Marketing.pdf
Unlocking the Secrets of Affiliate Marketing.pdfUnlocking the Secrets of Affiliate Marketing.pdf
Unlocking the Secrets of Affiliate Marketing.pdfOnline Income Engine
 
M.C Lodges -- Guest House in Jhang.
M.C Lodges --  Guest House in Jhang.M.C Lodges --  Guest House in Jhang.
M.C Lodges -- Guest House in Jhang.Aaiza Hassan
 
Call Girls Pune Just Call 9907093804 Top Class Call Girl Service Available
Call Girls Pune Just Call 9907093804 Top Class Call Girl Service AvailableCall Girls Pune Just Call 9907093804 Top Class Call Girl Service Available
Call Girls Pune Just Call 9907093804 Top Class Call Girl Service AvailableDipal Arora
 
The Coffee Bean & Tea Leaf(CBTL), Business strategy case study
The Coffee Bean & Tea Leaf(CBTL), Business strategy case studyThe Coffee Bean & Tea Leaf(CBTL), Business strategy case study
The Coffee Bean & Tea Leaf(CBTL), Business strategy case studyEthan lee
 
VIP Call Girl Jamshedpur Aashi 8250192130 Independent Escort Service Jamshedpur
VIP Call Girl Jamshedpur Aashi 8250192130 Independent Escort Service JamshedpurVIP Call Girl Jamshedpur Aashi 8250192130 Independent Escort Service Jamshedpur
VIP Call Girl Jamshedpur Aashi 8250192130 Independent Escort Service JamshedpurSuhani Kapoor
 

Kürzlich hochgeladen (20)

Pharma Works Profile of Karan Communications
Pharma Works Profile of Karan CommunicationsPharma Works Profile of Karan Communications
Pharma Works Profile of Karan Communications
 
Grateful 7 speech thanking everyone that has helped.pdf
Grateful 7 speech thanking everyone that has helped.pdfGrateful 7 speech thanking everyone that has helped.pdf
Grateful 7 speech thanking everyone that has helped.pdf
 
VIP Call Girls In Saharaganj ( Lucknow ) 🔝 8923113531 🔝 Cash Payment (COD) 👒
VIP Call Girls In Saharaganj ( Lucknow  ) 🔝 8923113531 🔝  Cash Payment (COD) 👒VIP Call Girls In Saharaganj ( Lucknow  ) 🔝 8923113531 🔝  Cash Payment (COD) 👒
VIP Call Girls In Saharaganj ( Lucknow ) 🔝 8923113531 🔝 Cash Payment (COD) 👒
 
9599632723 Top Call Girls in Delhi at your Door Step Available 24x7 Delhi
9599632723 Top Call Girls in Delhi at your Door Step Available 24x7 Delhi9599632723 Top Call Girls in Delhi at your Door Step Available 24x7 Delhi
9599632723 Top Call Girls in Delhi at your Door Step Available 24x7 Delhi
 
Value Proposition canvas- Customer needs and pains
Value Proposition canvas- Customer needs and painsValue Proposition canvas- Customer needs and pains
Value Proposition canvas- Customer needs and pains
 
Mondelez State of Snacking and Future Trends 2023
Mondelez State of Snacking and Future Trends 2023Mondelez State of Snacking and Future Trends 2023
Mondelez State of Snacking and Future Trends 2023
 
Call Girls Navi Mumbai Just Call 9907093804 Top Class Call Girl Service Avail...
Call Girls Navi Mumbai Just Call 9907093804 Top Class Call Girl Service Avail...Call Girls Navi Mumbai Just Call 9907093804 Top Class Call Girl Service Avail...
Call Girls Navi Mumbai Just Call 9907093804 Top Class Call Girl Service Avail...
 
Enhancing and Restoring Safety & Quality Cultures - Dave Litwiller - May 2024...
Enhancing and Restoring Safety & Quality Cultures - Dave Litwiller - May 2024...Enhancing and Restoring Safety & Quality Cultures - Dave Litwiller - May 2024...
Enhancing and Restoring Safety & Quality Cultures - Dave Litwiller - May 2024...
 
Cash Payment 9602870969 Escort Service in Udaipur Call Girls
Cash Payment 9602870969 Escort Service in Udaipur Call GirlsCash Payment 9602870969 Escort Service in Udaipur Call Girls
Cash Payment 9602870969 Escort Service in Udaipur Call Girls
 
BEST ✨ Call Girls In Indirapuram Ghaziabad ✔️ 9871031762 ✔️ Escorts Service...
BEST ✨ Call Girls In  Indirapuram Ghaziabad  ✔️ 9871031762 ✔️ Escorts Service...BEST ✨ Call Girls In  Indirapuram Ghaziabad  ✔️ 9871031762 ✔️ Escorts Service...
BEST ✨ Call Girls In Indirapuram Ghaziabad ✔️ 9871031762 ✔️ Escorts Service...
 
Russian Faridabad Call Girls(Badarpur) : ☎ 8168257667, @4999
Russian Faridabad Call Girls(Badarpur) : ☎ 8168257667, @4999Russian Faridabad Call Girls(Badarpur) : ☎ 8168257667, @4999
Russian Faridabad Call Girls(Badarpur) : ☎ 8168257667, @4999
 
KYC-Verified Accounts: Helping Companies Handle Challenging Regulatory Enviro...
KYC-Verified Accounts: Helping Companies Handle Challenging Regulatory Enviro...KYC-Verified Accounts: Helping Companies Handle Challenging Regulatory Enviro...
KYC-Verified Accounts: Helping Companies Handle Challenging Regulatory Enviro...
 
Nepali Escort Girl Kakori \ 9548273370 Indian Call Girls Service Lucknow ₹,9517
Nepali Escort Girl Kakori \ 9548273370 Indian Call Girls Service Lucknow ₹,9517Nepali Escort Girl Kakori \ 9548273370 Indian Call Girls Service Lucknow ₹,9517
Nepali Escort Girl Kakori \ 9548273370 Indian Call Girls Service Lucknow ₹,9517
 
VVVIP Call Girls In Greater Kailash ➡️ Delhi ➡️ 9999965857 🚀 No Advance 24HRS...
VVVIP Call Girls In Greater Kailash ➡️ Delhi ➡️ 9999965857 🚀 No Advance 24HRS...VVVIP Call Girls In Greater Kailash ➡️ Delhi ➡️ 9999965857 🚀 No Advance 24HRS...
VVVIP Call Girls In Greater Kailash ➡️ Delhi ➡️ 9999965857 🚀 No Advance 24HRS...
 
Monte Carlo simulation : Simulation using MCSM
Monte Carlo simulation : Simulation using MCSMMonte Carlo simulation : Simulation using MCSM
Monte Carlo simulation : Simulation using MCSM
 
Unlocking the Secrets of Affiliate Marketing.pdf
Unlocking the Secrets of Affiliate Marketing.pdfUnlocking the Secrets of Affiliate Marketing.pdf
Unlocking the Secrets of Affiliate Marketing.pdf
 
M.C Lodges -- Guest House in Jhang.
M.C Lodges --  Guest House in Jhang.M.C Lodges --  Guest House in Jhang.
M.C Lodges -- Guest House in Jhang.
 
Call Girls Pune Just Call 9907093804 Top Class Call Girl Service Available
Call Girls Pune Just Call 9907093804 Top Class Call Girl Service AvailableCall Girls Pune Just Call 9907093804 Top Class Call Girl Service Available
Call Girls Pune Just Call 9907093804 Top Class Call Girl Service Available
 
The Coffee Bean & Tea Leaf(CBTL), Business strategy case study
The Coffee Bean & Tea Leaf(CBTL), Business strategy case studyThe Coffee Bean & Tea Leaf(CBTL), Business strategy case study
The Coffee Bean & Tea Leaf(CBTL), Business strategy case study
 
VIP Call Girl Jamshedpur Aashi 8250192130 Independent Escort Service Jamshedpur
VIP Call Girl Jamshedpur Aashi 8250192130 Independent Escort Service JamshedpurVIP Call Girl Jamshedpur Aashi 8250192130 Independent Escort Service Jamshedpur
VIP Call Girl Jamshedpur Aashi 8250192130 Independent Escort Service Jamshedpur
 

Oil and gas valuation model 700 sheets - gazhoo.com

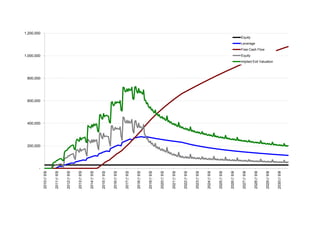
  • 1. 2030년 9월 2029년 9월 2028년 9월 1,000,000 2027년 9월 2026년 9월 2025년 9월 2024년 9월 2023년 9월 2022년 9월 2021년 9월 2020년 9월 2019년 9월 2018년 9월 2017년 9월 2016년 9월 2015년 9월 2014년 9월 2013년 9월 2012년 9월 2011년 9월 2010년 9월 1,200,000 Equity Leverage Free Cash Flow Equity Implied Exit Valuation 800,000 600,000 400,000 200,000 -
  • 2. 800 Cum Free Cash Flow Leverage Equity Implied Exit Valuation Out of Pocket Investment 9,000/Mcfe/d Exit Valuation @ 5 years 700 600 ($MM) 500 400 300 200 100 2010 2012 2014 2016 2018 2020 2022 2024 2026 2028 2030
  • 3. Leverage Cum Cash Flow Initial Capex Implied Exit Valuation Equity Leverage Free Cash Flow Equity Implied Exit Valuation Out of Pocket Investment Equity Leverage Cum Free Cash Flow Implied Exit Valuation Out of Pocket Investment 50 Sep-10 30,000 63 Oct-10 30,000 63 Nov-10 30,000 63 Dec-10 30,000 2,136 Jan-11 30,000 2,074 - - - - - 30,000 32,163 30,000 32,225 30,000 32,288 30,000 34,428 30,000 36,509 Feb-11 30,000 2,074 Mar-11 30,000 2,555 Apr-11 30,000 10,640 May-11 30,000 5,338 Jun-11 30,000 5,207 Jul-11 30,000 4,725 Aug-11 30,000 5,338 - - - 42,617 52,328 55,134 59,769 30,000 38,592 30,000 41,161 30,000 51,817 30,000 12,617 42,617 56,352 30,000 22,328 52,328 60,601 30,000 25,134 55,134 64,271 30,000 29,769 59,769 68,454 gazhoo.com 12-31-10 12-31-11 12-31-12 12-31-13 12-31-14 12-31-15 12-31-16 12-31-17 12-31-18 12-31-19 12-31-20 12-31-21 30,000 66,812 152,803 196,278 266,583 317,216 379,205 432,139 387,697 233,045 179,361 137,896 17,247 47,515 74,290 112,994 154,507 206,382 259,945 281,604 269,183 252,211 237,707 61,093 134,961 226,880 338,411 455,233 549,869 631,436 30,000 84,059 200,317 270,568 379,576 471,723 585,587 692,084 669,301 502,228 431,573 375,603 30,000 84,059 200,317 270,568 379,576 471,723 585,587 692,084 669,301 502,228 431,573 375,603 34,428 82,890 123,000 123,000 123,000 123,000 123,000 123,000 123,000 123,000 123,000 123,000
  • 4. Leverage Cum Cash Flow Initial Capex Sep-11 5,207 30,000 5,207 Oct-11 9,932 30,000 4,725 Nov-11 15,270 30,000 5,338 Dec-11 17,247 30,000 5,207 Jan-12 16,946 30,000 3,395 Feb-12 16,678 30,000 3,395 Mar-12 16,434 30,000 3,877 Apr-12 25,985 30,000 19,915 Implied Exit Valuation 70,610 72,338 78,790 84,059 87,349 83,090 70,877 67,761 142,501 156,380 157,972 165,168 30,000 5,207 35,403 70,610 72,340 30,000 9,932 32,406 72,338 75,649 30,000 15,270 33,520 78,790 79,445 30,000 17,247 36,812 84,059 82,890 30,000 16,946 40,403 87,349 84,441 30,000 16,678 36,412 83,090 86,211 30,000 16,434 24,443 70,877 88,639 30,000 25,985 11,776 67,761 107,269 30,000 29,085 83,417 142,501 113,596 30,000 31,657 94,724 156,380 115,857 30,000 34,206 93,766 157,972 117,687 30,000 37,227 97,940 165,168 119,700 Equity Leverage Free Cash Flow Equity Implied Exit Valuation Out of Pocket Investment Equity Leverage Cum Free Cash Flow Implied Exit Valuation Out of Pocket Investment m May-12 29,085 30,000 9,212 12-31-22 12-31-23 12-31-24 12-31-25 12-31-26 12-31-27 12-31-28 12-31-29 12-31-30 120,896 113,605 107,377 102,001 97,264 92,983 89,008 85,243 81,656 216,972 195,674 178,969 165,279 153,710 143,652 134,679 126,473 118,832 694,989 749,461 801,843 851,765 899,180 944,083 986,481 1,026,365 1,063,756 337,867 309,278 286,346 267,280 250,973 236,636 223,687 211,717 200,488 337,867 309,278 286,346 267,280 250,973 236,636 223,687 211,717 200,488 123,000 123,000 123,000 123,000 123,000 123,000 123,000 123,000 123,000 Jun-12 31,657 30,000 5,335 Jul-12 34,206 30,000 5,060 Aug-12 37,227 30,000 5,410
  • 5. Leverage Cum Cash Flow Initial Capex Sep-12 39,713 30,000 5,335 Oct-12 42,175 30,000 5,060 Nov-12 45,111 30,000 5,410 Dec-12 47,515 30,000 5,335 Jan-13 46,804 30,000 1,400 Feb-13 46,162 30,000 2,310 Mar-13 45,570 30,000 2,585 Apr-13 56,339 30,000 13,265 May-13 59,171 30,000 4,780 Jun-13 61,400 30,000 6,525 Jul-13 62,086 30,000 2,915 Aug-13 66,486 30,000 7,205 Implied Exit Valuation 182,315 183,176 196,140 200,317 206,260 206,348 172,038 166,177 245,714 259,272 249,887 239,330 Equity Leverage Free Cash Flow Equity Implied Exit Valuation Out of Pocket Investment 30,000 39,713 112,602 182,315 121,401 30,000 42,175 111,001 183,176 122,651 30,000 45,111 121,029 196,140 124,011 30,000 47,515 122,803 200,317 124,951 30,000 46,804 129,456 206,260 124,951 30,000 46,162 130,186 206,348 124,951 30,000 45,570 96,469 172,038 124,951 30,000 56,339 79,838 166,177 128,701 30,000 59,171 156,544 245,714 128,701 30,000 61,400 167,872 259,272 129,556 30,000 62,086 157,801 249,887 129,556 30,000 66,486 142,844 239,330 129,556 Equity Leverage Cum Free Cash Flow Implied Exit Valuation Out of Pocket Investment
  • 6. Leverage Cum Cash Flow Initial Capex Sep-13 67,117 30,000 4,100 Oct-13 69,340 30,000 5,340 Nov-13 72,129 30,000 4,780 Dec-13 74,290 30,000 8,345 Jan-14 73,351 30,000 1,820 Feb-14 72,488 30,000 2,730 Mar-14 71,680 30,000 2,095 Apr-14 89,040 30,000 19,745 May-14 91,496 30,000 5,200 Jun-14 95,161 30,000 7,550 Jul-14 Aug-14 97,167 101,333 30,000 30,000 4,850 7,625 Implied Exit Valuation 274,635 252,746 266,790 270,568 272,568 277,417 234,545 229,226 380,287 371,268 366,771 357,967 Equity Leverage Free Cash Flow Equity Implied Exit Valuation Out of Pocket Investment 30,000 67,117 177,517 274,635 129,556 30,000 69,340 153,406 252,746 129,556 30,000 72,129 164,661 266,790 129,556 30,000 74,290 166,278 270,568 129,556 30,000 73,351 169,217 272,568 129,556 30,000 72,488 174,929 277,417 129,556 30,000 71,680 132,864 234,545 129,556 30,000 89,040 110,186 229,226 133,966 30,000 91,496 258,791 380,287 133,966 30,000 95,161 246,107 371,268 133,966 30,000 97,167 239,605 366,771 133,966 30,000 101,333 226,634 357,967 133,966 Equity Leverage Cum Free Cash Flow Implied Exit Valuation Out of Pocket Investment
  • 7. Leverage Cum Cash Flow Initial Capex Sep-14 Oct-14 Nov-14 Dec-14 Jan-15 Feb-15 Mar-15 Apr-15 May-15 Jun-15 Jul-15 Aug-15 103,311 106,947 109,398 112,994 111,639 110,417 109,278 127,621 132,383 134,534 136,744 143,271 532 3,627 9,687 17,617 22,432 29,069 36,503 30,000 30,000 30,000 30,000 30,000 30,000 30,000 30,000 30,000 30,000 30,000 30,000 5,125 7,275 5,200 9,370 1,820 1,820 3,005 18,835 6,715 6,945 4,850 8,230 Implied Exit Valuation 387,275 367,940 394,337 379,576 393,340 392,829 330,704 322,989 474,716 476,914 444,688 436,762 Equity Leverage Free Cash Flow Equity Implied Exit Valuation Out of Pocket Investment 30,000 103,311 253,964 387,275 133,966 30,000 106,947 230,993 367,940 133,966 30,000 109,398 254,939 394,337 133,966 30,000 112,994 236,583 379,576 133,966 30,000 111,639 251,702 393,340 133,966 30,000 110,417 532 252,412 392,829 133,966 30,000 109,278 3,627 191,426 330,704 133,966 30,000 127,621 9,687 165,369 322,989 133,966 30,000 132,383 17,617 312,333 474,716 133,966 30,000 134,534 22,432 312,380 476,914 133,966 30,000 136,744 29,069 277,944 444,688 133,966 30,000 143,271 36,503 263,491 436,762 133,966 Equity Leverage Cum Free Cash Flow Implied Exit Valuation Out of Pocket Investment
  • 8. Leverage Cum Cash Flow Initial Capex Sep-15 Oct-15 Nov-15 Dec-15 Jan-16 Feb-16 Mar-16 Apr-16 May-16 Jun-16 Jul-16 Aug-16 145,392 147,554 152,391 154,507 152,903 151,411 150,001 175,176 179,949 182,691 187,067 191,818 42,450 49,443 57,330 61,093 65,599 70,397 73,552 81,973 89,448 96,133 102,857 110,583 30,000 30,000 30,000 30,000 30,000 30,000 30,000 30,000 30,000 30,000 30,000 30,000 6,035 4,850 6,715 8,765 4,140 3,230 4,415 25,305 10,050 8,460 9,700 9,140 Implied Exit Valuation 486,091 458,500 468,159 471,723 465,661 462,960 409,452 403,610 586,034 591,053 556,828 561,981 Equity Leverage Free Cash Flow Equity Implied Exit Valuation Out of Pocket Investment 30,000 145,392 42,450 310,699 486,091 133,966 30,000 147,554 49,443 280,947 458,500 133,966 30,000 152,391 57,330 285,769 468,159 133,966 30,000 154,507 61,093 287,216 471,723 133,966 30,000 152,903 65,599 282,758 465,661 133,966 30,000 151,411 70,397 281,549 462,960 133,966 30,000 150,001 73,552 229,451 409,452 133,966 30,000 175,176 81,973 198,433 403,610 133,966 30,000 179,949 89,448 376,085 586,034 133,966 30,000 182,691 96,133 378,363 591,053 133,966 30,000 187,067 102,857 339,761 556,828 133,966 30,000 191,818 110,583 340,163 561,981 133,966 Equity Leverage Cum Free Cash Flow Implied Exit Valuation Out of Pocket Investment
  • 9. Leverage Cum Cash Flow Initial Capex Sep-16 Oct-16 Nov-16 Dec-16 Jan-17 Feb-17 Mar-17 Apr-17 May-17 Jun-17 Jul-17 Aug-17 196,143 198,866 203,687 206,382 204,380 202,508 200,731 230,195 234,122 237,639 241,195 245,260 117,238 125,081 132,106 134,961 141,724 147,796 153,082 159,996 169,105 177,343 185,653 194,027 30,000 30,000 30,000 30,000 30,000 30,000 30,000 30,000 30,000 30,000 30,000 30,000 9,975 7,275 10,050 12,350 3,640 3,640 3,915 33,040 10,050 9,975 9,700 10,050 Implied Exit Valuation 590,731 577,625 590,932 585,587 581,365 601,730 515,821 510,072 720,098 717,719 683,741 679,748 Equity Leverage Free Cash Flow Equity Implied Exit Valuation Out of Pocket Investment 30,000 196,143 117,238 364,588 590,731 133,966 30,000 198,866 125,081 348,759 577,625 133,966 30,000 203,687 132,106 357,245 590,932 133,966 30,000 206,382 134,961 349,205 585,587 133,966 30,000 204,380 141,724 346,985 581,365 133,966 30,000 202,508 147,796 369,223 601,730 133,966 30,000 200,731 153,082 285,090 515,821 133,966 30,000 230,195 159,996 249,877 510,072 133,966 30,000 234,122 169,105 455,977 720,098 133,966 30,000 237,639 177,343 450,080 717,719 133,966 30,000 241,195 185,653 412,546 683,741 133,966 30,000 245,260 194,027 404,488 679,748 133,966 Equity Leverage Cum Free Cash Flow Implied Exit Valuation Out of Pocket Investment
  • 10. Leverage Cum Cash Flow Initial Capex Sep-17 Oct-17 Nov-17 Dec-17 Jan-18 Feb-18 Mar-18 Apr-18 May-18 Jun-18 Jul-18 Aug-18 248,818 252,373 256,419 259,945 257,552 255,312 253,183 269,367 271,818 272,352 272,959 277,065 202,031 210,308 218,749 226,880 237,296 246,909 254,758 263,033 273,888 282,239 292,299 302,174 30,000 30,000 30,000 30,000 30,000 30,000 30,000 30,000 30,000 30,000 30,000 30,000 9,975 9,700 10,050 9,975 1,820 1,820 3,005 20,350 6,715 6,945 4,850 8,230 Implied Exit Valuation 705,778 683,666 708,339 692,084 694,817 719,769 618,313 612,791 719,488 726,444 681,834 667,975 Equity Leverage Free Cash Flow Equity Implied Exit Valuation Out of Pocket Investment 30,000 248,818 202,031 426,960 705,778 133,966 30,000 252,373 210,308 401,293 683,666 133,966 30,000 256,419 218,749 421,920 708,339 133,966 30,000 259,945 226,880 402,139 692,084 133,966 30,000 257,552 237,296 407,265 694,817 133,966 30,000 255,312 246,909 434,457 719,769 133,966 30,000 253,183 254,758 335,130 618,313 133,966 30,000 269,367 263,033 313,423 612,791 133,966 30,000 271,818 273,888 417,670 719,488 133,966 30,000 272,352 282,239 424,092 726,444 133,966 30,000 272,959 292,299 378,876 681,834 133,966 30,000 277,065 302,174 360,910 667,975 133,966 Equity Leverage Cum Free Cash Flow Implied Exit Valuation Out of Pocket Investment
  • 11. Leverage Cum Cash Flow Initial Capex Sep-18 Oct-18 Nov-18 Dec-18 Jan-19 Feb-19 Mar-19 Apr-19 May-19 Jun-19 Jul-19 Aug-19 277,658 278,302 280,954 281,604 279,332 277,167 275,082 282,426 280,947 279,010 277,120 275,769 311,102 320,944 330,709 338,411 349,926 360,888 371,155 381,277 391,408 400,925 410,469 419,933 30,000 30,000 30,000 30,000 30,000 30,000 30,000 30,000 30,000 30,000 30,000 30,000 6,035 4,850 6,715 6,945 275 9,440 350 275 350 Implied Exit Valuation 708,556 670,997 683,038 669,301 659,554 695,891 605,252 605,585 573,529 581,299 548,715 536,187 Equity Leverage Free Cash Flow Equity Implied Exit Valuation Out of Pocket Investment 30,000 277,658 311,102 400,898 708,556 133,966 30,000 278,302 320,944 362,696 670,997 133,966 30,000 280,954 330,709 372,083 683,038 133,966 30,000 281,604 338,411 357,697 669,301 133,966 30,000 279,332 349,926 350,221 659,554 133,966 30,000 277,167 360,888 388,723 695,891 133,966 30,000 275,082 371,155 300,169 605,252 133,966 30,000 282,426 381,277 293,159 605,585 133,966 30,000 280,947 391,408 262,582 573,529 133,966 30,000 279,010 400,925 272,290 581,299 133,966 30,000 277,120 410,469 241,596 548,715 133,966 30,000 275,769 419,933 230,418 536,187 133,966 Equity Leverage Cum Free Cash Flow Implied Exit Valuation Out of Pocket Investment
  • 12. Leverage Cum Cash Flow Initial Capex Sep-19 Oct-19 Nov-19 Dec-19 Jan-20 Feb-20 Mar-20 Apr-20 May-20 Jun-20 Jul-20 Aug-20 273,948 272,165 270,913 269,183 267,485 265,816 264,176 263,058 261,951 260,359 258,791 257,743 428,847 437,838 446,793 455,233 463,782 472,174 480,141 488,391 496,591 504,315 512,182 520,071 30,000 30,000 30,000 30,000 30,000 30,000 30,000 30,000 30,000 30,000 30,000 30,000 275 350 275 275 350 350 275 350 Implied Exit Valuation 546,364 517,779 524,569 502,228 493,021 517,835 476,357 484,367 465,550 477,757 455,134 448,356 Equity Leverage Free Cash Flow Equity Implied Exit Valuation Out of Pocket Investment 30,000 273,948 428,847 242,416 546,364 133,966 30,000 272,165 437,838 215,614 517,779 133,966 30,000 270,913 446,793 223,656 524,569 133,966 30,000 269,183 455,233 203,045 502,228 133,966 30,000 267,485 463,782 195,536 493,021 133,966 30,000 265,816 472,174 222,019 517,835 133,966 30,000 264,176 480,141 182,181 476,357 133,966 30,000 263,058 488,391 191,309 484,367 133,966 30,000 261,951 496,591 173,599 465,550 133,966 30,000 260,359 504,315 187,398 477,757 133,966 30,000 258,791 512,182 166,343 455,134 133,966 30,000 257,743 520,071 160,613 448,356 133,966 Equity Leverage Cum Free Cash Flow Implied Exit Valuation Out of Pocket Investment
  • 13. Leverage Cum Cash Flow Initial Capex Sep-20 Oct-20 Nov-20 Dec-20 Jan-21 Feb-21 Mar-21 Apr-21 May-21 Jun-21 Jul-21 Aug-21 256,207 254,693 253,698 252,211 250,745 249,298 247,869 246,955 246,057 244,679 243,316 242,465 527,499 535,083 542,701 549,869 557,203 564,433 571,290 578,475 585,569 592,156 598,935 605,782 30,000 30,000 30,000 30,000 30,000 30,000 30,000 30,000 30,000 30,000 30,000 30,000 275 350 275 275 350 350 275 350 Implied Exit Valuation 460,819 439,481 447,804 431,573 425,662 465,078 414,759 423,345 404,829 413,523 395,710 391,408 Equity Leverage Free Cash Flow Equity Implied Exit Valuation Out of Pocket Investment 30,000 256,207 527,499 174,612 460,819 133,966 30,000 254,693 535,083 154,788 439,481 133,966 30,000 253,698 542,701 164,106 447,804 133,966 30,000 252,211 549,869 149,361 431,573 133,966 30,000 250,745 557,203 144,917 425,662 133,966 30,000 249,298 564,433 185,780 465,078 133,966 30,000 247,869 571,290 136,890 414,759 133,966 30,000 246,955 578,475 146,390 423,345 133,966 30,000 246,057 585,569 128,772 404,829 133,966 30,000 244,679 592,156 138,844 413,523 133,966 30,000 243,316 598,935 122,394 395,710 133,966 30,000 242,465 605,782 118,943 391,408 133,966 Equity Leverage Cum Free Cash Flow Implied Exit Valuation Out of Pocket Investment
  • 14. Leverage Cum Cash Flow Initial Capex Sep-21 Oct-21 Nov-21 Dec-21 Jan-22 Feb-22 Mar-22 Apr-22 May-22 Jun-22 Jul-22 Aug-22 241,131 239,811 239,001 237,707 236,426 235,157 233,900 233,151 232,413 230,289 227,904 225,591 612,130 618,679 625,303 631,436 637,777 644,053 649,990 656,288 662,525 667,382 672,186 676,645 30,000 30,000 30,000 30,000 30,000 30,000 30,000 30,000 30,000 30,000 30,000 30,000 275 350 275 275 350 350 275 350 Implied Exit Valuation 400,160 383,242 392,002 375,603 371,962 407,909 364,997 373,716 358,407 367,093 352,167 349,170 Equity Leverage Free Cash Flow Equity Implied Exit Valuation Out of Pocket Investment 30,000 241,131 612,130 129,029 400,160 133,966 30,000 239,811 618,679 113,432 383,242 133,966 30,000 239,001 625,303 123,001 392,002 133,966 30,000 237,707 631,436 107,896 375,603 133,966 30,000 236,426 637,777 105,536 371,962 133,966 30,000 235,157 644,053 142,752 407,909 133,966 30,000 233,900 649,990 101,097 364,997 133,966 30,000 233,151 656,288 110,566 373,716 133,966 30,000 232,413 662,525 95,994 358,407 133,966 30,000 230,289 667,382 106,804 367,093 133,966 30,000 227,904 672,186 94,263 352,167 133,966 30,000 225,591 676,645 93,579 349,170 133,966 Equity Leverage Cum Free Cash Flow Implied Exit Valuation Out of Pocket Investment
  • 15. Leverage Cum Cash Flow Initial Capex Sep-22 Oct-22 Nov-22 Dec-22 Jan-23 Feb-23 Mar-23 Apr-23 May-23 Jun-23 Jul-23 Aug-23 223,345 221,162 219,038 216,972 214,957 212,994 211,079 209,209 207,384 205,600 203,856 202,149 681,182 685,995 690,456 694,989 699,791 704,587 709,101 713,530 717,950 722,433 727,179 731,563 30,000 30,000 30,000 30,000 30,000 30,000 30,000 30,000 30,000 30,000 30,000 30,000 275 350 275 275 350 350 275 350 Implied Exit Valuation 357,776 343,385 351,939 337,867 335,199 368,236 330,047 338,468 325,105 333,465 320,359 318,060 Equity Leverage Free Cash Flow Equity Implied Exit Valuation Out of Pocket Investment 30,000 223,345 681,182 104,431 357,776 133,966 30,000 221,162 685,995 92,223 343,385 133,966 30,000 219,038 690,456 102,900 351,939 133,966 30,000 216,972 694,989 90,896 337,867 133,966 30,000 214,957 699,791 90,242 335,199 133,966 30,000 212,994 704,587 125,242 368,236 133,966 30,000 211,079 709,101 88,968 330,047 133,966 30,000 209,209 713,530 99,258 338,468 133,966 30,000 207,384 717,950 87,721 325,105 133,966 30,000 205,600 722,433 97,865 333,465 133,966 30,000 203,856 727,179 86,504 320,359 133,966 30,000 202,149 731,563 85,911 318,060 133,966 Equity Leverage Cum Free Cash Flow Implied Exit Valuation Out of Pocket Investment
  • 16. Leverage Cum Cash Flow Initial Capex Sep-23 Oct-23 Nov-23 Dec-23 Jan-24 Feb-24 Mar-24 Apr-24 May-24 Jun-24 Jul-24 Aug-24 200,480 198,845 197,243 195,674 194,136 192,626 191,146 189,694 188,268 186,869 185,494 184,144 736,009 740,716 745,058 749,461 754,124 758,770 763,127 767,392 771,641 775,949 780,515 784,715 30,000 30,000 30,000 30,000 30,000 30,000 30,000 30,000 30,000 30,000 30,000 30,000 275 350 275 275 350 350 275 350 Implied Exit Valuation 326,324 313,588 321,785 309,278 307,188 326,169 303,107 311,150 299,163 307,147 295,350 293,495 Equity Leverage Free Cash Flow Equity Implied Exit Valuation Out of Pocket Investment 30,000 200,480 736,009 95,844 326,324 133,966 30,000 198,845 740,716 84,744 313,588 133,966 30,000 197,243 745,058 94,542 321,785 133,966 30,000 195,674 749,461 83,605 309,278 133,966 30,000 194,136 754,124 83,053 307,188 133,966 30,000 192,626 758,770 103,543 326,169 133,966 30,000 191,146 763,127 81,961 303,107 133,966 30,000 189,694 767,392 91,456 311,150 133,966 30,000 188,268 771,641 80,895 299,163 133,966 30,000 186,869 775,949 90,278 307,147 133,966 30,000 185,494 780,515 79,856 295,350 133,966 30,000 184,144 784,715 79,352 293,495 133,966 Equity Leverage Cum Free Cash Flow Implied Exit Valuation Out of Pocket Investment
  • 17. Leverage Cum Cash Flow Initial Capex Sep-24 Oct-24 Nov-24 Dec-24 Jan-25 Feb-25 Mar-25 Apr-25 May-25 Jun-25 Jul-25 Aug-25 182,817 181,512 180,230 178,969 177,728 176,508 175,306 174,123 172,959 171,812 170,683 169,570 788,973 793,488 797,637 801,843 806,308 810,755 814,909 818,970 823,015 827,117 831,477 835,470 30,000 30,000 30,000 30,000 30,000 30,000 30,000 30,000 30,000 30,000 30,000 30,000 275 350 275 275 350 350 275 350 Implied Exit Valuation 301,389 289,861 297,690 286,346 284,632 313,256 281,268 288,943 278,009 285,623 274,839 273,290 Equity Leverage Free Cash Flow Equity Implied Exit Valuation Out of Pocket Investment 30,000 182,817 788,973 88,572 301,389 133,966 30,000 181,512 793,488 78,349 289,861 133,966 30,000 180,230 797,637 87,460 297,690 133,966 30,000 178,969 801,843 77,377 286,346 133,966 30,000 177,728 806,308 76,904 284,632 133,966 30,000 176,508 810,755 106,748 313,256 133,966 30,000 175,306 814,909 75,962 281,268 133,966 30,000 174,123 818,970 84,820 288,943 133,966 30,000 172,959 823,015 75,050 278,009 133,966 30,000 171,812 827,117 83,811 285,623 133,966 30,000 170,683 831,477 74,156 274,839 133,966 30,000 169,570 835,470 73,720 273,290 133,966 Equity Leverage Cum Free Cash Flow Implied Exit Valuation Out of Pocket Investment
  • 18. Leverage Cum Cash Flow Initial Capex Sep-25 Oct-25 Nov-25 Dec-25 Jan-26 Feb-26 Mar-26 Apr-26 May-26 Jun-26 Jul-26 Aug-26 168,474 167,394 166,330 165,279 164,244 163,223 162,215 161,221 160,240 159,272 158,316 157,372 839,520 843,828 847,768 851,765 856,021 860,259 864,204 868,057 871,893 875,787 879,937 883,720 30,000 30,000 30,000 30,000 30,000 30,000 30,000 30,000 30,000 30,000 30,000 30,000 275 350 275 275 350 350 275 350 Implied Exit Valuation 280,819 270,247 277,717 267,280 265,839 292,736 262,984 270,308 260,211 267,472 257,496 256,163 Equity Leverage Free Cash Flow Equity Implied Exit Valuation Out of Pocket Investment 30,000 168,474 839,520 82,344 280,819 133,966 30,000 167,394 843,828 72,853 270,247 133,966 30,000 166,330 847,768 81,387 277,717 133,966 30,000 165,279 851,765 72,001 267,280 133,966 30,000 164,244 856,021 71,596 265,839 133,966 30,000 163,223 860,259 99,514 292,736 133,966 30,000 162,215 864,204 70,769 262,984 133,966 30,000 161,221 868,057 79,086 270,308 133,966 30,000 160,240 871,893 69,971 260,211 133,966 30,000 159,272 875,787 78,199 267,472 133,966 30,000 158,316 879,937 69,179 257,496 133,966 30,000 157,372 883,720 68,791 256,163 133,966 Equity Leverage Cum Free Cash Flow Implied Exit Valuation Out of Pocket Investment
  • 19. Leverage Cum Cash Flow Initial Capex Sep-26 Oct-26 Nov-26 Dec-26 Jan-27 Feb-27 Mar-27 Apr-27 May-27 Jun-27 Jul-27 Aug-27 156,440 155,519 154,609 153,710 152,821 151,941 151,072 150,213 149,363 148,522 147,689 146,866 887,561 891,660 895,391 899,180 903,226 907,254 910,990 914,634 918,261 921,945 925,886 929,460 30,000 30,000 30,000 30,000 30,000 30,000 30,000 30,000 30,000 30,000 30,000 30,000 275 350 275 275 350 350 275 350 Implied Exit Valuation 263,343 253,540 260,665 250,973 249,720 275,091 247,229 254,210 244,802 251,717 242,408 241,237 Equity Leverage Free Cash Flow Equity Implied Exit Valuation Out of Pocket Investment 30,000 156,440 887,561 76,903 263,343 133,966 30,000 155,519 891,660 68,021 253,540 133,966 30,000 154,609 895,391 76,057 260,665 133,966 30,000 153,710 899,180 67,264 250,973 133,966 30,000 152,821 903,226 66,900 249,720 133,966 30,000 151,941 907,254 93,150 275,091 133,966 30,000 151,072 910,990 66,156 247,229 133,966 30,000 150,213 914,634 73,997 254,210 133,966 30,000 149,363 918,261 65,439 244,802 133,966 30,000 148,522 921,945 73,195 251,717 133,966 30,000 147,689 925,886 64,719 242,408 133,966 30,000 146,866 929,460 64,371 241,237 133,966 Equity Leverage Cum Free Cash Flow Implied Exit Valuation Out of Pocket Investment
  • 20. Leverage Cum Cash Flow Initial Capex Sep-27 Oct-27 Nov-27 Dec-27 Jan-28 Feb-28 Mar-28 Apr-28 May-28 Jun-28 Jul-28 Aug-28 146,050 145,243 144,443 143,652 142,867 142,090 141,321 140,558 139,801 139,051 138,308 137,571 933,092 936,981 940,503 944,083 947,920 951,739 955,267 958,702 962,119 965,594 969,328 972,694 30,000 30,000 30,000 30,000 30,000 30,000 30,000 30,000 30,000 30,000 30,000 30,000 275 350 275 275 350 350 275 350 Implied Exit Valuation 248,071 238,910 245,695 236,636 235,505 250,553 233,284 239,927 231,091 237,676 228,940 227,879 Equity Leverage Free Cash Flow Equity Implied Exit Valuation Out of Pocket Investment 30,000 146,050 933,092 72,021 248,071 133,966 30,000 145,243 936,981 63,667 238,910 133,966 30,000 144,443 940,503 71,252 245,695 133,966 30,000 143,652 944,083 62,983 236,636 133,966 30,000 142,867 947,920 62,637 235,505 133,966 30,000 142,090 951,739 78,463 250,553 133,966 30,000 141,321 955,267 61,963 233,284 133,966 30,000 140,558 958,702 69,369 239,927 133,966 30,000 139,801 962,119 61,290 231,091 133,966 30,000 139,051 965,594 68,625 237,676 133,966 30,000 138,308 969,328 60,632 228,940 133,966 30,000 137,571 972,694 60,308 227,879 133,966 Equity Leverage Cum Free Cash Flow Implied Exit Valuation Out of Pocket Investment
  • 21. Leverage Cum Cash Flow Initial Capex Sep-28 Oct-28 Nov-28 Dec-28 Jan-29 Feb-29 Mar-29 Apr-29 May-29 Jun-29 Jul-29 Aug-29 136,839 136,113 135,393 134,679 133,969 133,264 132,565 131,871 131,181 130,495 129,815 129,138 976,116 979,796 983,110 986,481 990,108 993,719 997,038 ######## ######## ######## ######## ######## 30,000 30,000 30,000 30,000 30,000 30,000 30,000 30,000 30,000 30,000 30,000 30,000 275 350 275 275 350 350 275 350 Implied Exit Valuation 234,368 225,762 232,213 223,687 222,646 245,371 220,612 Equity Leverage Free Cash Flow Equity Implied Exit Valuation Out of Pocket Investment 30,000 136,839 976,116 67,529 234,368 133,966 30,000 136,113 979,796 59,649 225,762 133,966 30,000 135,393 983,110 66,820 232,213 133,966 30,000 134,679 986,481 59,008 223,687 133,966 30,000 133,969 990,108 58,677 222,646 133,966 30,000 133,264 993,719 82,106 245,371 133,966 30,000 30,000 30,000 132,565 131,871 131,181 997,038 ######## ######## 58,047 65,049 57,408 220,612 226,920 218,589 133,966 133,966 133,966 Equity Leverage Cum Free Cash Flow Implied Exit Valuation Out of Pocket Investment 226,920 218,589 224,841 216,599 215,613 30,000 130,495 ######## 64,345 224,841 133,966 30,000 129,815 ######## 56,785 216,599 133,966 30,000 129,138 ######## 56,475 215,613 133,966
  • 22. Leverage Cum Cash Flow Initial Capex Implied Exit Valuation Equity Leverage Free Cash Flow Equity Implied Exit Valuation Out of Pocket Investment Equity Leverage Cum Free Cash Flow Implied Exit Valuation Out of Pocket Investment Sep-29 Oct-29 Nov-29 Dec-29 Jan-30 Feb-30 Mar-30 Apr-30 May-30 Jun-30 Jul-30 Aug-30 128,466 127,798 127,133 126,473 125,817 125,165 124,516 123,870 123,229 122,591 121,956 121,324 ######## ######## ######## ######## ######## ######## ######## ######## ######## ######## ######## ######## 30,000 30,000 30,000 30,000 30,000 30,000 30,000 30,000 30,000 30,000 30,000 30,000 275 350 275 275 350 350 275 350 221,778 213,650 219,768 211,717 210,748 232,267 208,840 214,824 206,951 212,875 205,077 204,148 30,000 128,466 ######## 63,312 221,778 133,966 30,000 127,798 ######## 55,852 213,650 133,966 30,000 127,133 ######## 62,634 219,768 133,966 30,000 126,473 ######## 55,243 211,717 133,966 30,000 125,817 ######## 54,931 210,748 133,966 30,000 125,165 ######## 77,102 232,267 133,966 30,000 124,516 ######## 54,324 208,840 133,966 30,000 123,870 ######## 60,954 214,824 133,966 30,000 123,229 ######## 53,722 206,951 133,966 30,000 122,591 ######## 60,285 212,875 133,966 30,000 121,956 ######## 53,121 205,077 133,966 30,000 121,324 ######## 52,824 204,148 133,966
  • 23. Leverage Cum Cash Flow Initial Capex Implied Exit Valuation Equity Leverage Free Cash Flow Equity Implied Exit Valuation Out of Pocket Investment Equity Leverage Cum Free Cash Flow Implied Exit Valuation Out of Pocket Investment Sep-30 Oct-30 Nov-30 Dec-30 Jan-31 Feb-31 Mar-31 Apr-31 May-31 Jun-31 Jul-31 120,697 120,072 119,450 118,832 118,217 117,605 116,996 116,390 115,788 115,188 114,592 ######## ######## ######## ######## ######## ######## ######## ######## ######## ######## ######## 30,000 30,000 30,000 30,000 30,000 30,000 30,000 30,000 30,000 30,000 30,000 275 350 275 275 975 625 210,003 202,305 208,106 200,488 199,580 219,960 197,778 203,449 196,005 201,620 194,240 30,000 120,697 ######## 59,307 210,003 133,966 30,000 120,072 ######## 52,234 202,305 133,966 30,000 119,450 ######## 58,656 208,106 133,966 30,000 118,832 ######## 51,656 200,488 133,966 30,000 118,217 ######## 51,363 199,580 133,966 30,000 117,605 ######## 72,355 219,960 133,966 30,000 116,996 ######## 50,782 197,778 133,966 30,000 116,390 ######## 57,059 203,449 133,966 30,000 115,788 ######## 50,217 196,005 133,966 30,000 115,188 ######## 56,431 201,620 133,966 30,000 114,592 ######## 49,647 194,240 133,966 x x x x x x x x x x x x x x x x x x x x x x
  • 24. SUMMARY ASSUMPTIONS (data in US$000s, except per unit data) General Assumptions Model Name Model Start Date Choose Drilling Case Silicon 09-30-10 2 1 = Slow 2 = Base 3 = Accelerated Choose Location Case 4 1 = 1,000' 2 = 500' 3 = Google Location 4 = Dev Plan 92% 251 1 Oil ($/bbl) 1 = Strip 2 = Strip 3 = Strip 4 = Strip M arcellus Summary Drilling Schedule Targeted Wells Per Year 2012 2013 28 28 24 24 4 4 Discount Rate Tax Rate 2010 2 1 1 2011 16 12 4 1 Slow Hz Dry Hz Wet Vert Dry Vert Wet 2 1 1 160 16 25 119 160 16 102 42 2 Base Hz Dry Hz Wet Vert Dry Vert Wet 2 1 1 16 12 4 3 Location Risking (Non-reviewed) 1,000 ft Locations Choose Pricing Case Gas ($/MMBtu) 1 = Strip 2 = $4.00 - LT 3 = $6.00 - LT 4 = $7.00 - LT Name / Type Base Hz Dry Hz Wet Vert Dry Vert Wet Accelerated Hz Dry Hz Wet Vert Dry Vert Wet 2 1 1 168 24 25 119 Case 2 2015 36 13 19 4 2016 52 48 4 63 16 47 - 32 32 - 32 1 31 - 32 32 - 28 24 4 28 24 4 36 32 4 36 13 19 4 52 48 4 172 28 102 42 83 36 47 - 48 25 23 - 48 48 - 48 48 - Horizontal Wet 17 17 Unrisked Well I nventory Summary Pennsylvania Well Type Vertical Vertical Horizontal Dry Wet Total 96 17 15 16 20 16 45 25 7 22 9 4 10 6 17 14 123 96 120 Vertical Total 96 15 20 45 7 9 10 17 219 Dry Total 31 36 70 29 13 16 31 226 Wet Total 113 113 Horizontal Wet 56 39 95 112 Unrisked Well I nventory Summary West Virginia Well Type Vertical Vertical Horizontal Dry Wet Total 3 2 13 11 2 2 2 35 56 25 21 8 2 3 1 31 39 56 66 134 179 162 254 Vertical Total 3 13 2 2 35 25 8 3 31 122 341 Dry Total 5 24 2 4 46 10 4 95 321 Wet Total 91 70 161 274 Risked Well I nventory Summary Pennsylvania Risking % of Risk Horizontal Locations Factor Dry 100% 100% 100% 100% 16 100% 100% 16 100% 100% 25 100% 100% 22 92% 100% 3 100% 100% 6 100% 100% 14 102 Horizontal Wet 17 17 Vertical Dry 15 20 45 7 8 10 17 122 Vertical Wet 96 96 Vertical Dry 2 11 1 2 25 8 3 52 174 Vertical Wet 35 31 66 162 gazhoo.com 10.0% 35.0% Advisory Fees Misc Fees 2014 36 32 4 $1,750 $350 Joint Venture Assumptions Committed Investment Upfront Carry 42.9% $70,000 $30,000 $40,000 I nitial Working I nterest Until Carry is Satisfied Apple WI Google WI Apple % Funding of Google Capex 50.0% 50.0% 75.0% Working I nterest Post Carry Apple WI Google WI Apple % Funding of Google Capex 50.0% 50.0% 0.0% Area Butler Cambria Clarion Clearfield Fayette Greene Jefferson Somerset Horizontal Dry 16 16 25 22 4 6 14 103 Reserve Assumptions Estimated Ultimate Recovery (M M cfe) PA WV Marshall Wetzel Clearfield Fayette Butler Vertical Wet Vertical Dry Devonian 2,955 2,955 3,093 3,269 3,235 3,164 4,319 994 1,143 166 Risking of EURs and IPs (+ / -) - Area Doddridge Gilmer Harrison Lewis Marion Marshall Monongalia Pleasants Tyler Wetzel Operating Marcellus LOE per well ($000 / month) Year 1 Year 2 Year 3 Max Cost escalation $4.5 $4.0 $3.5 $4.5 PA Sev Tax (% of Rev) Additional Sev.($ / Mcf) Sev Tax (Year Start) Ad Valorem Tax WV 5.0% 2012 Devonian LOE per well ($000 / month) Severance Tax Ad Valorem 5.0% $0.047 2010 - Reviewed = 1 1 1 1 1 1 1 1 $0.9 5.0% 4.5% Horizontal Drilling Completion Land Cost Capital Expenditures Clearfield $2,000 $2,530 $320 Other $1,500 $3,030 $320 Horizontal Drilling Completion Land Cost Fayette $1,500 $3,030 $320 Butler $1,500 $3,030 $320 Vertical Drilling Completion Land Cost $390 $700 $160 Devonian 1st Month 2nd Month 3rd Month $175 $175 $75 CAPEX Increase (Decrease) Area Butler Cambria Clarion Clearfield Fayette Greene Jefferson Somerset Horizontal Dry 2 11 2 21 2 1 39 142 Area Doddridge Gilmer Harrison Lewis Marion Marshall Monongalia Pleasants Tyler Wetzel Reviewed = 1 1 1 1 1 1 1 Drilling Assumptions (wells per rig per month) Horizontal Vertical 0.67 4.00 Production Delay (Months) % Intangible Drilling Capex Risked Well I nventory Summary West Virginia Risking % of Risk Horizontal Locations Factor Dry 92% 100% 1 92% 100% 92% 100% 10 92% 100% 100% 100% 2 100% 100% 100% 100% 21 100% 100% 2 100% 100% 1 100% 100% 37 139 Total Locations 75% Well Type Well Type Horizontal Wet 56 39 95 112 251 Leverage Assumptions Total Debt / PDP Reserves ($/Mcfe) Total Debt / EBITDAX Interest Rate 336 $1.00 2.5x 6.0% I mplied Asset Value Assumptions PDP Reserves ($/Mcfe) Production ($/Mcfe/d) $2.00 $9,000
  • 25. APPLE RETURN PROJECTIONS (data in US$000s, except per unit data) 60 ($106,768) - Cum FCF ROI IRR Unlevered After-Tax Economics M onths 96 108 $25,110 $144,164 1.2x 2.1x 3.3% 12.6% 84 ($51,233) - Cum FCF + Asset ROI IRR 240 $680,784 6.1x 22.4% I mplied Asset Value Based on PDP Reserves ($2.00 / M cfe) M onths 36 48 60 $3,654 $74,246 $179,774 1.0x 1.6x 2.3x 1.4% 16.3% 24.4% 84 $439,287 4.3x 29.1% Cum FCF + Asset ROI IRR 120 $237,040 2.8x 16.6% I mplied Asset Value Based on Production ($9,000 / M cfe /d) M onths 36 48 60 $110,012 $229,546 $329,994 1.8x 2.7x 3.5x 34.8% 39.5% 37.0% 84 $628,515 5.7x 35.2% Project After-Tax NPV - Apple I nterest (@ t=0) NPV $276,216 $171,484 $105,970 APPLE SUM M ARY STATI STI CS (data in US$000s, except per unit data) M onth 36 Gross Producing Well Summary Other PA Cos Other WV Cos Marshall Wetzel Clearfield Fayette Butler Vertical Wet Vertical Dry Devonian Total total recovery (MMcfe) Apple Production and Reserves Production Rate (MMcfe/d) Remaining PDP Reserves (Bcfe) Cumulative Production (Bcfe) Cum Apple Drilling Capex 44 1 10 55 572,809 Unlevered $191,981 $83,450 $21,682 60 Discount 10% 15% 20% 72 84 96 120 144 192 240 240 240 56 37 5 6 18 122 237,715.56 5 56 39 10 16 17 22 165 34 56 39 25 22 17 26 219 68 5 56 39 25 22 17 30 262 78 14 56 39 25 22 17 38 289 78 14 56 39 25 22 17 46 297 78 14 56 39 25 22 17 62 313 78 14 56 39 25 22 17 78 329 78 14 56 39 25 22 17 78 329 78 14 56 39 25 22 17 78 329 26.6 66.5 13.4 48.5 143.3 41.7 62.4 191.8 61.7 75.5 245.3 86.6 74.2 277.1 114.4 49.8 257.7 159.9 38.8 229.3 192.3 28.5 188.4 241.2 22.7 158.6 278.9 22.7 158.6 278.9 22.7 158.6 278.9 ₩ 178,478 331,847 432,652 556,312 649,747 687,482 692,482 702,482 712,482 712,482 712,482 Unlevered After-Tax Data Investment Apple Equity JV Investment $129,556 $133,966 $133,966 $133,966 $133,966 $133,966 $133,966 $133,966 $133,966 $133,966 $133,966 Cash Flow Cum Apple Operating Cash Flow Cum Apple Free Cash Flow $81,259 (129,318) $257,179 (106,768) $383,517 (81,235) $537,179 (51,233) $706,957 25,110 $956,622 237,040 $1,091,130 366,548 $1,282,367 547,785 $1,425,366 680,784 $1,425,366 680,784 $1,425,366 680,784 Returns (Cash Flow) Apple ROI Apple IRR Apple Remaining Project PV@10.0% $413,341 $476,037 $496,497 $514,404 1.2x 3.3% $485,582 2.8x 16.6% $351,677 3.7x 19.8% $281,559 5.1x 21.8% $188,089 6.1x 22.4% $111,478 6.1x 22.4% $111,478 6.1x 22.4% $111,478 1.8x 34.8% 3.5x 37.0% 4.6x 36.7% 5.8x 35.2% 6.2x 31.9% 6.1x 26.4% 6.4x 24.4% 7.0x 23.1% 7.6x 22.7% 7.6x 22.7% 7.6x 22.7% Levered After-Tax Data Investment Apple Equity JV Investment $85,203 $85,203 $85,203 $85,203 $85,203 $85,203 $85,203 $85,203 $85,203 $85,203 $85,203 Cash Flow Cum Apple Operating Cash Flow Cum Apple Free Cash Flow $77,054 (67,038) $241,100 20,424 $357,705 84,771 $498,495 155,343 $652,616 247,834 $894,866 433,027 $1,020,783 521,793 $1,182,925 605,715 $1,304,372 681,114 $1,304,372 681,114 $1,304,372 681,114 $517,415 1.2x 6.768% $601,966 2.0x 19.752% $635,056 2.8x 27.098% $666,819 3.9x 32.399% $653,237 6.1x 37.410% $528,268 7.1x 38.462% $429,516 8.1x 38.806% $288,766 9.0x 38.889% $171,435 9.0x 38.889% $171,435 9.0x 38.889% $171,435 2.2x 41.1% 4.7x 46.7% 6.4x 47.4% 8.0x 46.5% 8.5x 43.8% 8.3x 40.0% 8.5x 39.2% 9.2x 38.8% 9.9x 38.8% 9.9x 38.8% 9.9x 38.8% Implied Asset Value (Production) Apple ROI Apple IRR Returns (Cash Flow) Apple ROI Apple IRR Apple Remaining Project PV@10.0% Implied Asset Value (Production) Apple ROI Apple IRR
  • 26. Monthly Projections (Summary) 2010 Sep-10 2010 Oct-10 2010 Nov-10 2010 Dec-10 2011 Jan-11 2011 Feb-11 2011 M ar-11 2011 Apr-11 2011 M ay-11 2011 Jun-11 2011 Jul-11 2011 Aug-11 3.75 3.75 4.00 3.79 3.75 4.00 61.78 39.74 0.00 0.00 0.00 0.00 0.00 0.00 125.00 0.00 -30,000.00 -32,162.50 -32,162.50 3.75 3.75 4.00 3.79 3.75 4.00 61.78 39.74 0.00 0.00 0.00 0.00 0.00 0.00 125.00 0.00 0.00 -62.50 -32,225.00 3.96 3.96 4.21 3.99 3.96 4.21 62.66 40.28 0.00 0.00 0.00 0.00 0.00 0.00 125.00 0.00 0.00 -62.50 -32,287.50 4.22 4.22 4.47 4.24 4.22 4.47 63.51 40.79 0.00 0.00 0.00 0.00 9.00 -9.00 2,495.00 -4.50 0.00 -2,140.75 -34,428.25 4.42 4.42 4.67 4.42 4.42 4.67 64.28 41.27 0.00 0.00 0.00 0.00 13.50 -13.50 2,783.17 -6.75 0.00 -2,080.83 -36,509.08 4.42 4.42 4.67 4.43 4.42 4.67 64.96 41.68 0.00 0.00 0.00 0.00 18.00 -18.00 2,783.17 -9.00 0.00 -2,083.08 -38,592.17 4.36 4.36 4.61 4.37 4.36 4.61 65.53 42.03 0.00 0.00 0.00 0.00 27.00 -27.00 3,333.17 -13.50 0.00 -2,568.83 -41,161.00 4.27 4.27 4.52 4.29 4.27 4.52 65.96 42.29 0.00 0.00 0.00 0.00 31.50 -31.50 12,573.17 -15.75 0.00 -10,656.08 -51,817.08 4.30 4.30 4.55 4.31 4.30 4.55 66.32 42.51 835.18 477.77 397.84 1,710.78 104.48 1,606.31 6,513.17 803.15 0.00 -4,534.68 -56,351.76 4.36 4.36 4.61 4.37 4.36 4.61 66.64 42.70 1,024.29 569.60 444.74 2,038.63 123.63 1,915.00 6,363.17 957.50 0.00 -4,249.09 -60,600.85 4.43 4.43 4.68 4.44 4.43 4.68 66.94 42.89 1,124.91 622.75 501.04 2,248.71 137.68 2,111.03 5,813.17 1,055.51 0.00 -3,669.82 -64,270.67 4.49 4.49 4.74 4.49 4.49 4.74 67.18 43.03 1,227.51 675.85 557.70 2,461.06 151.73 2,309.33 6,513.17 1,154.67 0.00 -4,183.17 -68,453.84 2010 Date Realized Prices Marshall Gas ($/Mcf) Wetzel Gas ($/Mcf) Clearfield Gas ($/Mcf) Fayette Gas ($/Mcf) Butler Gas ($/Mcf) Dry Gas ($/Mcf) Oil ($/bbl) NGL ($/bbl) Total Gas Revenues Total Oil Revenues Total NGL Revenues Total Revenues Total Operating Expenses Operating Cash Flow Total Capital Expenditures Apple Operating Cash Flow Apple Upfront Payment Apple Net Free Cash Flow Apple Cumulative Cash Flow (I 2011 2012 2013 2014 2015 2016 2017 2018 2019 2020 2021 3.92 3.92 4.17 3.95 3.92 4.17 62.43 40.14 0.00 0.00 0.00 0.00 9.00 -9.00 2,870.00 -4.50 -30,000.00 4.52 4.52 4.77 4.53 4.52 4.77 66.57 42.66 10,933.18 5,728.46 4,664.01 21,325.65 1,394.06 19,931.59 71,728.00 9,965.80 0.00 5.20 5.20 5.45 5.17 5.20 5.45 69.10 44.20 39,887.79 18,836.67 16,299.40 75,023.86 5,660.16 69,363.69 120,390.00 34,681.85 0.00 5.53 5.53 5.78 5.48 5.53 5.78 70.47 45.03 70,172.67 29,912.94 28,201.96 128,287.57 9,636.05 118,651.52 127,096.00 59,325.76 0.00 5.67 5.67 5.92 5.62 5.67 5.92 71.55 45.69 105,724.22 34,245.22 42,995.78 182,965.22 13,507.32 169,457.89 157,170.00 84,728.95 0.00 5.85 5.85 6.10 5.79 5.85 6.10 72.85 46.49 149,338.52 32,221.11 51,561.92 233,121.55 16,720.98 216,400.57 157,170.00 108,200.28 0.00 6.23 6.23 6.48 6.15 6.23 6.48 73.52 46.89 221,403.79 26,904.61 45,090.75 293,399.15 21,233.37 272,165.78 228,180.00 136,082.89 0.00 6.23 6.23 6.48 6.15 6.23 6.48 73.52 46.89 296,186.83 20,435.19 34,374.88 350,996.90 26,865.44 324,131.45 247,420.00 162,065.73 0.00 6.23 6.23 6.48 6.15 6.23 6.48 73.52 46.89 319,648.14 17,352.18 28,797.19 365,797.51 29,494.09 336,303.42 156,560.00 168,151.71 0.00 6.23 6.23 6.48 6.15 6.23 6.48 73.52 46.89 267,964.43 15,551.48 25,310.29 308,826.19 27,159.61 281,666.59 23,180.00 140,833.29 0.00 6.23 6.23 6.48 6.15 6.23 6.48 73.52 46.89 215,170.64 14,340.22 22,825.86 252,336.71 24,121.08 228,215.63 5,000.00 114,107.82 0.00 6.23 6.23 6.48 6.15 6.23 6.48 73.52 46.89 185,991.17 12,747.60 20,929.22 219,667.98 22,525.56 197,142.42 5,000.00 98,571.21 0.00 Yearly Projections (Summary) Realized Prices Marshall Gas ($/Mcf) Wetzel Gas ($/Mcf) Clearfield Gas ($/Mcf) Fayette Gas ($/Mcf) Butler Gas ($/Mcf) Dry Gas ($/Mcf) Oil ($/bbl) NGL ($/bbl) Total Gas Revenues Total Oil Revenues Total NGL Revenues Total Revenues Total Operating Expenses Operating Cash Flow Total Capital Expenditures Apple Operating Cash Flow Apple Upfront Payment
  • 27. Monthly Projections (Summ 2011 Sep-11 2011 Oct-11 2011 Nov-11 2011 Dec-11 2012 Jan-12 2012 Feb-12 2012 M ar-12 4.52 4.52 4.77 4.52 4.52 4.77 67.40 43.16 1,432.33 767.94 612.79 2,813.06 171.81 2,641.26 6,363.17 1,320.63 0.00 -3,885.96 -72,339.79 4.61 4.61 4.86 4.61 4.61 4.86 67.62 43.30 1,538.43 813.66 665.91 3,017.99 185.75 2,832.24 5,813.17 1,416.12 0.00 -3,309.21 -75,649.00 4.88 4.88 5.13 4.87 4.88 5.13 67.86 43.44 1,710.70 858.30 717.20 3,286.20 202.31 3,083.89 6,513.17 1,541.95 0.00 -3,795.89 -79,444.89 5.22 5.22 5.47 5.19 5.22 5.47 68.11 43.60 2,039.83 942.58 766.80 3,749.21 226.67 3,522.54 6,363.17 1,761.27 0.00 -3,445.31 -82,890.20 5.42 5.42 5.67 5.38 5.42 5.67 68.27 43.69 2,191.01 979.26 813.54 3,983.81 294.65 3,689.16 4,060.83 1,844.58 0.00 -1,550.84 -84,441.04 5.38 5.38 5.63 5.35 5.38 5.63 68.42 43.79 1,942.08 864.61 722.02 3,528.70 278.76 3,249.94 4,060.83 1,624.97 0.00 -1,770.45 -86,211.49 5.25 5.25 5.50 5.22 5.25 5.50 68.58 43.88 1,731.22 780.62 658.69 3,170.53 272.99 2,897.53 4,610.83 1,448.77 0.00 -2,427.90 -88,639.39 4.93 4.93 5.18 4.92 4.93 5.18 68.73 43.98 1,510.12 715.13 610.49 2,835.74 264.15 2,571.59 22,940.83 1,285.80 0.00 -18,629.62 -107,269.01 4.94 4.94 5.19 4.93 4.94 5.19 68.89 44.07 3,217.14 1,613.33 1,396.85 6,227.32 457.82 5,769.50 10,820.83 2,884.75 0.00 -6,326.92 -113,595.92 4.98 4.98 5.23 4.96 4.98 5.23 69.04 44.16 3,459.10 1,719.31 1,459.91 6,638.32 489.80 6,148.52 10,670.83 3,074.26 0.00 -2,261.15 -115,857.08 2022 Date Realized Prices Marshall Gas ($/Mcf) Wetzel Gas ($/Mcf) Clearfield Gas ($/Mcf) Fayette Gas ($/Mcf) Butler Gas ($/Mcf) Dry Gas ($/Mcf) Oil ($/bbl) NGL ($/bbl) Total Gas Revenues Total Oil Revenues Total NGL Revenues Total Revenues Total Operating Expenses Operating Cash Flow Total Capital Expenditures Apple Operating Cash Flow Apple Upfront Payment Apple Net Free Cash Flow Apple Cumulative Cash Flow (I 2012 2023 2024 2025 2026 2027 2028 2029 2030 2031 6.23 6.23 6.48 6.15 6.23 6.48 73.52 46.89 164,558.27 10,979.96 19,407.17 194,945.41 21,368.17 173,577.24 5,000.00 86,788.62 0.00 6.23 6.23 6.48 6.15 6.23 6.48 73.52 46.89 149,212.06 9,724.25 18,130.21 177,066.52 20,527.48 156,539.04 5,000.00 78,269.52 0.00 6.23 6.23 6.48 6.15 6.23 6.48 73.52 46.89 137,314.87 8,713.59 17,020.28 163,048.74 19,873.63 143,175.10 5,000.00 71,587.55 0.00 6.23 6.23 6.48 6.15 6.23 6.48 73.52 46.89 127,663.59 7,858.96 16,035.13 151,557.68 19,334.43 132,223.25 5,000.00 66,111.62 0.00 6.23 6.23 6.48 6.15 6.23 6.48 73.52 46.89 119,578.81 7,122.75 15,143.32 141,844.88 18,877.18 122,967.70 5,000.00 61,483.85 0.00 6.23 6.23 6.48 6.15 6.23 6.48 73.52 46.89 112,608.83 6,477.06 14,315.24 133,401.13 18,479.35 114,921.78 5,000.00 57,460.89 0.00 6.23 6.23 6.48 6.15 6.23 6.48 73.52 46.89 106,429.19 5,902.90 13,535.02 125,867.12 18,124.31 107,742.80 5,000.00 53,871.40 0.00 6.23 6.23 6.48 6.15 6.23 6.48 73.52 46.89 100,793.80 5,386.65 12,797.68 118,978.13 17,799.58 101,178.55 5,000.00 50,589.28 0.00 6.23 6.23 6.48 6.15 6.23 6.48 73.52 46.89 95,537.53 4,923.67 12,101.02 112,562.22 17,496.93 95,065.29 5,000.00 47,532.64 0.00 6.23 6.23 6.48 6.15 6.23 6.48 73.52 46.89 53,424.12 2,678.92 6,752.50 62,855.54 10,074.17 52,781.37 3,750.00 26,390.68 0.00 Apr-12 2012 M ay-12 2012 Jun-12 Yearly Projections (Summa Realized Prices Marshall Gas ($/Mcf) Wetzel Gas ($/Mcf) Clearfield Gas ($/Mcf) Fayette Gas ($/Mcf) Butler Gas ($/Mcf) Dry Gas ($/Mcf) Oil ($/bbl) NGL ($/bbl) Total Gas Revenues Total Oil Revenues Total NGL Revenues Total Revenues Total Operating Expenses Operating Cash Flow Total Capital Expenditures Apple Operating Cash Flow Apple Upfront Payment
  • 28. Monthly Projections (Summ 2012 Date Realized Prices Marshall Gas ($/Mcf) Wetzel Gas ($/Mcf) Clearfield Gas ($/Mcf) Fayette Gas ($/Mcf) Butler Gas ($/Mcf) Dry Gas ($/Mcf) Oil ($/bbl) NGL ($/bbl) Total Gas Revenues Total Oil Revenues Total NGL Revenues Total Revenues Total Operating Expenses Operating Cash Flow Total Capital Expenditures Apple Operating Cash Flow Apple Upfront Payment Apple Net Free Cash Flow Apple Cumulative Cash Flow (I Yearly Projections (Summa Realized Prices Marshall Gas ($/Mcf) Wetzel Gas ($/Mcf) Clearfield Gas ($/Mcf) Fayette Gas ($/Mcf) Butler Gas ($/Mcf) Dry Gas ($/Mcf) Oil ($/bbl) NGL ($/bbl) Total Gas Revenues Total Oil Revenues Total NGL Revenues Total Revenues Total Operating Expenses Operating Cash Flow Total Capital Expenditures Apple Operating Cash Flow Apple Upfront Payment 2012 Aug-12 2013 Jul-12 Sep-12 2012 Oct-12 2012 Nov-12 2012 Dec-12 2012 Jan-13 2013 Feb-13 2013 M ar-13 5.03 5.03 5.28 5.01 5.03 5.28 69.18 44.25 3,636.25 1,796.09 1,546.98 6,979.32 517.38 6,461.94 10,120.83 3,230.97 0.00 -1,829.45 -117,686.53 5.08 5.08 5.33 5.05 5.08 5.33 69.33 44.34 3,824.60 1,877.32 1,638.96 7,340.89 546.37 6,794.52 10,820.83 3,397.26 0.00 -2,013.16 -119,699.69 5.09 5.09 5.34 5.07 5.09 5.34 69.47 44.43 4,120.07 2,000.47 1,730.64 7,851.18 583.20 7,267.98 10,670.83 3,633.99 0.00 -1,701.43 -121,401.11 5.18 5.18 5.43 5.15 5.18 5.43 69.62 44.52 4,338.19 2,075.93 1,820.39 8,234.51 612.58 7,621.93 10,120.83 3,810.97 0.00 -1,249.45 -122,650.56 5.42 5.42 5.67 5.38 5.42 5.67 69.77 44.61 4,690.23 2,150.20 1,907.93 8,748.36 648.14 8,100.23 10,820.83 4,050.11 0.00 -1,360.30 -124,010.87 5.69 5.69 5.94 5.64 5.69 5.94 69.92 44.70 5,227.78 2,264.40 1,992.99 9,485.17 694.32 8,790.86 10,670.83 4,395.43 0.00 -939.99 -124,950.86 5.87 5.87 6.12 5.81 5.87 6.12 69.99 44.74 5,539.49 2,327.90 2,073.24 9,940.63 721.25 9,219.38 2,799.67 4,609.69 0.00 3,209.86 -121,741.00 5.82 5.82 6.07 5.76 5.82 6.07 70.06 44.78 4,975.51 2,081.49 1,871.63 8,928.63 673.97 8,254.66 4,619.67 4,127.33 0.00 1,817.50 -119,923.50 5.66 5.66 5.91 5.61 5.66 5.91 70.14 44.83 4,480.57 1,898.75 1,729.14 8,108.45 642.38 7,466.08 5,169.67 3,733.04 0.00 1,148.21 -118,775.30
  • 29. Monthly Projections (Summ 2013 Date Realized Prices Marshall Gas ($/Mcf) Wetzel Gas ($/Mcf) Clearfield Gas ($/Mcf) Fayette Gas ($/Mcf) Butler Gas ($/Mcf) Dry Gas ($/Mcf) Oil ($/bbl) NGL ($/bbl) Total Gas Revenues Total Oil Revenues Total NGL Revenues Total Revenues Total Operating Expenses Operating Cash Flow Total Capital Expenditures Apple Operating Cash Flow Apple Upfront Payment Apple Net Free Cash Flow Apple Cumulative Cash Flow (I Yearly Projections (Summa Realized Prices Marshall Gas ($/Mcf) Wetzel Gas ($/Mcf) Clearfield Gas ($/Mcf) Fayette Gas ($/Mcf) Butler Gas ($/Mcf) Dry Gas ($/Mcf) Oil ($/bbl) NGL ($/bbl) Total Gas Revenues Total Oil Revenues Total NGL Revenues Total Revenues Total Operating Expenses Operating Cash Flow Total Capital Expenditures Apple Operating Cash Flow Apple Upfront Payment Apr-13 5.27 5.27 5.52 5.24 5.27 5.52 70.22 44.88 3,910.19 1,755.19 1,619.07 7,284.46 606.79 6,677.66 26,529.67 3,338.83 0.00 -9,926.00 -128,701.30 2013 M ay-13 5.26 5.26 5.51 5.23 5.26 5.51 70.31 44.93 5,903.33 2,763.26 2,510.91 11,177.49 821.95 10,355.55 9,559.67 5,177.77 0.00 397.94 -128,303.36 Jun-13 2013 Jul-13 2013 2013 Aug-13 Sep-13 2013 Oct-13 2013 Nov-13 2013 Dec-13 2013 5.29 5.29 5.54 5.26 5.29 5.54 70.40 44.99 6,123.06 2,702.69 2,557.16 11,382.91 839.26 10,543.65 13,049.67 5,271.83 0.00 -1,253.01 -129,556.37 5.33 5.33 5.58 5.30 5.33 5.58 70.49 45.05 6,126.56 2,726.60 2,558.05 11,411.21 845.52 10,565.69 5,829.67 5,282.85 0.00 2,368.01 -127,188.36 5.38 5.38 5.63 5.34 5.38 5.63 70.59 45.11 5,914.21 2,608.39 2,457.32 10,979.92 830.10 10,149.82 14,409.67 5,074.91 0.00 -2,129.92 -129,318.28 5.40 5.40 5.65 5.36 5.40 5.65 70.70 45.17 6,641.42 2,800.64 2,736.76 12,178.83 897.80 11,281.03 8,199.67 5,640.52 0.00 1,540.68 -127,777.60 5.48 5.48 5.73 5.44 5.48 5.73 70.80 45.23 6,399.66 2,686.78 2,605.03 11,691.46 879.77 10,811.69 10,679.67 5,405.85 0.00 66.01 -127,711.59 5.67 5.67 5.92 5.62 5.67 5.92 70.91 45.30 6,750.17 2,766.32 2,679.04 12,195.54 910.20 11,285.33 9,559.67 5,642.67 0.00 862.83 -126,848.75 5.89 5.89 6.14 5.83 5.89 6.14 71.02 45.37 7,408.51 2,794.92 2,804.62 13,008.04 967.07 12,040.97 16,689.67 6,020.49 0.00 -2,324.35 -129,173.10
  • 30. Monthly Projections (Summ 2014 Date Realized Prices Marshall Gas ($/Mcf) Wetzel Gas ($/Mcf) Clearfield Gas ($/Mcf) Fayette Gas ($/Mcf) Butler Gas ($/Mcf) Dry Gas ($/Mcf) Oil ($/bbl) NGL ($/bbl) Total Gas Revenues Total Oil Revenues Total NGL Revenues Total Revenues Total Operating Expenses Operating Cash Flow Total Capital Expenditures Apple Operating Cash Flow Apple Upfront Payment Apple Net Free Cash Flow Apple Cumulative Cash Flow (I Yearly Projections (Summa Realized Prices Marshall Gas ($/Mcf) Wetzel Gas ($/Mcf) Clearfield Gas ($/Mcf) Fayette Gas ($/Mcf) Butler Gas ($/Mcf) Dry Gas ($/Mcf) Oil ($/bbl) NGL ($/bbl) Total Gas Revenues Total Oil Revenues Total NGL Revenues Total Revenues Total Operating Expenses Operating Cash Flow Total Capital Expenditures Apple Operating Cash Flow Apple Upfront Payment 2014 Jan-14 Feb-14 6.06 6.06 6.31 5.99 6.06 6.31 71.09 45.41 7,639.14 2,864.43 2,836.20 13,339.76 993.73 12,346.03 3,640.00 6,173.02 0.00 4,353.02 -124,820.08 6.00 6.00 6.25 5.94 6.00 6.25 71.16 45.45 6,975.87 2,613.44 2,606.12 12,195.43 945.33 11,250.09 5,460.00 5,625.05 0.00 2,895.05 -121,925.04 2014 M ar-14 5.82 5.82 6.07 5.76 5.82 6.07 71.23 45.50 6,336.33 2,423.83 2,442.13 11,202.28 905.52 10,296.76 4,190.00 5,148.38 0.00 3,053.38 -118,871.66 2014 Apr-14 5.41 5.41 5.66 5.37 5.41 5.66 71.31 45.55 5,580.29 2,272.00 2,313.57 10,165.86 864.26 9,301.60 39,490.00 4,650.80 0.00 -15,094.20 -133,965.86 2014 M ay-14 5.40 5.40 5.65 5.36 5.40 5.65 71.39 45.60 9,661.18 3,338.81 4,168.99 17,168.99 1,211.49 15,957.50 10,400.00 7,978.75 0.00 2,778.75 -131,187.11 Jun-14 2014 Jul-14 2014 2014 Aug-14 Sep-14 2014 5.42 5.42 5.67 5.38 5.42 5.67 71.48 45.65 9,212.98 3,146.64 3,898.52 16,258.14 1,176.25 15,081.88 15,100.00 7,540.94 0.00 -9.06 -131,196.17 5.47 5.47 5.72 5.42 5.47 5.72 71.57 45.71 9,512.94 3,070.39 4,028.57 16,611.90 1,193.34 15,418.56 9,700.00 7,709.28 0.00 2,859.28 -128,336.88 5.51 5.51 5.76 5.46 5.51 5.76 71.67 45.76 9,370.75 2,943.66 3,952.59 16,267.01 1,185.66 15,081.35 15,250.00 7,540.68 0.00 -84.32 -128,421.21 5.53 5.53 5.78 5.48 5.53 5.78 71.77 45.82 9,904.83 2,970.46 4,139.83 17,015.12 1,224.83 15,790.29 10,250.00 7,895.14 0.00 2,770.14 -125,651.06
  • 31. Monthly Projections (Summ 2014 Date Realized Prices Marshall Gas ($/Mcf) Wetzel Gas ($/Mcf) Clearfield Gas ($/Mcf) Fayette Gas ($/Mcf) Butler Gas ($/Mcf) Dry Gas ($/Mcf) Oil ($/bbl) NGL ($/bbl) Total Gas Revenues Total Oil Revenues Total NGL Revenues Total Revenues Total Operating Expenses Operating Cash Flow Total Capital Expenditures Apple Operating Cash Flow Apple Upfront Payment Apple Net Free Cash Flow Apple Cumulative Cash Flow (I Yearly Projections (Summa Realized Prices Marshall Gas ($/Mcf) Wetzel Gas ($/Mcf) Clearfield Gas ($/Mcf) Fayette Gas ($/Mcf) Butler Gas ($/Mcf) Dry Gas ($/Mcf) Oil ($/bbl) NGL ($/bbl) Total Gas Revenues Total Oil Revenues Total NGL Revenues Total Revenues Total Operating Expenses Operating Cash Flow Total Capital Expenditures Apple Operating Cash Flow Apple Upfront Payment 2014 2014 2015 2015 Oct-14 Nov-14 Dec-14 Jan-15 Feb-15 5.61 5.61 5.86 5.56 5.61 5.86 71.88 45.89 9,880.65 2,875.54 4,086.90 16,843.08 1,225.07 15,618.01 14,550.00 7,809.01 0.00 534.01 -125,117.06 5.81 5.81 6.06 5.75 5.81 6.06 72.00 45.96 10,634.15 2,879.51 4,285.40 17,799.06 1,274.27 16,524.79 10,400.00 8,262.39 0.00 3,062.39 -122,054.67 6.03 6.03 6.28 5.96 6.03 6.28 72.12 46.04 11,015.11 2,846.52 4,236.96 18,098.59 1,307.56 16,791.03 18,740.00 8,395.52 0.00 -974.48 -123,029.15 6.21 6.21 6.46 6.13 6.21 6.46 72.23 46.10 11,758.33 2,860.54 4,437.04 19,055.91 1,355.28 17,700.63 3,640.00 8,850.32 0.00 7,030.32 -115,998.83 6.16 6.16 6.41 6.08 6.16 6.41 72.34 46.17 10,515.89 2,639.98 3,985.19 17,141.06 1,272.53 15,868.54 3,640.00 7,934.27 0.00 6,114.27 -109,884.57 2015 M ar-15 5.98 5.98 6.23 5.91 5.98 6.23 72.45 46.24 9,509.22 2,477.23 3,711.21 15,697.66 1,219.29 14,478.36 6,010.00 7,239.18 0.00 4,234.18 -105,650.38 2015 Apr-15 5.59 5.59 5.84 5.54 5.59 5.84 72.56 46.31 8,405.44 2,346.85 3,508.84 14,261.12 1,157.29 13,103.84 37,670.00 6,551.92 0.00 -12,283.08 -117,933.47 2015 M ay-15 5.57 5.57 5.82 5.52 5.57 5.82 72.67 46.37 13,185.93 2,971.57 5,074.66 21,232.16 1,467.13 19,765.03 13,430.00 9,882.52 0.00 3,167.52 -114,765.95 2015 Jun-15 5.60 5.60 5.85 5.55 5.60 5.85 72.78 46.44 13,052.67 2,898.58 4,712.37 20,663.62 1,445.63 19,217.99 13,890.00 9,608.99 0.00 2,663.99 -112,101.96
  • 32. Monthly Projections (Summ 2015 Date Realized Prices Marshall Gas ($/Mcf) Wetzel Gas ($/Mcf) Clearfield Gas ($/Mcf) Fayette Gas ($/Mcf) Butler Gas ($/Mcf) Dry Gas ($/Mcf) Oil ($/bbl) NGL ($/bbl) Total Gas Revenues Total Oil Revenues Total NGL Revenues Total Revenues Total Operating Expenses Operating Cash Flow Total Capital Expenditures Apple Operating Cash Flow Apple Upfront Payment Apple Net Free Cash Flow Apple Cumulative Cash Flow (I Yearly Projections (Summa Realized Prices Marshall Gas ($/Mcf) Wetzel Gas ($/Mcf) Clearfield Gas ($/Mcf) Fayette Gas ($/Mcf) Butler Gas ($/Mcf) Dry Gas ($/Mcf) Oil ($/bbl) NGL ($/bbl) Total Gas Revenues Total Oil Revenues Total NGL Revenues Total Revenues Total Operating Expenses Operating Cash Flow Total Capital Expenditures Apple Operating Cash Flow Apple Upfront Payment 2015 Aug-15 2015 Jul-15 Sep-15 2015 Oct-15 2015 Nov-15 2015 Dec-15 2016 Jan-16 2016 Feb-16 2016 M ar-16 2016 Apr-16 5.65 5.65 5.90 5.60 5.65 5.90 72.90 46.51 12,777.75 2,752.15 4,441.62 19,971.53 1,416.25 18,555.28 9,700.00 9,277.64 0.00 4,427.64 -107,674.32 5.70 5.70 5.95 5.65 5.70 5.95 73.02 46.59 12,753.16 2,647.14 4,279.78 19,680.07 1,407.23 18,272.84 16,460.00 9,136.42 0.00 906.42 -106,767.90 5.73 5.73 5.98 5.67 5.73 5.98 73.14 46.66 13,904.88 2,765.47 4,528.91 21,199.26 1,477.07 19,722.18 12,070.00 9,861.09 0.00 3,826.09 -102,941.81 5.81 5.81 6.06 5.75 5.81 6.06 73.26 46.74 13,828.68 2,656.35 4,341.63 20,826.66 1,465.65 19,361.01 9,700.00 9,680.50 0.00 4,830.50 -98,111.30 6.01 6.01 6.26 5.94 6.01 6.26 73.39 46.81 14,207.29 2,573.23 4,230.86 21,011.38 1,479.49 19,531.90 13,430.00 9,765.95 0.00 3,050.95 -95,060.35 6.23 6.23 6.48 6.15 6.23 6.48 73.52 46.89 15,439.29 2,632.02 4,309.80 22,381.11 1,558.15 20,822.97 17,530.00 10,411.48 0.00 1,646.48 -93,413.87 6.23 6.23 6.48 6.15 6.23 6.48 73.52 46.89 15,303.56 2,549.58 4,203.49 22,056.63 1,556.15 20,500.48 8,280.00 10,250.24 0.00 6,110.24 -87,303.63 6.23 6.23 6.48 6.15 6.23 6.48 73.52 46.89 14,169.74 2,402.50 3,971.75 20,543.99 1,504.54 19,039.45 6,460.00 9,519.73 0.00 6,289.73 -81,013.90 6.23 6.23 6.48 6.15 6.23 6.48 73.52 46.89 13,358.05 2,283.79 3,796.61 19,438.45 1,478.13 17,960.32 8,830.00 8,980.16 0.00 4,565.16 -76,448.74 6.23 6.23 6.48 6.15 6.23 6.48 73.52 46.89 12,716.33 2,183.43 3,652.85 18,552.61 1,450.68 17,101.93 50,610.00 8,550.96 0.00 -16,754.04 -93,202.78
  • 33. Monthly Projections (Summ Date Realized Prices Marshall Gas ($/Mcf) Wetzel Gas ($/Mcf) Clearfield Gas ($/Mcf) Fayette Gas ($/Mcf) Butler Gas ($/Mcf) Dry Gas ($/Mcf) Oil ($/bbl) NGL ($/bbl) Total Gas Revenues Total Oil Revenues Total NGL Revenues Total Revenues Total Operating Expenses Operating Cash Flow Total Capital Expenditures Apple Operating Cash Flow Apple Upfront Payment Apple Net Free Cash Flow Apple Cumulative Cash Flow (I Yearly Projections (Summa Realized Prices Marshall Gas ($/Mcf) Wetzel Gas ($/Mcf) Clearfield Gas ($/Mcf) Fayette Gas ($/Mcf) Butler Gas ($/Mcf) Dry Gas ($/Mcf) Oil ($/bbl) NGL ($/bbl) Total Gas Revenues Total Oil Revenues Total NGL Revenues Total Revenues Total Operating Expenses Operating Cash Flow Total Capital Expenditures Apple Operating Cash Flow Apple Upfront Payment 2016 M ay-16 2016 Jun-16 2016 Jul-16 2016 Aug-16 2016 Sep-16 2016 Oct-16 2016 Nov-16 2016 Dec-16 2017 Jan-17 2017 Feb-17 6.23 6.23 6.48 6.15 6.23 6.48 73.52 46.89 20,456.17 2,539.94 4,364.73 27,360.84 1,856.60 25,504.24 20,100.00 12,752.12 0.00 2,702.12 -90,500.66 6.23 6.23 6.48 6.15 6.23 6.48 73.52 46.89 20,218.55 2,410.19 4,031.04 26,659.77 1,854.60 24,805.18 16,920.00 12,402.59 0.00 3,942.59 -86,558.07 6.23 6.23 6.48 6.15 6.23 6.48 73.52 46.89 19,837.33 2,276.65 3,825.17 25,939.14 1,843.64 24,095.50 19,400.00 12,047.75 0.00 2,347.75 -84,210.32 6.23 6.23 6.48 6.15 6.23 6.48 73.52 46.89 20,262.52 2,170.21 3,670.26 26,102.99 1,871.89 24,231.10 18,280.00 12,115.55 0.00 2,975.55 -81,234.77 6.23 6.23 6.48 6.15 6.23 6.48 73.52 46.89 20,854.91 2,124.38 3,543.66 26,522.94 1,914.34 24,608.60 19,950.00 12,304.30 0.00 2,329.30 -78,905.47 6.23 6.23 6.48 6.15 6.23 6.48 73.52 46.89 21,254.15 2,042.91 3,435.45 26,732.51 1,940.91 24,791.60 14,550.00 12,395.80 0.00 5,120.80 -73,784.67 6.23 6.23 6.48 6.15 6.23 6.48 73.52 46.89 21,144.53 1,970.54 3,340.41 26,455.48 1,947.66 24,507.83 20,100.00 12,253.91 0.00 2,203.91 -71,580.76 6.23 6.23 6.48 6.15 6.23 6.48 73.52 46.89 21,827.96 1,950.50 3,255.33 27,033.80 2,014.24 25,019.56 24,700.00 12,509.78 0.00 159.78 -71,420.98 6.23 6.23 6.48 6.15 6.23 6.48 73.52 46.89 21,763.71 1,887.83 3,178.20 26,829.74 2,019.92 24,809.81 7,280.00 12,404.91 0.00 8,764.91 -62,656.07 6.23 6.23 6.48 6.15 6.23 6.48 73.52 46.89 20,182.60 1,831.91 3,107.52 25,122.04 1,953.41 23,168.63 7,280.00 11,584.31 0.00 7,944.31 -54,711.75
  • 34. Monthly Projections (Summ Date Realized Prices Marshall Gas ($/Mcf) Wetzel Gas ($/Mcf) Clearfield Gas ($/Mcf) Fayette Gas ($/Mcf) Butler Gas ($/Mcf) Dry Gas ($/Mcf) Oil ($/bbl) NGL ($/bbl) Total Gas Revenues Total Oil Revenues Total NGL Revenues Total Revenues Total Operating Expenses Operating Cash Flow Total Capital Expenditures Apple Operating Cash Flow Apple Upfront Payment Apple Net Free Cash Flow Apple Cumulative Cash Flow (I Yearly Projections (Summa Realized Prices Marshall Gas ($/Mcf) Wetzel Gas ($/Mcf) Clearfield Gas ($/Mcf) Fayette Gas ($/Mcf) Butler Gas ($/Mcf) Dry Gas ($/Mcf) Oil ($/bbl) NGL ($/bbl) Total Gas Revenues Total Oil Revenues Total NGL Revenues Total Revenues Total Operating Expenses Operating Cash Flow Total Capital Expenditures Apple Operating Cash Flow Apple Upfront Payment 2017 M ar-17 2017 Apr-17 2017 M ay-17 2017 Jun-17 2017 Jul-17 2017 Aug-17 2017 Sep-17 2017 Oct-17 2017 Nov-17 2017 Dec-17 6.23 6.23 6.48 6.15 6.23 6.48 73.52 46.89 19,046.08 1,780.62 3,042.28 23,868.97 1,914.19 21,954.78 7,830.00 10,977.39 0.00 7,062.39 -47,649.36 6.23 6.23 6.48 6.15 6.23 6.48 73.52 46.89 18,146.12 1,732.64 2,981.65 22,860.41 1,880.32 20,980.10 66,080.00 10,490.05 0.00 -22,549.95 -70,199.32 6.23 6.23 6.48 6.15 6.23 6.48 73.52 46.89 28,200.65 1,733.62 2,925.01 32,859.28 2,393.28 30,466.00 20,100.00 15,233.00 0.00 5,183.00 -65,016.32 6.23 6.23 6.48 6.15 6.23 6.48 73.52 46.89 27,140.10 1,732.27 2,871.88 31,744.24 2,354.79 29,389.46 19,950.00 14,694.73 0.00 4,719.73 -60,296.59 6.23 6.23 6.48 6.15 6.23 6.48 73.52 46.89 26,749.44 1,686.06 2,821.85 31,257.36 2,346.71 28,910.65 19,400.00 14,455.33 0.00 4,755.33 -55,541.26 6.23 6.23 6.48 6.15 6.23 6.48 73.52 46.89 26,653.23 1,643.82 2,774.57 31,071.62 2,355.33 28,716.29 20,100.00 14,358.15 0.00 4,308.15 -51,233.12 6.23 6.23 6.48 6.15 6.23 6.48 73.52 46.89 26,844.33 1,648.69 2,729.80 31,222.82 2,380.23 28,842.59 19,950.00 14,421.30 0.00 4,446.30 -46,786.82 6.23 6.23 6.48 6.15 6.23 6.48 73.52 46.89 26,945.44 1,608.11 2,687.25 31,240.80 2,397.53 28,843.27 19,400.00 14,421.64 0.00 4,721.64 -42,065.18 6.23 6.23 6.48 6.15 6.23 6.48 73.52 46.89 27,093.65 1,570.48 2,646.77 31,310.90 2,419.14 28,891.76 20,100.00 14,445.88 0.00 4,395.88 -37,669.30 6.23 6.23 6.48 6.15 6.23 6.48 73.52 46.89 27,421.47 1,579.12 2,608.11 31,608.70 2,450.60 29,158.10 19,950.00 14,579.05 0.00 4,604.05 -33,065.25
  • 35. Monthly Projections (Summ Date Realized Prices Marshall Gas ($/Mcf) Wetzel Gas ($/Mcf) Clearfield Gas ($/Mcf) Fayette Gas ($/Mcf) Butler Gas ($/Mcf) Dry Gas ($/Mcf) Oil ($/bbl) NGL ($/bbl) Total Gas Revenues Total Oil Revenues Total NGL Revenues Total Revenues Total Operating Expenses Operating Cash Flow Total Capital Expenditures Apple Operating Cash Flow Apple Upfront Payment Apple Net Free Cash Flow Apple Cumulative Cash Flow (I Yearly Projections (Summa Realized Prices Marshall Gas ($/Mcf) Wetzel Gas ($/Mcf) Clearfield Gas ($/Mcf) Fayette Gas ($/Mcf) Butler Gas ($/Mcf) Dry Gas ($/Mcf) Oil ($/bbl) NGL ($/bbl) Total Gas Revenues Total Oil Revenues Total NGL Revenues Total Revenues Total Operating Expenses Operating Cash Flow Total Capital Expenditures Apple Operating Cash Flow Apple Upfront Payment 2018 Jan-18 2018 Feb-18 2018 M ar-18 2018 Apr-18 2018 M ay-18 2018 Jun-18 2018 Jul-18 2018 Aug-18 2018 Sep-18 2018 Oct-18 2018 Nov-18 6.23 6.23 6.48 6.15 6.23 6.48 73.52 46.89 27,604.80 1,542.61 2,571.21 31,718.63 2,459.78 29,258.85 3,640.00 14,629.42 0.00 12,809.42 -20,255.83 6.23 6.23 6.48 6.15 6.23 6.48 73.52 46.89 25,667.03 1,508.39 2,535.86 29,711.28 2,366.83 27,344.44 3,640.00 13,672.22 0.00 11,852.22 -8,403.60 6.23 6.23 6.48 6.15 6.23 6.48 73.52 46.89 24,301.70 1,476.89 2,501.97 28,280.57 2,312.00 25,968.56 6,010.00 12,984.28 0.00 9,979.28 1,575.68 6.23 6.23 6.48 6.15 6.23 6.48 73.52 46.89 23,224.61 1,446.62 2,469.41 27,140.65 2,261.00 24,879.65 40,700.00 12,439.82 0.00 -7,910.18 -6,334.50 6.23 6.23 6.48 6.15 6.23 6.48 73.52 46.89 28,889.94 1,462.86 2,438.14 32,790.93 2,553.34 30,237.60 13,430.00 15,118.80 0.00 8,403.80 2,069.30 6.23 6.23 6.48 6.15 6.23 6.48 73.52 46.89 28,174.76 1,475.91 2,408.02 32,058.69 2,534.01 29,524.68 13,890.00 14,762.34 0.00 7,817.34 9,886.64 6.23 6.23 6.48 6.15 6.23 6.48 73.52 46.89 27,279.33 1,442.82 2,379.02 31,101.17 2,494.52 28,606.66 9,700.00 14,303.33 0.00 9,453.33 19,339.97 6.23 6.23 6.48 6.15 6.23 6.48 73.52 46.89 26,707.56 1,412.66 2,351.00 30,471.22 2,472.01 27,999.21 16,460.00 13,999.60 0.00 5,769.60 25,109.57 6.23 6.23 6.48 6.15 6.23 6.48 73.52 46.89 27,514.11 1,428.51 2,323.99 31,266.61 2,528.48 28,738.13 12,070.00 14,369.06 0.00 8,334.06 33,443.64 6.23 6.23 6.48 6.15 6.23 6.48 73.52 46.89 26,903.00 1,397.99 2,297.85 30,598.83 2,501.97 28,096.87 9,700.00 14,048.43 0.00 9,198.43 42,642.07 6.23 6.23 6.48 6.15 6.23 6.48 73.52 46.89 26,499.65 1,369.81 2,272.59 30,142.05 2,487.65 27,654.41 13,430.00 13,827.20 0.00 7,112.20 49,754.28
  • 36. Monthly Projections (Summ Date Realized Prices Marshall Gas ($/Mcf) Wetzel Gas ($/Mcf) Clearfield Gas ($/Mcf) Fayette Gas ($/Mcf) Butler Gas ($/Mcf) Dry Gas ($/Mcf) Oil ($/bbl) NGL ($/bbl) Total Gas Revenues Total Oil Revenues Total NGL Revenues Total Revenues Total Operating Expenses Operating Cash Flow Total Capital Expenditures Apple Operating Cash Flow Apple Upfront Payment Apple Net Free Cash Flow Apple Cumulative Cash Flow (I Yearly Projections (Summa Realized Prices Marshall Gas ($/Mcf) Wetzel Gas ($/Mcf) Clearfield Gas ($/Mcf) Fayette Gas ($/Mcf) Butler Gas ($/Mcf) Dry Gas ($/Mcf) Oil ($/bbl) NGL ($/bbl) Total Gas Revenues Total Oil Revenues Total NGL Revenues Total Revenues Total Operating Expenses Operating Cash Flow Total Capital Expenditures Apple Operating Cash Flow Apple Upfront Payment 2018 Dec-18 2019 Jan-19 2019 Feb-19 2019 M ar-19 2019 Apr-19 2019 M ay-19 2019 Jun-19 2019 Jul-19 2019 Aug-19 2019 Sep-19 6.23 6.23 6.48 6.15 6.23 6.48 73.52 46.89 26,881.64 1,387.11 2,248.12 30,516.87 2,522.51 27,994.37 13,890.00 13,997.18 0.00 7,052.18 56,806.46 6.23 6.23 6.48 6.15 6.23 6.48 73.52 46.89 26,487.95 1,358.65 2,224.41 30,071.00 2,496.55 27,574.46 0.00 13,787.23 0.00 13,787.23 70,593.69 6.23 6.23 6.48 6.15 6.23 6.48 73.52 46.89 25,143.20 1,331.86 2,201.43 28,676.50 2,423.00 26,253.50 0.00 13,126.75 0.00 13,126.75 83,720.44 6.23 6.23 6.48 6.15 6.23 6.48 73.52 46.89 24,140.68 1,307.31 2,179.11 27,627.10 2,372.07 25,255.03 550.00 12,627.52 0.00 12,352.52 96,072.95 6.23 6.23 6.48 6.15 6.23 6.48 73.52 46.89 23,319.38 1,283.93 2,157.44 26,760.75 2,324.57 24,436.17 18,880.00 12,218.09 0.00 2,778.09 98,851.04 6.23 6.23 6.48 6.15 6.23 6.48 73.52 46.89 22,765.59 1,305.83 2,136.39 26,207.82 2,289.13 23,918.68 700.00 11,959.34 0.00 11,609.34 110,460.38 6.23 6.23 6.48 6.15 6.23 6.48 73.52 46.89 22,281.87 1,324.86 2,115.94 25,722.66 2,262.19 23,460.48 550.00 11,730.24 0.00 11,455.24 121,915.62 6.23 6.23 6.48 6.15 6.23 6.48 73.52 46.89 21,701.16 1,297.57 2,096.05 25,094.78 2,227.34 22,867.44 0.00 11,433.72 0.00 11,433.72 133,349.34 6.23 6.23 6.48 6.15 6.23 6.48 73.52 46.89 21,176.73 1,272.47 2,076.66 24,525.86 2,197.32 22,328.54 700.00 11,164.27 0.00 10,814.27 144,163.61 6.23 6.23 6.48 6.15 6.23 6.48 73.52 46.89 20,848.05 1,293.19 2,057.81 24,199.06 2,178.48 22,020.58 550.00 11,010.29 0.00 10,735.29 154,898.90
  • 37. Monthly Projections (Summ Date Realized Prices Marshall Gas ($/Mcf) Wetzel Gas ($/Mcf) Clearfield Gas ($/Mcf) Fayette Gas ($/Mcf) Butler Gas ($/Mcf) Dry Gas ($/Mcf) Oil ($/bbl) NGL ($/bbl) Total Gas Revenues Total Oil Revenues Total NGL Revenues Total Revenues Total Operating Expenses Operating Cash Flow Total Capital Expenditures Apple Operating Cash Flow Apple Upfront Payment Apple Net Free Cash Flow Apple Cumulative Cash Flow (I Yearly Projections (Summa Realized Prices Marshall Gas ($/Mcf) Wetzel Gas ($/Mcf) Clearfield Gas ($/Mcf) Fayette Gas ($/Mcf) Butler Gas ($/Mcf) Dry Gas ($/Mcf) Oil ($/bbl) NGL ($/bbl) Total Gas Revenues Total Oil Revenues Total NGL Revenues Total Revenues Total Operating Expenses Operating Cash Flow Total Capital Expenditures Apple Operating Cash Flow Apple Upfront Payment 2019 Oct-19 2019 Nov-19 2019 Dec-19 2020 Jan-20 2020 Feb-20 2020 M ar-20 2020 Apr-20 2020 M ay-20 2020 Jun-20 6.23 6.23 6.48 6.15 6.23 6.48 73.52 46.89 20,393.13 1,267.31 2,039.44 23,699.88 2,150.75 21,549.13 0.00 10,774.57 0.00 10,774.57 165,673.46 6.23 6.23 6.48 6.15 6.23 6.48 73.52 46.89 19,973.35 1,243.53 2,021.52 23,238.40 2,126.22 21,112.19 700.00 10,556.09 0.00 10,206.09 175,879.56 6.23 6.23 6.48 6.15 6.23 6.48 73.52 46.89 19,733.33 1,264.98 2,004.07 23,002.38 2,111.99 20,890.39 550.00 10,445.20 0.00 7,543.37 183,422.93 6.23 6.23 6.48 6.15 6.23 6.48 73.52 46.89 19,354.72 1,240.12 1,987.02 22,581.86 2,087.75 20,494.11 0.00 10,247.05 0.00 7,242.02 190,664.95 6.23 6.23 6.48 6.15 6.23 6.48 73.52 46.89 19,001.62 1,217.49 1,970.41 22,189.51 2,068.75 20,120.76 0.00 10,060.38 0.00 7,114.69 197,779.65 6.23 6.23 6.48 6.15 6.23 6.48 73.52 46.89 18,670.49 1,196.42 1,954.17 21,821.08 2,055.29 19,765.79 550.00 9,882.89 0.00 6,789.71 204,569.35 6.23 6.23 6.48 6.15 6.23 6.48 73.52 46.89 18,358.75 1,176.09 1,938.30 21,473.14 2,036.69 19,436.45 700.00 9,718.22 0.00 6,582.11 211,151.46 6.23 6.23 6.48 6.15 6.23 6.48 73.52 46.89 18,213.93 1,201.12 1,922.78 21,337.83 2,024.84 19,312.99 700.00 9,656.50 0.00 6,525.78 217,677.24 6.23 6.23 6.48 6.15 6.23 6.48 73.52 46.89 18,070.02 1,223.51 1,907.64 21,201.17 2,017.87 19,183.31 550.00 9,591.65 0.00 6,521.30 224,198.54
  • 38. Monthly Projections (Summ Date Realized Prices Marshall Gas ($/Mcf) Wetzel Gas ($/Mcf) Clearfield Gas ($/Mcf) Fayette Gas ($/Mcf) Butler Gas ($/Mcf) Dry Gas ($/Mcf) Oil ($/bbl) NGL ($/bbl) Total Gas Revenues Total Oil Revenues Total NGL Revenues Total Revenues Total Operating Expenses Operating Cash Flow Total Capital Expenditures Apple Operating Cash Flow Apple Upfront Payment Apple Net Free Cash Flow Apple Cumulative Cash Flow (I Yearly Projections (Summa Realized Prices Marshall Gas ($/Mcf) Wetzel Gas ($/Mcf) Clearfield Gas ($/Mcf) Fayette Gas ($/Mcf) Butler Gas ($/Mcf) Dry Gas ($/Mcf) Oil ($/bbl) NGL ($/bbl) Total Gas Revenues Total Oil Revenues Total NGL Revenues Total Revenues Total Operating Expenses Operating Cash Flow Total Capital Expenditures Apple Operating Cash Flow Apple Upfront Payment 2020 Jul-20 2020 Aug-20 2020 Sep-20 2020 Oct-20 2020 Nov-20 2020 Dec-20 2021 Jan-21 2021 Feb-21 2021 M ar-21 6.23 6.23 6.48 6.15 6.23 6.48 73.52 46.89 17,778.23 1,198.79 1,892.83 20,869.85 2,000.30 18,869.55 0.00 9,434.78 0.00 6,607.82 230,806.36 6.23 6.23 6.48 6.15 6.23 6.48 73.52 46.89 17,503.78 1,176.76 1,878.32 20,558.86 1,985.51 18,573.35 700.00 9,286.67 0.00 6,234.01 237,040.38 6.23 6.23 6.48 6.15 6.23 6.48 73.52 46.89 17,394.30 1,199.75 1,864.15 20,458.20 1,980.26 18,477.95 550.00 9,238.97 0.00 6,242.96 243,283.34 6.23 6.23 6.48 6.15 6.23 6.48 73.52 46.89 17,133.57 1,176.69 1,850.26 20,160.52 1,964.83 18,195.69 0.00 9,097.85 0.00 6,338.73 249,622.06 6.23 6.23 6.48 6.15 6.23 6.48 73.52 46.89 16,887.42 1,154.57 1,836.66 19,878.65 1,951.44 17,927.21 700.00 8,963.61 0.00 5,977.02 255,599.09 6.23 6.23 6.48 6.15 6.23 6.48 73.52 46.89 16,803.80 1,178.91 1,823.33 19,806.04 1,947.56 17,858.48 550.00 8,929.24 0.00 5,990.88 261,589.97 6.23 6.23 6.48 6.15 6.23 6.48 73.52 46.89 16,566.96 1,156.45 1,810.27 19,533.67 1,932.86 17,600.81 0.00 8,800.40 0.00 6,106.21 267,696.18 6.23 6.23 6.48 6.15 6.23 6.48 73.52 46.89 16,343.07 1,135.48 1,797.49 19,276.04 1,921.71 17,354.33 0.00 8,677.16 0.00 6,022.75 273,718.93 6.23 6.23 6.48 6.15 6.23 6.48 73.52 46.89 16,130.24 1,116.38 1,784.95 19,031.57 1,911.03 17,120.54 550.00 8,560.27 0.00 5,739.34 279,458.27
  • 39. Monthly Projections (Summ Date Realized Prices Marshall Gas ($/Mcf) Wetzel Gas ($/Mcf) Clearfield Gas ($/Mcf) Fayette Gas ($/Mcf) Butler Gas ($/Mcf) Dry Gas ($/Mcf) Oil ($/bbl) NGL ($/bbl) Total Gas Revenues Total Oil Revenues Total NGL Revenues Total Revenues Total Operating Expenses Operating Cash Flow Total Capital Expenditures Apple Operating Cash Flow Apple Upfront Payment Apple Net Free Cash Flow Apple Cumulative Cash Flow (I Yearly Projections (Summa Realized Prices Marshall Gas ($/Mcf) Wetzel Gas ($/Mcf) Clearfield Gas ($/Mcf) Fayette Gas ($/Mcf) Butler Gas ($/Mcf) Dry Gas ($/Mcf) Oil ($/bbl) NGL ($/bbl) Total Gas Revenues Total Oil Revenues Total NGL Revenues Total Revenues Total Operating Expenses Operating Cash Flow Total Capital Expenditures Apple Operating Cash Flow Apple Upfront Payment 2021 Apr-21 2021 M ay-21 2021 Jun-21 2021 Jul-21 2021 Aug-21 2021 Sep-21 2021 Oct-21 2021 Nov-21 2021 Dec-21 6.23 6.23 6.48 6.15 6.23 6.48 73.52 46.89 15,927.22 1,098.34 1,772.61 18,798.17 1,899.74 16,898.43 700.00 8,449.21 0.00 5,573.74 285,032.01 6.23 6.23 6.48 6.15 6.23 6.48 73.52 46.89 15,733.03 1,080.73 1,760.52 18,574.28 1,889.79 16,684.49 700.00 8,342.24 0.00 5,493.73 290,525.74 6.23 6.23 6.48 6.15 6.23 6.48 73.52 46.89 15,546.98 1,064.99 1,748.69 18,360.66 1,880.30 16,480.36 550.00 8,240.18 0.00 5,472.55 295,998.29 6.23 6.23 6.48 6.15 6.23 6.48 73.52 46.89 15,368.07 1,049.78 1,737.05 18,154.90 1,870.12 16,284.78 0.00 8,142.39 0.00 5,602.82 301,601.11 6.23 6.23 6.48 6.15 6.23 6.48 73.52 46.89 15,195.92 1,035.73 1,725.60 17,957.25 1,861.27 16,095.98 700.00 8,047.99 0.00 5,271.76 306,872.87 6.23 6.23 6.48 6.15 6.23 6.48 73.52 46.89 15,030.02 1,021.55 1,714.38 17,765.96 1,852.65 15,913.31 550.00 7,956.65 0.00 5,257.84 312,130.71 6.23 6.23 6.48 6.15 6.23 6.48 73.52 46.89 14,869.80 1,008.64 1,703.35 17,581.79 1,843.37 15,738.42 0.00 7,869.21 0.00 5,395.86 317,526.57 6.23 6.23 6.48 6.15 6.23 6.48 73.52 46.89 14,714.89 995.60 1,692.50 17,402.98 1,835.26 15,567.73 700.00 7,783.86 0.00 5,071.81 322,598.38 6.23 6.23 6.48 6.15 6.23 6.48 73.52 46.89 14,564.97 983.92 1,681.82 17,230.70 1,827.45 15,403.25 550.00 7,701.63 0.00 5,061.17 327,659.55
  • 40. Monthly Projections (Summ Date Realized Prices Marshall Gas ($/Mcf) Wetzel Gas ($/Mcf) Clearfield Gas ($/Mcf) Fayette Gas ($/Mcf) Butler Gas ($/Mcf) Dry Gas ($/Mcf) Oil ($/bbl) NGL ($/bbl) Total Gas Revenues Total Oil Revenues Total NGL Revenues Total Revenues Total Operating Expenses Operating Cash Flow Total Capital Expenditures Apple Operating Cash Flow Apple Upfront Payment Apple Net Free Cash Flow Apple Cumulative Cash Flow (I Yearly Projections (Summa Realized Prices Marshall Gas ($/Mcf) Wetzel Gas ($/Mcf) Clearfield Gas ($/Mcf) Fayette Gas ($/Mcf) Butler Gas ($/Mcf) Dry Gas ($/Mcf) Oil ($/bbl) NGL ($/bbl) Total Gas Revenues Total Oil Revenues Total NGL Revenues Total Revenues Total Operating Expenses Operating Cash Flow Total Capital Expenditures Apple Operating Cash Flow Apple Upfront Payment 2022 Jan-22 2022 Feb-22 2022 M ar-22 2022 Apr-22 2022 M ay-22 2022 Jun-22 2022 Jul-22 2022 Aug-22 2022 Sep-22 6.23 6.23 6.48 6.15 6.23 6.48 73.52 46.89 14,419.80 972.20 1,671.32 17,063.32 1,818.86 15,244.45 0.00 7,622.23 0.00 5,208.97 332,868.51 6.23 6.23 6.48 6.15 6.23 6.48 73.52 46.89 14,279.12 961.17 1,661.02 16,901.30 1,811.50 15,089.80 0.00 7,544.90 0.00 5,155.69 338,024.20 6.23 6.23 6.48 6.15 6.23 6.48 73.52 46.89 14,142.45 949.92 1,650.84 16,743.20 1,804.27 14,938.93 550.00 7,469.46 0.00 4,900.45 342,924.65 6.23 6.23 6.48 6.15 6.23 6.48 73.52 46.89 14,009.68 939.41 1,640.81 16,589.91 1,796.80 14,793.11 700.00 7,396.55 0.00 4,768.37 347,693.01 6.23 6.23 6.48 6.15 6.23 6.48 73.52 46.89 13,880.68 928.41 1,630.95 16,440.03 1,789.91 14,650.12 700.00 7,325.06 0.00 4,713.63 352,406.65 6.23 6.23 6.48 6.15 6.23 6.48 73.52 46.89 13,755.25 918.47 1,621.26 16,294.98 1,783.27 14,511.71 550.00 7,255.85 0.00 4,716.35 357,123.00 6.23 6.23 6.48 6.15 6.23 6.48 73.52 46.89 13,633.02 908.30 1,611.67 16,152.99 1,776.22 14,376.77 0.00 7,188.39 0.00 4,867.05 361,990.05 6.23 6.23 6.48 6.15 6.23 6.48 73.52 46.89 13,514.05 899.05 1,602.22 16,015.32 1,769.92 14,245.40 700.00 7,122.70 0.00 4,558.37 366,548.42 6.23 6.23 6.48 6.15 6.23 6.48 73.52 46.89 13,398.02 889.06 1,592.92 15,879.99 1,763.66 14,116.33 550.00 7,058.17 0.00 4,563.48 371,111.90
  • 41. Monthly Projections (Summ Date Realized Prices Marshall Gas ($/Mcf) Wetzel Gas ($/Mcf) Clearfield Gas ($/Mcf) Fayette Gas ($/Mcf) Butler Gas ($/Mcf) Dry Gas ($/Mcf) Oil ($/bbl) NGL ($/bbl) Total Gas Revenues Total Oil Revenues Total NGL Revenues Total Revenues Total Operating Expenses Operating Cash Flow Total Capital Expenditures Apple Operating Cash Flow Apple Upfront Payment Apple Net Free Cash Flow Apple Cumulative Cash Flow (I Yearly Projections (Summa Realized Prices Marshall Gas ($/Mcf) Wetzel Gas ($/Mcf) Clearfield Gas ($/Mcf) Fayette Gas ($/Mcf) Butler Gas ($/Mcf) Dry Gas ($/Mcf) Oil ($/bbl) NGL ($/bbl) Total Gas Revenues Total Oil Revenues Total NGL Revenues Total Revenues Total Operating Expenses Operating Cash Flow Total Capital Expenditures Apple Operating Cash Flow Apple Upfront Payment 2022 Oct-22 2022 Nov-22 2022 Dec-22 2023 Jan-23 2023 Feb-23 2023 M ar-23 2023 Apr-23 2023 M ay-23 2023 Jun-23 6.23 6.23 6.48 6.15 6.23 6.48 73.52 46.89 13,284.99 880.32 1,583.75 15,749.06 1,757.16 13,991.90 0.00 6,995.95 0.00 4,718.64 375,830.54 6.23 6.23 6.48 6.15 6.23 6.48 73.52 46.89 13,174.48 870.93 1,574.67 15,620.09 1,751.16 13,868.92 700.00 6,934.46 0.00 4,412.30 380,242.84 6.23 6.23 6.48 6.15 6.23 6.48 73.52 46.89 13,066.75 862.72 1,565.75 15,495.22 1,745.43 13,749.79 550.00 6,874.89 0.00 4,419.65 384,662.50 6.23 6.23 6.48 6.15 6.23 6.48 73.52 46.89 12,961.51 853.84 1,556.92 15,372.28 1,739.25 13,633.03 0.00 6,816.52 0.00 4,582.12 389,244.62 6.23 6.23 6.48 6.15 6.23 6.48 73.52 46.89 12,858.74 845.89 1,548.22 15,252.85 1,733.73 13,519.12 0.00 6,759.56 0.00 4,542.70 393,787.32 6.23 6.23 6.48 6.15 6.23 6.48 73.52 46.89 12,758.11 837.55 1,539.60 15,135.26 1,728.28 13,406.98 550.00 6,703.49 0.00 4,300.67 398,087.99 6.23 6.23 6.48 6.15 6.23 6.48 73.52 46.89 12,659.72 829.38 1,531.11 15,020.21 1,722.95 13,297.26 700.00 6,648.63 0.00 4,187.46 402,275.45 6.23 6.23 6.48 6.15 6.23 6.48 73.52 46.89 12,563.46 821.50 1,522.71 14,907.66 1,717.72 13,189.94 700.00 6,594.97 0.00 4,145.74 406,421.19 6.23 6.23 6.48 6.15 6.23 6.48 73.52 46.89 12,469.33 813.28 1,514.43 14,797.04 1,712.57 13,084.47 550.00 6,542.23 0.00 4,159.81 410,581.00
  • 42. Monthly Projections (Summ Date Realized Prices Marshall Gas ($/Mcf) Wetzel Gas ($/Mcf) Clearfield Gas ($/Mcf) Fayette Gas ($/Mcf) Butler Gas ($/Mcf) Dry Gas ($/Mcf) Oil ($/bbl) NGL ($/bbl) Total Gas Revenues Total Oil Revenues Total NGL Revenues Total Revenues Total Operating Expenses Operating Cash Flow Total Capital Expenditures Apple Operating Cash Flow Apple Upfront Payment Apple Net Free Cash Flow Apple Cumulative Cash Flow (I Yearly Projections (Summa Realized Prices Marshall Gas ($/Mcf) Wetzel Gas ($/Mcf) Clearfield Gas ($/Mcf) Fayette Gas ($/Mcf) Butler Gas ($/Mcf) Dry Gas ($/Mcf) Oil ($/bbl) NGL ($/bbl) Total Gas Revenues Total Oil Revenues Total NGL Revenues Total Revenues Total Operating Expenses Operating Cash Flow Total Capital Expenditures Apple Operating Cash Flow Apple Upfront Payment 2023 Jul-23 2023 Aug-23 2023 Sep-23 2023 Oct-23 2023 Nov-23 2023 Dec-23 2024 Jan-24 2024 Feb-24 2024 M ar-24 6.23 6.23 6.48 6.15 6.23 6.48 73.52 46.89 12,376.97 805.77 1,506.19 14,688.92 1,707.54 12,981.38 0.00 6,490.69 0.00 4,322.91 414,903.91 6.23 6.23 6.48 6.15 6.23 6.48 73.52 46.89 12,286.65 798.21 1,498.08 14,582.95 1,702.63 12,880.31 700.00 6,440.16 0.00 4,024.47 418,928.38 6.23 6.23 6.48 6.15 6.23 6.48 73.52 46.89 12,198.00 790.44 1,490.06 14,478.50 1,697.73 12,780.77 550.00 6,390.38 0.00 4,040.85 422,969.22 6.23 6.23 6.48 6.15 6.23 6.48 73.52 46.89 12,111.20 783.53 1,482.13 14,376.87 1,693.03 12,683.84 0.00 6,341.92 0.00 4,205.95 427,175.17 6.23 6.23 6.48 6.15 6.23 6.48 73.52 46.89 12,025.93 775.72 1,474.26 14,275.91 1,688.28 12,587.62 700.00 6,293.81 0.00 3,909.73 431,084.90 6.23 6.23 6.48 6.15 6.23 6.48 73.52 46.89 11,942.43 769.14 1,466.51 14,178.08 1,683.75 12,494.33 550.00 6,247.16 0.00 3,927.76 435,012.66 6.23 6.23 6.48 6.15 6.23 6.48 73.52 46.89 11,860.52 762.45 1,458.83 14,081.80 1,679.29 12,402.51 0.00 6,201.26 0.00 4,099.88 439,112.54 6.23 6.23 6.48 6.15 6.23 6.48 73.52 46.89 11,780.07 755.21 1,451.22 13,986.50 1,674.81 12,311.69 0.00 6,155.84 0.00 4,069.51 443,182.05 6.23 6.23 6.48 6.15 6.23 6.48 73.52 46.89 11,701.01 748.88 1,443.68 13,893.58 1,670.48 12,223.09 550.00 6,111.55 0.00 3,836.67 447,018.73
  • 43. Monthly Projections (Summ Date Realized Prices Marshall Gas ($/Mcf) Wetzel Gas ($/Mcf) Clearfield Gas ($/Mcf) Fayette Gas ($/Mcf) Butler Gas ($/Mcf) Dry Gas ($/Mcf) Oil ($/bbl) NGL ($/bbl) Total Gas Revenues Total Oil Revenues Total NGL Revenues Total Revenues Total Operating Expenses Operating Cash Flow Total Capital Expenditures Apple Operating Cash Flow Apple Upfront Payment Apple Net Free Cash Flow Apple Cumulative Cash Flow (I Yearly Projections (Summa Realized Prices Marshall Gas ($/Mcf) Wetzel Gas ($/Mcf) Clearfield Gas ($/Mcf) Fayette Gas ($/Mcf) Butler Gas ($/Mcf) Dry Gas ($/Mcf) Oil ($/bbl) NGL ($/bbl) Total Gas Revenues Total Oil Revenues Total NGL Revenues Total Revenues Total Operating Expenses Operating Cash Flow Total Capital Expenditures Apple Operating Cash Flow Apple Upfront Payment 2024 Apr-24 2024 M ay-24 2024 Jun-24 2024 Jul-24 2024 Aug-24 2024 Sep-24 2024 Oct-24 2024 Nov-24 2024 Dec-24 6.23 6.23 6.48 6.15 6.23 6.48 73.52 46.89 11,623.40 741.63 1,436.23 13,801.26 1,666.15 12,135.11 700.00 6,067.56 0.00 3,740.45 450,759.18 6.23 6.23 6.48 6.15 6.23 6.48 73.52 46.89 11,547.16 735.48 1,428.85 13,711.49 1,661.96 12,049.54 700.00 6,024.77 0.00 3,709.87 454,469.05 6.23 6.23 6.48 6.15 6.23 6.48 73.52 46.89 11,472.32 728.58 1,421.57 13,622.47 1,657.78 11,964.69 550.00 5,982.34 0.00 3,734.72 458,203.77 6.23 6.23 6.48 6.15 6.23 6.48 73.52 46.89 11,398.68 722.35 1,414.31 13,535.35 1,653.70 11,881.64 0.00 5,940.82 0.00 3,908.41 462,112.18 6.23 6.23 6.48 6.15 6.23 6.48 73.52 46.89 11,326.36 716.29 1,407.16 13,449.81 1,649.71 11,800.10 700.00 5,900.05 0.00 3,620.38 465,732.57 6.23 6.23 6.48 6.15 6.23 6.48 73.52 46.89 11,255.18 710.16 1,400.08 13,365.41 1,645.75 11,719.66 550.00 5,859.83 0.00 3,647.05 469,379.61 6.23 6.23 6.48 6.15 6.23 6.48 73.52 46.89 11,185.20 703.57 1,393.04 13,281.82 1,641.83 11,639.99 0.00 5,819.99 0.00 3,821.84 473,201.46 6.23 6.23 6.48 6.15 6.23 6.48 73.52 46.89 11,116.36 697.34 1,386.09 13,199.79 1,637.97 11,561.82 700.00 5,780.91 0.00 3,535.55 476,737.01 6.23 6.23 6.48 6.15 6.23 6.48 73.52 46.89 11,048.61 691.64 1,379.21 13,119.46 1,634.20 11,485.26 550.00 5,742.63 0.00 3,563.09 480,300.10
  • 44. Monthly Projections (Summ Date Realized Prices Marshall Gas ($/Mcf) Wetzel Gas ($/Mcf) Clearfield Gas ($/Mcf) Fayette Gas ($/Mcf) Butler Gas ($/Mcf) Dry Gas ($/Mcf) Oil ($/bbl) NGL ($/bbl) Total Gas Revenues Total Oil Revenues Total NGL Revenues Total Revenues Total Operating Expenses Operating Cash Flow Total Capital Expenditures Apple Operating Cash Flow Apple Upfront Payment Apple Net Free Cash Flow Apple Cumulative Cash Flow (I Yearly Projections (Summa Realized Prices Marshall Gas ($/Mcf) Wetzel Gas ($/Mcf) Clearfield Gas ($/Mcf) Fayette Gas ($/Mcf) Butler Gas ($/Mcf) Dry Gas ($/Mcf) Oil ($/bbl) NGL ($/bbl) Total Gas Revenues Total Oil Revenues Total NGL Revenues Total Revenues Total Operating Expenses Operating Cash Flow Total Capital Expenditures Apple Operating Cash Flow Apple Upfront Payment 2025 Jan-25 2025 Feb-25 2025 M ar-25 2025 Apr-25 2025 M ay-25 2025 Jun-25 2025 Jul-25 2025 Aug-25 2025 Sep-25 6.23 6.23 6.48 6.15 6.23 6.48 73.52 46.89 10,981.95 686.10 1,372.38 13,040.44 1,630.52 11,409.91 0.00 5,704.96 0.00 3,741.35 484,041.46 6.23 6.23 6.48 6.15 6.23 6.48 73.52 46.89 10,916.43 680.18 1,365.63 12,962.23 1,626.84 11,335.40 0.00 5,667.70 0.00 3,717.07 487,758.52 6.23 6.23 6.48 6.15 6.23 6.48 73.52 46.89 10,851.77 674.04 1,358.91 12,884.72 1,623.20 11,261.53 550.00 5,630.76 0.00 3,490.18 491,248.71 6.23 6.23 6.48 6.15 6.23 6.48 73.52 46.89 10,788.15 668.12 1,352.28 12,808.55 1,619.59 11,188.96 700.00 5,594.48 0.00 3,407.38 494,656.09 6.23 6.23 6.48 6.15 6.23 6.48 73.52 46.89 10,725.45 663.10 1,345.68 12,734.23 1,616.12 11,118.11 700.00 5,559.05 0.00 3,384.29 498,040.38 6.23 6.23 6.48 6.15 6.23 6.48 73.52 46.89 10,663.86 656.94 1,339.19 12,659.99 1,612.63 11,047.36 550.00 5,523.68 0.00 3,416.55 501,456.92 6.23 6.23 6.48 6.15 6.23 6.48 73.52 46.89 10,603.05 651.68 1,332.72 12,587.45 1,609.21 10,978.24 0.00 5,489.12 0.00 3,596.83 505,053.76 6.23 6.23 6.48 6.15 6.23 6.48 73.52 46.89 10,543.08 646.63 1,326.29 12,516.00 1,605.86 10,910.14 700.00 5,455.07 0.00 3,316.52 508,370.27 6.23 6.23 6.48 6.15 6.23 6.48 73.52 46.89 10,484.02 641.24 1,319.93 12,445.19 1,602.55 10,842.64 550.00 5,421.32 0.00 3,349.83 511,720.11
  • 45. Monthly Projections (Summ Date Realized Prices Marshall Gas ($/Mcf) Wetzel Gas ($/Mcf) Clearfield Gas ($/Mcf) Fayette Gas ($/Mcf) Butler Gas ($/Mcf) Dry Gas ($/Mcf) Oil ($/bbl) NGL ($/bbl) Total Gas Revenues Total Oil Revenues Total NGL Revenues Total Revenues Total Operating Expenses Operating Cash Flow Total Capital Expenditures Apple Operating Cash Flow Apple Upfront Payment Apple Net Free Cash Flow Apple Cumulative Cash Flow (I Yearly Projections (Summa Realized Prices Marshall Gas ($/Mcf) Wetzel Gas ($/Mcf) Clearfield Gas ($/Mcf) Fayette Gas ($/Mcf) Butler Gas ($/Mcf) Dry Gas ($/Mcf) Oil ($/bbl) NGL ($/bbl) Total Gas Revenues Total Oil Revenues Total NGL Revenues Total Revenues Total Operating Expenses Operating Cash Flow Total Capital Expenditures Apple Operating Cash Flow Apple Upfront Payment 2025 Oct-25 2025 Nov-25 2025 Dec-25 2026 Jan-26 2026 Feb-26 2026 M ar-26 2026 Apr-26 2026 M ay-26 2026 Jun-26 6.23 6.23 6.48 6.15 6.23 6.48 73.52 46.89 10,425.79 635.70 1,313.62 12,375.11 1,599.22 10,775.89 0.00 5,387.94 0.00 3,530.89 515,251.00 6.23 6.23 6.48 6.15 6.23 6.48 73.52 46.89 10,368.39 630.43 1,307.36 12,306.18 1,595.98 10,710.20 700.00 5,355.10 0.00 3,251.36 518,502.36 6.23 6.23 6.48 6.15 6.23 6.48 73.52 46.89 10,311.64 624.82 1,301.14 12,237.60 1,592.73 10,644.88 550.00 5,322.44 0.00 3,285.38 521,787.74 6.23 6.23 6.48 6.15 6.23 6.48 73.52 46.89 10,255.74 620.64 1,294.95 12,171.34 1,589.65 10,581.69 0.00 5,290.85 0.00 3,467.61 525,255.35 6.23 6.23 6.48 6.15 6.23 6.48 73.52 46.89 10,200.68 615.45 1,288.84 12,104.97 1,586.52 10,518.45 0.00 5,259.23 0.00 3,447.00 528,702.35 6.23 6.23 6.48 6.15 6.23 6.48 73.52 46.89 10,146.24 609.86 1,282.74 12,038.83 1,583.37 10,455.47 550.00 5,227.73 0.00 3,223.66 531,926.01 6.23 6.23 6.48 6.15 6.23 6.48 73.52 46.89 10,092.48 605.14 1,276.69 11,974.31 1,580.34 10,393.98 700.00 5,196.99 0.00 3,148.31 535,074.32 6.23 6.23 6.48 6.15 6.23 6.48 73.52 46.89 10,039.38 600.76 1,270.67 11,910.81 1,577.38 10,333.43 700.00 5,166.71 0.00 3,128.58 538,202.89 6.23 6.23 6.48 6.15 6.23 6.48 73.52 46.89 9,987.06 595.54 1,264.70 11,847.30 1,574.36 10,272.95 550.00 5,136.47 0.00 3,164.18 541,367.07
  • 46. Monthly Projections (Summ Date Realized Prices Marshall Gas ($/Mcf) Wetzel Gas ($/Mcf) Clearfield Gas ($/Mcf) Fayette Gas ($/Mcf) Butler Gas ($/Mcf) Dry Gas ($/Mcf) Oil ($/bbl) NGL ($/bbl) Total Gas Revenues Total Oil Revenues Total NGL Revenues Total Revenues Total Operating Expenses Operating Cash Flow Total Capital Expenditures Apple Operating Cash Flow Apple Upfront Payment Apple Net Free Cash Flow Apple Cumulative Cash Flow (I Yearly Projections (Summa Realized Prices Marshall Gas ($/Mcf) Wetzel Gas ($/Mcf) Clearfield Gas ($/Mcf) Fayette Gas ($/Mcf) Butler Gas ($/Mcf) Dry Gas ($/Mcf) Oil ($/bbl) NGL ($/bbl) Total Gas Revenues Total Oil Revenues Total NGL Revenues Total Revenues Total Operating Expenses Operating Cash Flow Total Capital Expenditures Apple Operating Cash Flow Apple Upfront Payment 2026 Jul-26 2026 Aug-26 2026 Sep-26 2026 Oct-26 2026 Nov-26 2026 Dec-26 2027 Jan-27 2027 Feb-27 2027 M ar-27 6.23 6.23 6.48 6.15 6.23 6.48 73.52 46.89 9,935.33 590.78 1,258.77 11,784.88 1,571.42 10,213.46 0.00 5,106.73 0.00 3,347.61 544,714.68 6.23 6.23 6.48 6.15 6.23 6.48 73.52 46.89 9,884.17 586.21 1,252.86 11,723.25 1,568.54 10,154.71 700.00 5,077.35 0.00 3,070.34 547,785.02 6.23 6.23 6.48 6.15 6.23 6.48 73.52 46.89 9,833.68 581.80 1,246.99 11,662.47 1,565.67 10,096.80 550.00 5,048.40 0.00 3,106.78 550,891.79 6.23 6.23 6.48 6.15 6.23 6.48 73.52 46.89 9,783.79 576.72 1,241.16 11,601.68 1,562.79 10,038.89 0.00 5,019.45 0.00 3,290.72 554,182.51 6.23 6.23 6.48 6.15 6.23 6.48 73.52 46.89 9,734.54 572.47 1,235.37 11,542.37 1,560.00 9,982.37 700.00 4,991.19 0.00 3,014.18 557,196.69 6.23 6.23 6.48 6.15 6.23 6.48 73.52 46.89 9,685.71 567.37 1,229.59 11,482.67 1,557.16 9,925.51 550.00 4,962.75 0.00 3,050.96 560,247.64 6.23 6.23 6.48 6.15 6.23 6.48 73.52 46.89 9,637.49 563.64 1,223.84 11,424.97 1,554.49 9,870.48 0.00 4,935.24 0.00 3,235.84 563,483.48 6.23 6.23 6.48 6.15 6.23 6.48 73.52 46.89 9,589.81 558.95 1,218.13 11,366.90 1,551.74 9,815.16 0.00 4,907.58 0.00 3,217.81 566,701.29 6.23 6.23 6.48 6.15 6.23 6.48 73.52 46.89 9,542.64 554.16 1,212.45 11,309.24 1,549.00 9,760.24 550.00 4,880.12 0.00 2,997.10 569,698.39
  • 47. Monthly Projections (Summ Date Realized Prices Marshall Gas ($/Mcf) Wetzel Gas ($/Mcf) Clearfield Gas ($/Mcf) Fayette Gas ($/Mcf) Butler Gas ($/Mcf) Dry Gas ($/Mcf) Oil ($/bbl) NGL ($/bbl) Total Gas Revenues Total Oil Revenues Total NGL Revenues Total Revenues Total Operating Expenses Operating Cash Flow Total Capital Expenditures Apple Operating Cash Flow Apple Upfront Payment Apple Net Free Cash Flow Apple Cumulative Cash Flow (I Yearly Projections (Summa Realized Prices Marshall Gas ($/Mcf) Wetzel Gas ($/Mcf) Clearfield Gas ($/Mcf) Fayette Gas ($/Mcf) Butler Gas ($/Mcf) Dry Gas ($/Mcf) Oil ($/bbl) NGL ($/bbl) Total Gas Revenues Total Oil Revenues Total NGL Revenues Total Revenues Total Operating Expenses Operating Cash Flow Total Capital Expenditures Apple Operating Cash Flow Apple Upfront Payment 2027 Apr-27 2027 M ay-27 2027 Jun-27 2027 Jul-27 2027 Aug-27 2027 Sep-27 2027 Oct-27 2027 Nov-27 2027 Dec-27 6.23 6.23 6.48 6.15 6.23 6.48 73.52 46.89 9,495.96 550.17 1,206.79 11,252.92 1,546.35 9,706.57 700.00 4,853.28 0.00 2,924.30 572,622.68 6.23 6.23 6.48 6.15 6.23 6.48 73.52 46.89 9,449.76 546.15 1,201.16 11,197.07 1,543.74 9,653.33 700.00 4,826.67 0.00 2,906.95 575,529.63 6.23 6.23 6.48 6.15 6.23 6.48 73.52 46.89 9,404.05 541.40 1,195.57 11,141.02 1,541.10 9,599.92 550.00 4,799.96 0.00 2,944.85 578,474.49 6.23 6.23 6.48 6.15 6.23 6.48 73.52 46.89 9,358.78 537.16 1,189.99 11,085.93 1,538.48 9,547.45 0.00 4,773.73 0.00 3,130.57 581,605.05 6.23 6.23 6.48 6.15 6.23 6.48 73.52 46.89 9,313.92 533.55 1,184.44 11,031.90 1,535.96 9,495.95 700.00 4,747.97 0.00 2,855.66 584,460.71 6.23 6.23 6.48 6.15 6.23 6.48 73.52 46.89 9,269.63 529.09 1,178.92 10,977.65 1,533.39 9,444.26 550.00 4,722.13 0.00 2,894.13 587,354.84 6.23 6.23 6.48 6.15 6.23 6.48 73.52 46.89 9,225.65 524.72 1,173.44 10,923.80 1,530.85 9,392.95 0.00 4,696.48 0.00 3,080.22 590,435.06 6.23 6.23 6.48 6.15 6.23 6.48 73.52 46.89 9,182.16 520.97 1,167.97 10,871.09 1,528.37 9,342.73 700.00 4,671.36 0.00 2,805.73 593,240.79 6.23 6.23 6.48 6.15 6.23 6.48 73.52 46.89 9,138.99 517.11 1,162.53 10,818.63 1,525.89 9,292.74 550.00 4,646.37 0.00 2,844.75 596,085.54
  • 48. Monthly Projections (Summ Date Realized Prices Marshall Gas ($/Mcf) Wetzel Gas ($/Mcf) Clearfield Gas ($/Mcf) Fayette Gas ($/Mcf) Butler Gas ($/Mcf) Dry Gas ($/Mcf) Oil ($/bbl) NGL ($/bbl) Total Gas Revenues Total Oil Revenues Total NGL Revenues Total Revenues Total Operating Expenses Operating Cash Flow Total Capital Expenditures Apple Operating Cash Flow Apple Upfront Payment Apple Net Free Cash Flow Apple Cumulative Cash Flow (I Yearly Projections (Summa Realized Prices Marshall Gas ($/Mcf) Wetzel Gas ($/Mcf) Clearfield Gas ($/Mcf) Fayette Gas ($/Mcf) Butler Gas ($/Mcf) Dry Gas ($/Mcf) Oil ($/bbl) NGL ($/bbl) Total Gas Revenues Total Oil Revenues Total NGL Revenues Total Revenues Total Operating Expenses Operating Cash Flow Total Capital Expenditures Apple Operating Cash Flow Apple Upfront Payment 2028 Jan-28 2028 Feb-28 2028 M ar-28 2028 Apr-28 2028 M ay-28 2028 Jun-28 2028 Jul-28 2028 Aug-28 2028 Sep-28 6.23 6.23 6.48 6.15 6.23 6.48 73.52 46.89 9,096.19 512.77 1,157.11 10,766.07 1,523.43 9,242.65 0.00 4,621.32 0.00 3,031.24 599,116.78 6.23 6.23 6.48 6.15 6.23 6.48 73.52 46.89 9,053.79 508.81 1,151.72 10,714.32 1,520.98 9,193.34 0.00 4,596.67 0.00 3,015.17 602,131.95 6.23 6.23 6.48 6.15 6.23 6.48 73.52 46.89 9,011.74 505.18 1,146.35 10,663.26 1,518.57 9,144.69 550.00 4,572.35 0.00 2,796.50 604,928.45 6.23 6.23 6.48 6.15 6.23 6.48 73.52 46.89 8,970.01 501.55 1,141.01 10,612.57 1,516.19 9,096.38 700.00 4,548.19 0.00 2,725.45 607,653.90 6.23 6.23 6.48 6.15 6.23 6.48 73.52 46.89 8,928.68 497.15 1,135.71 10,561.54 1,513.78 9,047.76 700.00 4,523.88 0.00 2,709.60 610,363.50 6.23 6.23 6.48 6.15 6.23 6.48 73.52 46.89 8,887.65 493.30 1,130.41 10,511.37 1,511.41 8,999.96 550.00 4,499.98 0.00 2,749.34 613,112.84 6.23 6.23 6.48 6.15 6.23 6.48 73.52 46.89 8,846.93 489.96 1,125.14 10,462.02 1,509.09 8,952.93 0.00 4,476.46 0.00 2,936.83 616,049.67 6.23 6.23 6.48 6.15 6.23 6.48 73.52 46.89 8,806.48 486.69 1,119.89 10,413.06 1,506.80 8,906.26 700.00 4,453.13 0.00 2,663.49 618,713.16 6.23 6.23 6.48 6.15 6.23 6.48 73.52 46.89 8,766.44 481.72 1,114.70 10,362.86 1,504.40 8,858.46 550.00 4,429.23 0.00 2,703.23 621,416.38
  • 49. Monthly Projections (Summ Date Realized Prices Marshall Gas ($/Mcf) Wetzel Gas ($/Mcf) Clearfield Gas ($/Mcf) Fayette Gas ($/Mcf) Butler Gas ($/Mcf) Dry Gas ($/Mcf) Oil ($/bbl) NGL ($/bbl) Total Gas Revenues Total Oil Revenues Total NGL Revenues Total Revenues Total Operating Expenses Operating Cash Flow Total Capital Expenditures Apple Operating Cash Flow Apple Upfront Payment Apple Net Free Cash Flow Apple Cumulative Cash Flow (I Yearly Projections (Summa Realized Prices Marshall Gas ($/Mcf) Wetzel Gas ($/Mcf) Clearfield Gas ($/Mcf) Fayette Gas ($/Mcf) Butler Gas ($/Mcf) Dry Gas ($/Mcf) Oil ($/bbl) NGL ($/bbl) Total Gas Revenues Total Oil Revenues Total NGL Revenues Total Revenues Total Operating Expenses Operating Cash Flow Total Capital Expenditures Apple Operating Cash Flow Apple Upfront Payment 2028 Oct-28 2028 Nov-28 2028 Dec-28 2029 Jan-29 2029 Feb-29 2029 M ar-29 2029 Apr-29 2029 M ay-29 2029 Jun-29 6.23 6.23 6.48 6.15 6.23 6.48 73.52 46.89 8,726.53 478.65 1,109.49 10,314.67 1,502.15 8,812.52 0.00 4,406.26 0.00 2,891.07 624,307.45 6.23 6.23 6.48 6.15 6.23 6.48 73.52 46.89 8,687.02 475.30 1,104.32 10,266.65 1,499.89 8,766.76 700.00 4,383.38 0.00 2,618.03 626,925.48 6.23 6.23 6.48 6.15 6.23 6.48 73.52 46.89 8,647.72 471.83 1,099.19 10,218.74 1,497.63 8,721.10 550.00 4,360.55 0.00 2,658.47 629,583.95 6.23 6.23 6.48 6.15 6.23 6.48 73.52 46.89 8,608.66 467.45 1,094.07 10,170.18 1,495.33 8,674.85 0.00 4,337.42 0.00 2,846.20 632,430.15 6.23 6.23 6.48 6.15 6.23 6.48 73.52 46.89 8,569.88 464.18 1,088.96 10,123.02 1,493.12 8,629.90 0.00 4,314.95 0.00 2,831.56 635,261.71 6.23 6.23 6.48 6.15 6.23 6.48 73.52 46.89 8,531.29 461.11 1,083.88 10,076.29 1,490.93 8,585.36 550.00 4,292.68 0.00 2,614.23 637,875.94 6.23 6.23 6.48 6.15 6.23 6.48 73.52 46.89 8,493.01 457.50 1,078.84 10,029.34 1,488.70 8,540.64 700.00 4,270.32 0.00 2,544.34 640,420.28 6.23 6.23 6.48 6.15 6.23 6.48 73.52 46.89 8,454.89 453.65 1,073.84 9,982.38 1,486.48 8,495.90 700.00 4,247.95 0.00 2,529.76 642,950.05 6.23 6.23 6.48 6.15 6.23 6.48 73.52 46.89 8,417.05 450.05 1,068.82 9,935.92 1,484.28 8,451.65 550.00 4,225.82 0.00 2,570.65 645,520.70
  • 50. Monthly Projections (Summ Date Realized Prices Marshall Gas ($/Mcf) Wetzel Gas ($/Mcf) Clearfield Gas ($/Mcf) Fayette Gas ($/Mcf) Butler Gas ($/Mcf) Dry Gas ($/Mcf) Oil ($/bbl) NGL ($/bbl) Total Gas Revenues Total Oil Revenues Total NGL Revenues Total Revenues Total Operating Expenses Operating Cash Flow Total Capital Expenditures Apple Operating Cash Flow Apple Upfront Payment Apple Net Free Cash Flow Apple Cumulative Cash Flow (I Yearly Projections (Summa Realized Prices Marshall Gas ($/Mcf) Wetzel Gas ($/Mcf) Clearfield Gas ($/Mcf) Fayette Gas ($/Mcf) Butler Gas ($/Mcf) Dry Gas ($/Mcf) Oil ($/bbl) NGL ($/bbl) Total Gas Revenues Total Oil Revenues Total NGL Revenues Total Revenues Total Operating Expenses Operating Cash Flow Total Capital Expenditures Apple Operating Cash Flow Apple Upfront Payment 2029 Jul-29 2029 Aug-29 2029 Sep-29 2029 Oct-29 2029 Nov-29 2029 Dec-29 2030 Jan-30 2030 Feb-30 2030 M ar-30 6.23 6.23 6.48 6.15 6.23 6.48 73.52 46.89 8,379.40 447.14 1,063.84 9,890.38 1,482.15 8,408.23 0.00 4,204.11 0.00 2,759.32 648,280.02 6.23 6.23 6.48 6.15 6.23 6.48 73.52 46.89 8,341.99 443.87 1,058.89 9,844.75 1,480.00 8,364.75 700.00 4,182.38 0.00 2,487.02 650,767.04 6.23 6.23 6.48 6.15 6.23 6.48 73.52 46.89 8,304.74 439.99 1,053.98 9,798.71 1,477.81 8,320.90 550.00 4,160.45 0.00 2,528.05 653,295.09 6.23 6.23 6.48 6.15 6.23 6.48 73.52 46.89 8,267.71 437.05 1,049.05 9,753.81 1,475.70 8,278.11 0.00 4,139.05 0.00 2,716.91 656,012.00 6.23 6.23 6.48 6.15 6.23 6.48 73.52 46.89 8,230.88 433.80 1,044.18 9,708.86 1,473.58 8,235.28 700.00 4,117.64 0.00 2,444.83 658,456.84 6.23 6.23 6.48 6.15 6.23 6.48 73.52 46.89 8,194.29 430.87 1,039.33 9,664.49 1,471.50 8,192.99 550.00 4,096.49 0.00 2,486.36 660,943.20 6.23 6.23 6.48 6.15 6.23 6.48 73.52 46.89 8,157.79 427.22 1,034.48 9,619.49 1,469.37 8,150.11 0.00 4,075.06 0.00 2,675.20 663,618.40 6.23 6.23 6.48 6.15 6.23 6.48 73.52 46.89 8,121.48 424.00 1,029.65 9,575.13 1,467.27 8,107.86 0.00 4,053.93 0.00 2,661.43 666,279.84 6.23 6.23 6.48 6.15 6.23 6.48 73.52 46.89 8,085.35 421.09 1,024.86 9,531.30 1,465.22 8,066.09 550.00 4,033.04 0.00 2,445.01 668,724.84
  • 51. Monthly Projections (Summ Date Realized Prices Marshall Gas ($/Mcf) Wetzel Gas ($/Mcf) Clearfield Gas ($/Mcf) Fayette Gas ($/Mcf) Butler Gas ($/Mcf) Dry Gas ($/Mcf) Oil ($/bbl) NGL ($/bbl) Total Gas Revenues Total Oil Revenues Total NGL Revenues Total Revenues Total Operating Expenses Operating Cash Flow Total Capital Expenditures Apple Operating Cash Flow Apple Upfront Payment Apple Net Free Cash Flow Apple Cumulative Cash Flow (I Yearly Projections (Summa Realized Prices Marshall Gas ($/Mcf) Wetzel Gas ($/Mcf) Clearfield Gas ($/Mcf) Fayette Gas ($/Mcf) Butler Gas ($/Mcf) Dry Gas ($/Mcf) Oil ($/bbl) NGL ($/bbl) Total Gas Revenues Total Oil Revenues Total NGL Revenues Total Revenues Total Operating Expenses Operating Cash Flow Total Capital Expenditures Apple Operating Cash Flow Apple Upfront Payment 2030 Apr-30 2030 M ay-30 2030 Jun-30 2030 Jul-30 2030 Aug-30 2030 Sep-30 2030 Oct-30 2030 Nov-30 2030 Dec-30 6.23 6.23 6.48 6.15 6.23 6.48 73.52 46.89 8,049.53 417.88 1,020.12 9,487.53 1,463.14 8,024.39 700.00 4,012.19 0.00 2,376.11 671,100.95 6.23 6.23 6.48 6.15 6.23 6.48 73.52 46.89 8,013.73 414.87 1,015.37 9,443.97 1,461.08 7,982.88 700.00 3,991.44 0.00 2,362.58 673,463.53 6.23 6.23 6.48 6.15 6.23 6.48 73.52 46.89 7,978.15 411.37 1,010.64 9,400.17 1,459.02 7,941.15 550.00 3,970.58 0.00 2,404.29 675,867.82 6.23 6.23 6.48 6.15 6.23 6.48 73.52 46.89 7,942.76 408.50 1,005.93 9,357.18 1,456.99 7,900.19 0.00 3,950.09 0.00 2,593.76 678,461.58 6.23 6.23 6.48 6.15 6.23 6.48 73.52 46.89 7,907.51 405.45 1,001.27 9,314.22 1,454.95 7,859.27 700.00 3,929.64 0.00 2,322.30 680,783.88 6.23 6.23 6.48 6.15 6.23 6.48 73.52 46.89 7,872.45 402.83 996.61 9,271.90 1,452.97 7,818.93 550.00 3,909.46 0.00 2,364.46 683,148.34 6.23 6.23 6.48 6.15 6.23 6.48 73.52 46.89 7,837.60 399.48 991.97 9,229.04 1,450.93 7,778.11 0.00 3,889.06 0.00 2,553.98 685,702.32 6.23 6.23 6.48 6.15 6.23 6.48 73.52 46.89 7,802.85 396.76 987.36 9,186.97 1,448.97 7,738.00 700.00 3,869.00 0.00 2,282.78 687,985.10 6.23 6.23 6.48 6.15 6.23 6.48 73.52 46.89 7,768.33 394.22 982.77 9,145.32 1,447.01 7,698.31 550.00 3,849.16 0.00 2,325.16 690,310.25
  • 52. Monthly Projections (Summ Date Realized Prices Marshall Gas ($/Mcf) Wetzel Gas ($/Mcf) Clearfield Gas ($/Mcf) Fayette Gas ($/Mcf) Butler Gas ($/Mcf) Dry Gas ($/Mcf) Oil ($/bbl) NGL ($/bbl) Total Gas Revenues Total Oil Revenues Total NGL Revenues Total Revenues Total Operating Expenses Operating Cash Flow Total Capital Expenditures Apple Operating Cash Flow Apple Upfront Payment Apple Net Free Cash Flow Apple Cumulative Cash Flow (I Yearly Projections (Summa Realized Prices Marshall Gas ($/Mcf) Wetzel Gas ($/Mcf) Clearfield Gas ($/Mcf) Fayette Gas ($/Mcf) Butler Gas ($/Mcf) Dry Gas ($/Mcf) Oil ($/bbl) NGL ($/bbl) Total Gas Revenues Total Oil Revenues Total NGL Revenues Total Revenues Total Operating Expenses Operating Cash Flow Total Capital Expenditures Apple Operating Cash Flow Apple Upfront Payment 2031 Jan-31 2031 Feb-31 2031 M ar-31 2031 Apr-31 2031 M ay-31 2031 Jun-31 2031 Jul-31 6.23 6.23 6.48 6.15 6.23 6.48 73.52 46.89 7,733.91 391.26 978.18 9,103.36 1,445.02 7,658.34 0.00 3,829.17 0.00 2,514.94 692,825.19 6.23 6.23 6.48 6.15 6.23 6.48 73.52 46.89 7,699.57 388.19 973.62 9,061.39 1,443.03 7,618.36 550.00 3,809.18 0.00 2,299.50 695,124.70 6.23 6.23 6.48 6.15 6.23 6.48 73.52 46.89 7,665.60 385.24 969.12 9,019.96 1,441.09 7,578.88 0.00 3,789.44 0.00 2,489.05 697,613.74 6.23 6.23 6.48 6.15 6.23 6.48 73.52 46.89 7,631.70 382.43 964.61 8,978.73 1,439.14 7,539.60 1,950.00 3,769.80 0.00 1,758.10 699,371.84 6.23 6.23 6.48 6.15 6.23 6.48 73.52 46.89 7,597.99 380.17 960.12 8,938.28 1,437.25 7,501.03 0.00 3,750.52 0.00 2,464.08 701,835.92 6.23 6.23 6.48 6.15 6.23 6.48 73.52 46.89 7,564.40 377.00 955.66 8,897.05 1,435.27 7,461.78 1,250.00 3,730.89 0.00 1,990.86 703,826.78 6.23 6.23 6.48 6.15 6.23 6.48 73.52 46.89 7,530.95 374.63 951.19 8,856.76 1,433.38 7,423.39 0.00 3,711.69 0.00 96,585.02 800,411.80