1. Second Quarter 2006
Earnings Conference Call
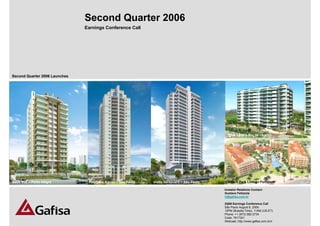
Second Quarter 2006 Launches
Blue Land – Rio de Janeiro
Belle Vue – Porto Alegre Paço das Águas – São Paulo Vistta Ibirapuera – São Paulo Beach Park Living - Fortaleza
Investor Relations Contact:
Gustavo Felizzola
ir@gafisa.com.br
2Q06 Earnings Conference Call
São Paulo August 8, 2006
12PM (Brasilia Time), 11AM (US-ET) 1
Phone: +1 (973) 582-2734
Code: 7617321
Webcast: http://www.gafisa.com.br/ir
2. Overview of the 2Q06 and Recent Developments
Wilson Amaral – Chief Executive Officer
2
3. Well Defined Strategy
Our Strategy
Create the leading residential development company in Brazil based upon sales,
profitability and quality
Maintain land Maintain debt
Strong Focus on high Continued
bank of policy of
revenue return geographic
2-3 years of 40% - 60% net
growth opportunities expansion
future sales debt / equity
3
4. Highlights
Launches increased 151% y-o-y
Launches increased to R$ 274.2 million in 2Q06 from R$ 109.1 million in 2Q05
Pre-Sales grew 168% y-o-y
Pre-sales increased to R$228.8 million in 2Q06 from R$85.3 million in 2Q05
Record-level Backlog Margin of 43.3% vs 33.1% in 2Q05
Backlog of Revenues rose to R$560.7 million in 2Q06 from R$382.2 million in 2Q05
Revenues Increase 47.5% to R$ 152,5 million and Adjusted EPS up 600% to 0.21
S&P raised Gafisa’s credit ratings to BBB+ from BBB
S&P have revised Gafisa’s outlook to positive
We strengthened our nationwide presence with three new partnerships in strategic
markets, Alagoas, Rio Grande do Sul e Bahia.
Mortgage availability by commercial banks increased 104% in the end June of this
year.
4
5. Gafisa Reports 151% Growth in Launches and 168% in Pre-Sales
Launches (R$ mm) Pre-Sales (R$ mm)
274 229
New Markets
New Markets 46 Rio de Janeiro 16
Rio de Janeiro São Paulo
Sao Paulo 58
%
% %
%
1 51
51 94 1 68
68
1 1
109 85
11 12 154
54 134 35
44 39
2Q05 2Q06 2Q05 2Q06
Pre-sales mix breakdown – 2Q06
22%
HIG
22%
MHI
69%
MID
AEL
LOT
COM
47%
Segmentation (Prices in R$/sq.m)
HIG – High Income: > 3,600 MHI – Middle High: 2,800 < > 3,600
MID – Middle Income: 2,000 < > 2,800 AEL – Affordable entry level: 1,800 < > 2,000 5
COM – Commercial LOT – Urbanized lots
6. Growth Prospects of São Paulo Market
Core Market – Metropolitan Area of São Paulo
6% of Brazilian population and 10% of Brazilian GDP
São Paulo also presents one of the highest GDP per capita in Brazil
(72% higher than Brazilian average)
Over 4 million homes (approximately 8% of total homes in Brazil)
Opportunities in the metropolitan area:
The metropolitan area of Sao Paulo presents several opportunities
on the residential segment, specifically in the middle income
bracket
Despite the lower demand for luxury housing, we see some
opportunities for innovative and differentiated projects
As for the low income, we observe a huge unmet demand due to
lack of a regulatory framework
6
7. Growth Prospects in Rio de Janeiro
Core Market - Rio de Janeiro State
3% of Brazilian population and 5% of Brazilian GDP
Rio de Janeiro also presents one of the highest GDP per capita in
Brazil (38% higher than Brazilian average)
Almost 2 million homes (approximately 4% of total homes in Brazil)
Launching of 2 billion per year
Opportunities:
Projects oriented to middle and high-income in Barra da Tijuca and
Jacarepaguá, fastest-growing region in the city
Looking for sites to develop units with prices around R$150,000
Diversifying around suburban areas of Rio de Janeiro State
7
8. Growth Prospects in New Markets
Well Defined Strategy
Develop local partnerships to leverage regional market knowledge,
legal skills, risk mitigation and entry barriers by reducing the time
for local approvals
Search new market regions that provide a sustainable growth to our
operations (growing income per capita, population growth, i.e.)
Multiple drivers of other markets mitigate growth risk
Business Owners Organizational Structure provide a totally focused
local management integrated and supported by Gafisa Corporate
Recently signed Unit in SP
partnerships
How Gafisa is differentiated in Developing Markets?
Strength of its brand and its track record in São Paulo and Rio de
Janeiro
Innovative project concepts
Differentiated project designs
Delivery of products on time and demand-aligned payment
conditions
Aggressive marketing strategy
8
9. Rapidly Expanding Mortgage Supply
Mortgage Availability Recent Developments
R$ billion
Santander offer 20-year fixed rate mortgage
Gafisa, HSBC and Santander offer pre-
20,3 approved mortgages
CEF expects to channel R$10.3 billion to the
housing sector using funds from FGTS/FAT
Bradesco plans to triple mortgage lending
10,3 activity this year to nearly R$2 billion. Itaú
13,9
expects to lend R$1.4 billion in 2006
13% The term was up to 20 years from 15 years
last year
9,0 9,4
9,1
ABECIP raises commercial banks lending
6,7 estimates to R$10 billion from R$7 billion
5,3 bringing total financing (including CEF) to
6,0 4,9 more than R$20 billion
10,0 83%
4,5
2,9 Central Bank may allow paycheck discount
109%
4,8 104% 4,1 for mortgage lending
3,0
2,2 2,0
Central Bank may allow Commercial Bank to
lend at fixed rate using funds from Savings
2003 2004 2005 2006E 1H05 1H06
accounts
Mortgage by Commercial Banks¹ CEF Mortgage Loans
Sources: ABECIP, Central Bank. ¹ Total mortgage lending using savings 9
deposits funding (channeled-lending requirement).
10. Land Bank
Land Bank representing 2-3 years of future sales
Land Bank
Potential Units %
by Income Segment Future Sales acquired
Lots & (R$ mm) by swap
High Middle AEL
Com
São Paulo 336 2,118 - 8 846 67%
Rio de
1,032 1,080 - 418 604 90% São Paulo
Janeiro
Other
444 2,115 - 270 638 92%
Cities
Total 1,812 5,313 - 696
2,089 84%
% 23% 68% 0% 9%
Rio de Janeiro
10
14. Despite the strong results in pre-sales, we’re still recognizing previous years
revenues
Pre-sales x Recognized revenues (R$000)
Developments Pre-Sales % of Pre-Sales Revenues % of Revenues
143,699 84% 16,042 11%
Launched in 2006 63%
Launched in 2005 48,347 21% 44,542 29%
Launched in 2004 16,557 7% 33,951 22% 59%
Launched in 2003 13,832 6% 36,963 24%
Launched in 2002 6,436 3% 8,240 5%
Others na na 12,809 8%
Total 228,870 100% 152,547 100%
14
15. Strong Pre-sales performance will positively impact future earnings
Currently, Gafisa has approximately R$243 million of results to be recognized (a 91% growth
compared to 2Q05)…
Revenues and Results be Recognized (R$ mm) Backlog Margin (%)
43,3%
41,1%
2Q05 1Q06 2Q06 (c)/(a) (c)/(b)
(a) (b) (c) % %
Sales to be Recognized 383,2 473,4 560,7 46% 33,1%
18%
Costs of Units Sold
(256,3) (278,9) (317,8) 24% 14%
to be Recognized 1
Results to be 91%
126,9 194,5 242,8 25%
Recognized
Margin to be
33.1% 41.1% 43.3%
Recognized
Note:
1 Includes only land and construction costs 2Q05 1Q06 2Q06
… with margins record high margins of 43.3%
15
16. Strong Financial Position…
…coupled with focus on working capital management
(R$ million) 2Q06 2Q05 1Q06
Short Term Debt 85 38 86
Long Term Debt 191 102 199
Total Debt 276 140 285
Cash and Cash Equivalents 423 119 481
Net Debt (Net Cash) (147) 21 (196)
Shareholder’s Equity 806 321 788
Total Capitalization 1,082 461 1,073
Net Debt/ Equity -18% 7% -25%
In order to optimize its working capital, Gafisa has been demanding new product from banks:
Gafisa and Banco HSBC offer pre-approved mortgage in Santo Andre (Sao Paulo)
Gafisa and Banco Santander Banespa Launches No-paperwork mortgage in Rio de Janeiro
Gafisa and Banco Santander Banespa offer mortgage with discount on rent during construction period
More recently, Gafisa’s Board approved a R$100 million securitization of Receivables from clients
16
17. Our Goals for 2006
Continued Growth Pace
► Launching growth guidance for 2006 of 25-28% in nominal currency terms
Margin Expansion
► EBITDA margin for FY06 of 16-17% (as % of Net Revenues)
17
18. Gafisa: Premier Growth Opportunity
Professional Management
Industry Leadership and
and
Strong Brand Recognition
Established Organization
World-class Shareholders
Geographic
and the Highest Standards
Diversification
of Corporate Governance
18
19. “Safe-Harbor” Statement
We make forward-looking statements that are subject to risks and uncertainties. These statements are based on
the beliefs and assumptions of our management, and on information currently available to us. Forward-looking
statements include statements regarding our intent, belief or current expectations or that of our directors or
executive officers.
Forward-looking statements also include information concerning our possible or assumed future results of
operations, as well as statements preceded by, followed by, or that include the words ''believes,'' ''may,'' ''will,''
''continues,'' ''expects,'‘ ''anticipates,'' ''intends,'' ''plans,'' ''estimates'' or similar expressions. Forward-looking
statements are not guarantees of performance. They involve risks, uncertainties and assumptions because they
relate to future events and therefore depend on circumstances that may or may not occur. Our future results
and shareholder values may differ materially from those expressed in or suggested by these forward-looking
statements. Many of the factors that will determine these results and values are beyond our ability to control or
predict.
19