SlideShare ist ein Scribd-Unternehmen logo
1 von 13
Here you can see how one team did.  Click through to see the team stats explained Field Goals Made out of Field Goals Attempted. Basically, it is the number of how many shots the team made divided by how many shots the team took. That gives you the shooting percentage. The Lakers shot 32.5% which means they made about 1 out of every 3 shots they took. (The higher the percentage the better so they really sucked; 45% is where teams are averaged out at)
Here you can see how one team did.  Click through to see the team stats explained 3-Pointers Made out of 3-Pointers Attempted. This is included into the overall FG percentage, but has it’s own section. The Lakers shot 20% means they made 1 out of every 5 they took. (This too is quite shabby, as 35% is considered adequate, but it’s okay Ron Artest hit one when they needed it to win)
Here you can see how one team did.  Click through to see the team stats explained Free Throws Made out of Free Throws Attempted. Combining everyone’s made shots at the line divided  by everyone’s taken shots at the line, giving the team’s free throw shooting percentage. The Lakers did not shoot particularly well here either, as 75% is the average
Here you can see how one team did.  Click through to see the team stats explained The total number of offensive rebounds a team got. Lakers got a fantastic number of 23, thus giving them more shot opportunities than the opposing team, as  well as more possession time. 10 is about the average .
Here you can see how one team did.  Click through to see the team stats explained Total number of defensive rebounds the team collected. The Lakers hit the league average with 30. Team rebounds are when scorers can't credit just one player, or if  the ball hits the rim going out of bounds, etc.
Here you can see how one team did.  Click through to see the team stats explained This is the total number of all rebounds. For the Lakers,  they collected 23 offensive + 30 defensive = 53 total rebounds
Here you can see how one team did.  Click through to see the team stats explained Assists made by the whole team. These are plays created by  one player, but executed by another. In other words, a player  passes to another who shoots it. The Lakers had a measly 11,  being directly related to shooting percentage and field goals made.  (Viewed as a point guard’s stat, it is ironic that Pau Gasol, a power forward, led their team in assists in this game)
Here you can see how one team did.  Click through to see the team stats explained Personal Fouls committed by the team. This stat is not as significant as the number of fouls committed by an individual player. Players can commit up to 5, they foul out a 6. Also, teams go into the penalty after 5 fouls in a quarter.
Here you can see how one team did.  Click through to see the team stats explained Steals made the team in a game. The number usually means that they earned that many more possessions. (And also,  they went out of their defensive position, which half of the  time is not good.) Lakers had 0 here, which isn’t necessarily “ bad” but unusual, as teams average 8 a game.
Here you can see how one team did.  Click through to see the team stats explained Turnovers committed by the team. This is quite important when looking  at the box score, as it means how efficient or sloppy the team played.  Here it shows that Lakers had only 11, meaning they took care of the ball and made careful plays. The other stat that correlates with turnovers, are  assists. Turnover to assist ratio is used to describe a player’s or team’s Efficiency on the offensive end. For instance, Derek Fisher’s TO:A is 2:0.
Here you can see how one team did.  Click through to see the team stats explained Blocked Shots the team had. Not often referred to as a team stat, but an individuals, but the higher the number the better as always.
Here you can see how one team did.  Click through to see the team stats explained Blocks Allowed. This stat shows how many shots a team was blocked. In contrast to blocked shots, the least the better.
Here you can see how one team did.  Click through to see the team stats explained Points! The fun stat which is every player’s points added all together to make the final score of the game. By looking at the total points, you can determine if it was a offensive kind of game if it is high scoring or defensive (or just sloppy) kind of game if it is low scoring. Lakers  were under their average of 101, but credit the Boston defense.

Weitere ähnliche Inhalte

Ähnlich wie How to Read an NBA Box Score

Sports Aanalytics - Goaltender Performance
Sports Aanalytics - Goaltender PerformanceSports Aanalytics - Goaltender Performance
Sports Aanalytics - Goaltender PerformanceJason Mei
 
Yujie Zi Econ 123CW Research Paper - NBA Defensive Teams
Yujie Zi Econ 123CW Research Paper - NBA Defensive TeamsYujie Zi Econ 123CW Research Paper - NBA Defensive Teams
Yujie Zi Econ 123CW Research Paper - NBA Defensive TeamsYujie Zi
 
NFL 2022 STATS Report
NFL 2022 STATS ReportNFL 2022 STATS Report
NFL 2022 STATS Reportdavidwaynne
 
Bank Shots to Bankroll Final
Bank Shots to Bankroll FinalBank Shots to Bankroll Final
Bank Shots to Bankroll FinalJoseph DeLay
 
Relations to salary and team contribution in NBA ( 17-18 Season )
Relations to salary and team contribution in NBA ( 17-18 Season )Relations to salary and team contribution in NBA ( 17-18 Season )
Relations to salary and team contribution in NBA ( 17-18 Season )상연 최
 
Tactical Report Match Analysis
Tactical Report Match AnalysisTactical Report Match Analysis
Tactical Report Match AnalysisBrian VanDongen
 

Ähnlich wie How to Read an NBA Box Score (8)

Sports Aanalytics - Goaltender Performance
Sports Aanalytics - Goaltender PerformanceSports Aanalytics - Goaltender Performance
Sports Aanalytics - Goaltender Performance
 
Yujie Zi Econ 123CW Research Paper - NBA Defensive Teams
Yujie Zi Econ 123CW Research Paper - NBA Defensive TeamsYujie Zi Econ 123CW Research Paper - NBA Defensive Teams
Yujie Zi Econ 123CW Research Paper - NBA Defensive Teams
 
NFL 2022 STATS Report
NFL 2022 STATS ReportNFL 2022 STATS Report
NFL 2022 STATS Report
 
Bank Shots to Bankroll Final
Bank Shots to Bankroll FinalBank Shots to Bankroll Final
Bank Shots to Bankroll Final
 
Relations to salary and team contribution in NBA ( 17-18 Season )
Relations to salary and team contribution in NBA ( 17-18 Season )Relations to salary and team contribution in NBA ( 17-18 Season )
Relations to salary and team contribution in NBA ( 17-18 Season )
 
NBA Player Statistics
NBA Player StatisticsNBA Player Statistics
NBA Player Statistics
 
Tactical Report Match Analysis
Tactical Report Match AnalysisTactical Report Match Analysis
Tactical Report Match Analysis
 
Research Paper
Research PaperResearch Paper
Research Paper
 

Kürzlich hochgeladen

Benifits of Individual And Team Sports-Group 7.pptx
Benifits of Individual And Team Sports-Group 7.pptxBenifits of Individual And Team Sports-Group 7.pptx
Benifits of Individual And Team Sports-Group 7.pptxsherrymieg19
 
PPT on INDIA VS PAKISTAN - A Sports Rivalry
PPT on INDIA VS PAKISTAN - A Sports RivalryPPT on INDIA VS PAKISTAN - A Sports Rivalry
PPT on INDIA VS PAKISTAN - A Sports Rivalryanirbannath184
 
Spain Vs Italy Showdown Between Italy and Spain Could Determine UEFA Euro 202...
Spain Vs Italy Showdown Between Italy and Spain Could Determine UEFA Euro 202...Spain Vs Italy Showdown Between Italy and Spain Could Determine UEFA Euro 202...
Spain Vs Italy Showdown Between Italy and Spain Could Determine UEFA Euro 202...World Wide Tickets And Hospitality
 
JORNADA 2 LIGA MUROBASQUETBOL1 2024.docx
JORNADA 2 LIGA MUROBASQUETBOL1 2024.docxJORNADA 2 LIGA MUROBASQUETBOL1 2024.docx
JORNADA 2 LIGA MUROBASQUETBOL1 2024.docxArturo Pacheco Alvarez
 
Italy Vs Albania Euro Cup 2024 Italy's Strategy for Success.docx
Italy Vs Albania Euro Cup 2024 Italy's Strategy for Success.docxItaly Vs Albania Euro Cup 2024 Italy's Strategy for Success.docx
Italy Vs Albania Euro Cup 2024 Italy's Strategy for Success.docxWorld Wide Tickets And Hospitality
 
Introduction to Basketball-PowerPoint Presentation
Introduction to Basketball-PowerPoint PresentationIntroduction to Basketball-PowerPoint Presentation
Introduction to Basketball-PowerPoint PresentationJuliusMacaballug
 
Project & Portfolio, Market Analysis: WWE
Project & Portfolio, Market Analysis: WWEProject & Portfolio, Market Analysis: WWE
Project & Portfolio, Market Analysis: WWEDeShawn Ellis
 
DONAL88 >LINK SLOT PG SOFT TERGACOR 2024
DONAL88 >LINK SLOT PG SOFT TERGACOR 2024DONAL88 >LINK SLOT PG SOFT TERGACOR 2024
DONAL88 >LINK SLOT PG SOFT TERGACOR 2024DONAL88 GACOR
 
JORNADA 3 LIGA MURO 2024GHGHGHGHGHGH.pdf
JORNADA 3 LIGA MURO 2024GHGHGHGHGHGH.pdfJORNADA 3 LIGA MURO 2024GHGHGHGHGHGH.pdf
JORNADA 3 LIGA MURO 2024GHGHGHGHGHGH.pdfArturo Pacheco Alvarez
 
Clash of Titans_ PSG vs Barcelona (1).pdf
Clash of Titans_ PSG vs Barcelona (1).pdfClash of Titans_ PSG vs Barcelona (1).pdf
Clash of Titans_ PSG vs Barcelona (1).pdfMuhammad Hashim
 

Kürzlich hochgeladen (11)

Benifits of Individual And Team Sports-Group 7.pptx
Benifits of Individual And Team Sports-Group 7.pptxBenifits of Individual And Team Sports-Group 7.pptx
Benifits of Individual And Team Sports-Group 7.pptx
 
PPT on INDIA VS PAKISTAN - A Sports Rivalry
PPT on INDIA VS PAKISTAN - A Sports RivalryPPT on INDIA VS PAKISTAN - A Sports Rivalry
PPT on INDIA VS PAKISTAN - A Sports Rivalry
 
Spain Vs Italy Showdown Between Italy and Spain Could Determine UEFA Euro 202...
Spain Vs Italy Showdown Between Italy and Spain Could Determine UEFA Euro 202...Spain Vs Italy Showdown Between Italy and Spain Could Determine UEFA Euro 202...
Spain Vs Italy Showdown Between Italy and Spain Could Determine UEFA Euro 202...
 
NATIONAL SPORTS DAY WRITTEN QUIZ by QUI9
NATIONAL SPORTS DAY WRITTEN QUIZ by QUI9NATIONAL SPORTS DAY WRITTEN QUIZ by QUI9
NATIONAL SPORTS DAY WRITTEN QUIZ by QUI9
 
JORNADA 2 LIGA MUROBASQUETBOL1 2024.docx
JORNADA 2 LIGA MUROBASQUETBOL1 2024.docxJORNADA 2 LIGA MUROBASQUETBOL1 2024.docx
JORNADA 2 LIGA MUROBASQUETBOL1 2024.docx
 
Italy Vs Albania Euro Cup 2024 Italy's Strategy for Success.docx
Italy Vs Albania Euro Cup 2024 Italy's Strategy for Success.docxItaly Vs Albania Euro Cup 2024 Italy's Strategy for Success.docx
Italy Vs Albania Euro Cup 2024 Italy's Strategy for Success.docx
 
Introduction to Basketball-PowerPoint Presentation
Introduction to Basketball-PowerPoint PresentationIntroduction to Basketball-PowerPoint Presentation
Introduction to Basketball-PowerPoint Presentation
 
Project & Portfolio, Market Analysis: WWE
Project & Portfolio, Market Analysis: WWEProject & Portfolio, Market Analysis: WWE
Project & Portfolio, Market Analysis: WWE
 
DONAL88 >LINK SLOT PG SOFT TERGACOR 2024
DONAL88 >LINK SLOT PG SOFT TERGACOR 2024DONAL88 >LINK SLOT PG SOFT TERGACOR 2024
DONAL88 >LINK SLOT PG SOFT TERGACOR 2024
 
JORNADA 3 LIGA MURO 2024GHGHGHGHGHGH.pdf
JORNADA 3 LIGA MURO 2024GHGHGHGHGHGH.pdfJORNADA 3 LIGA MURO 2024GHGHGHGHGHGH.pdf
JORNADA 3 LIGA MURO 2024GHGHGHGHGHGH.pdf
 
Clash of Titans_ PSG vs Barcelona (1).pdf
Clash of Titans_ PSG vs Barcelona (1).pdfClash of Titans_ PSG vs Barcelona (1).pdf
Clash of Titans_ PSG vs Barcelona (1).pdf
 

How to Read an NBA Box Score

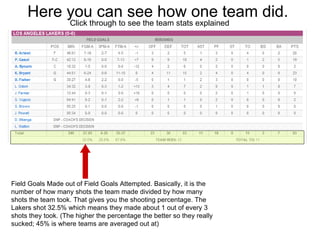
  • 1. Here you can see how one team did. Click through to see the team stats explained Field Goals Made out of Field Goals Attempted. Basically, it is the number of how many shots the team made divided by how many shots the team took. That gives you the shooting percentage. The Lakers shot 32.5% which means they made about 1 out of every 3 shots they took. (The higher the percentage the better so they really sucked; 45% is where teams are averaged out at)
  • 2. Here you can see how one team did. Click through to see the team stats explained 3-Pointers Made out of 3-Pointers Attempted. This is included into the overall FG percentage, but has it’s own section. The Lakers shot 20% means they made 1 out of every 5 they took. (This too is quite shabby, as 35% is considered adequate, but it’s okay Ron Artest hit one when they needed it to win)
  • 3. Here you can see how one team did. Click through to see the team stats explained Free Throws Made out of Free Throws Attempted. Combining everyone’s made shots at the line divided by everyone’s taken shots at the line, giving the team’s free throw shooting percentage. The Lakers did not shoot particularly well here either, as 75% is the average
  • 4. Here you can see how one team did. Click through to see the team stats explained The total number of offensive rebounds a team got. Lakers got a fantastic number of 23, thus giving them more shot opportunities than the opposing team, as well as more possession time. 10 is about the average .
  • 5. Here you can see how one team did. Click through to see the team stats explained Total number of defensive rebounds the team collected. The Lakers hit the league average with 30. Team rebounds are when scorers can't credit just one player, or if the ball hits the rim going out of bounds, etc.
  • 6. Here you can see how one team did. Click through to see the team stats explained This is the total number of all rebounds. For the Lakers, they collected 23 offensive + 30 defensive = 53 total rebounds
  • 7. Here you can see how one team did. Click through to see the team stats explained Assists made by the whole team. These are plays created by one player, but executed by another. In other words, a player passes to another who shoots it. The Lakers had a measly 11, being directly related to shooting percentage and field goals made. (Viewed as a point guard’s stat, it is ironic that Pau Gasol, a power forward, led their team in assists in this game)
  • 8. Here you can see how one team did. Click through to see the team stats explained Personal Fouls committed by the team. This stat is not as significant as the number of fouls committed by an individual player. Players can commit up to 5, they foul out a 6. Also, teams go into the penalty after 5 fouls in a quarter.
  • 9. Here you can see how one team did. Click through to see the team stats explained Steals made the team in a game. The number usually means that they earned that many more possessions. (And also, they went out of their defensive position, which half of the time is not good.) Lakers had 0 here, which isn’t necessarily “ bad” but unusual, as teams average 8 a game.
  • 10. Here you can see how one team did. Click through to see the team stats explained Turnovers committed by the team. This is quite important when looking at the box score, as it means how efficient or sloppy the team played. Here it shows that Lakers had only 11, meaning they took care of the ball and made careful plays. The other stat that correlates with turnovers, are assists. Turnover to assist ratio is used to describe a player’s or team’s Efficiency on the offensive end. For instance, Derek Fisher’s TO:A is 2:0.
  • 11. Here you can see how one team did. Click through to see the team stats explained Blocked Shots the team had. Not often referred to as a team stat, but an individuals, but the higher the number the better as always.
  • 12. Here you can see how one team did. Click through to see the team stats explained Blocks Allowed. This stat shows how many shots a team was blocked. In contrast to blocked shots, the least the better.
  • 13. Here you can see how one team did. Click through to see the team stats explained Points! The fun stat which is every player’s points added all together to make the final score of the game. By looking at the total points, you can determine if it was a offensive kind of game if it is high scoring or defensive (or just sloppy) kind of game if it is low scoring. Lakers were under their average of 101, but credit the Boston defense.