BAGALUR CALL GIRL IN 98274*61493 ❤CALL GIRLS IN ESCORT SERVICE❤CALL GIRL
T2 annual letter 2011
1. Whitney R. Tilson and Glenn H. Tongue phone: 212 386 7160
Managing Partners fax: 240 368 0299
www.T2PartnersLLC.com
January 4, 2012
Dear Partner,
We hope you had wonderful holidays and wish you a happy new year!
In each of our annual letters we seek to frankly assess our performance, reiterate our core investment
philosophy, and share our latest thinking about various matters. In addition, we discuss our 15 largest
long positions and so you can better understand how we invest, what we own and why, and why we have
so much confidence in our fund’s future prospects.
Performance
There is no way to put a positive spin on 2011: our fund had a dreadful year, its worst ever on both an
absolute and relative basis. While we made a bit of money on the short side, nearly all of our longs
entering the year did very poorly and, compounding this, most of the investment decisions we made
during the year subtracted value. It has been an extremely frustrating – and humbling – experience.
Total Annualized
Since Since
December 4th Quarter Full Year Inception Inception
T2 Accredited Fund - net 0.1% 6.5% -24.9% 114.2% 6.0%
S&P 500 1.0% 11.8% 2.1% 29.2% 2.0%
Dow 1.6% 12.8% 8.4% 79.6% 4.6%
NASDAQ -0.5% 8.1% -1.0% 23.6% 1.6%
Past performance is not indicative of future results. Please refer to the disclosure section at the end of this letter. The T2 Accredited Fund
was launched on 1/1/99.
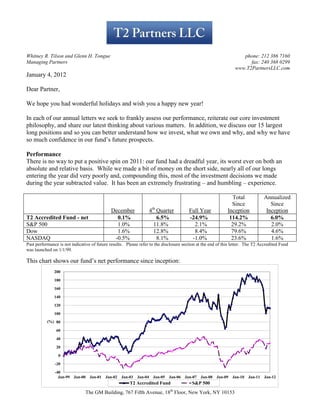
This chart shows our fund’s net performance since inception:
200
180
160
140
120
100
(%) 80
60
40
20
0
-20
-40
Jan-99 Jan-00 Jan-01 Jan-02 Jan-03 Jan-04 Jan-05 Jan-06 Jan-07 Jan-08 Jan-09 Jan-10 Jan-11 Jan-12
T2 Accredited Fund S&P 500
The GM Building, 767 Fifth Avenue, 18th Floor, New York, NY 10153
2. This table shows our fund’s net performance by month since inception:
1999 2000 2001 2002 2003 2004 2005 2006 2007 2008 2009 2010 2011
T2 S&P T2 S&P T2 S&P T2 S&P T2 S&P T2 S&P T2 S&P T2 S&P T2 S&P T2 S&P T2 S&P T2 S&P T2 S&P
AF 500 AF 500 AF 500 AF 500 AF 500 AF 500 AF 500 AF 500 AF 500 AF 500 AF 500 AF 500 AF 500
January 7.8 4.1 -6.3 -5.0 4.4 3.6 -1.8 -1.5 -5.5 -2.6 4.7 1.8 1.1 -2.4 1.9 2.7 2.4 1.7 1.9 -5.9 -3.6 -8.4 -1.6 -3.6 -2.8 2.4
February -2.9 -3.1 6.2 -1.9 -0.6 -9.2 -1.1 -2.0 2.9 -1.6 7.0 1.5 2.1 2.0 -3.1 0.2 -3.3 -2.1 -6.9 -3.3 -8.9 -10.8 7.3 3.1 4.1 3.4
March 4.1 4.0 10.3 9.8 -2.6 -6.4 3.0 3.7 1.4 0.9 3.9 -1.5 3.9 -1.7 3.9 1.3 -0.8 1.1 -2.3 -0.5 2.9 9.0 4.6 6.0 -4.1 0.0
April 2.1 3.7 -5.1 -3.0 5.1 7.8 -0.2 -6.0 10.5 8.2 2.4 -1.5 0.6 -1.9 2.2 1.4 4.4 4.6 -0.9 4.9 20.1 9.6 -2.1 1.6 1.9 3.0
May -5.7 -2.5 -2.8 -2.0 1.8 0.6 0.0 -0.8 6.6 5.3 -1.4 1.4 -2.6 3.2 1.8 -2.9 2.5 3.3 7.9 1.2 8.1 5.5 -2.6 -8.0 -1.9 -1.1
June 2.2 5.8 4.1 2.4 4.6 -2.4 -7.3 -7.1 2.9 1.3 0.1 1.9 -3.1 0.1 -0.2 0.2 -3.0 -1.5 -1.2 -8.4 -5.0 0.2 4.5 -5.2 -2.4 -1.7
July -0.7 -3.2 -3.6 -1.6 -1.1 -1.0 -5.0 -7.9 2.3 1.7 4.6 -3.4 0.5 3.7 -0.9 0.7 -5.4 -3.0 -2.5 -0.9 6.8 7.6 3.5 7.0 -4.6 -2.0
August 4.1 -0.4 5.4 6.1 2.5 -6.3 -4.3 0.5 0.4 1.9 -0.9 0.4 -3.2 -1.0 2.9 2.3 1.7 1.5 -3.3 1.3 6.3 3.6 -1.5 -4.5 -13.9 -5.4
September -3.3 -2.7 -7.2 -5.3 -6.1 -8.1 -5.4 -10.9 1.7 -1.0 -1.6 1.1 -1.5 0.8 5.0 2.6 -1.1 3.6 15.9 -9.1 5.9 3.7 1.7 8.9 -9.3 -7.0
October 8.1 6.4 -4.5 -0.3 -0.8 1.9 2.8 8.8 6.2 5.6 -0.4 1.5 3.5 -1.6 6.3 3.5 8.2 1.7 -12.5 -16.8 -1.9 -1.8 -1.7 3.8 7.0 10.9
November 2.8 2.0 -1.5 -7.9 2.3 7.6 4.1 5.8 2.2 0.8 0.8 4.0 3.1 3.7 1.9 1.7 -3.6 -4.2 -8.9 -7.1 -1.2 6.0 -1.9 0.0 -0.6 -0.2
December 9.8 5.9 2.3 0.5 6.5 0.9 -7.4 -5.8 -0.4 5.3 -0.2 3.4 -1.3 0.0 1.4 1.4 -4.3 -0.7 -4.0 1.1 5.5 1.9 0.5 6.7 0.1 1.0
YTD
31.0 21.0 -4.5 -9.1 16.5 -11.9 -22.2 -22.1 35.1 28.6 20.6 10.9 2.6 4.9 25.2 15.8 -3.2 5.5 -18.1 -37.0 37.1 26.5 10.5 15.1 -24.9 2.1
TOTAL
Note: Returns in 2001, 2003, and 2009 reflect the benefit of the high-water mark, assuming an investor at inception.
Performance Objectives
In every year-end letter we repeat our performance objectives, which have been the same since our fund’s
inception (no changing the rules in the middle of the race): Our primary goal is to earn you a compound
annual return of at least 15%, measured over a minimum of a 3-5 year horizon.
We arrived at that objective by assuming the overall stock market is likely to compound at 5-10%
annually over the foreseeable future, and then adding 5-10 percentage points for the value we seek to add,
which reflects our secondary objective of beating the S&P 500 by 5-10 percentage points annually over
shorter time periods. While a 15% compounded annual return might not sound very exciting, it would
quadruple your investment over the next 10 years, while 7-8% annually – about what we expect from the
overall market – would only double your money.
Since inception 13 years ago, we have not met our 15% objective, thanks in part to one of the worst
periods ever for stocks. We have outperformed the S&P 500 by 4.0 percentage points per year, just below
the low end of our 5-10 percentage point goal. We are not satisfied with our performance and are
determined to improve it.
Performance Assessment
We struggle with how bad of a grade to give ourselves for 2011 because in some ways it’s too early to
tell. Yes, many of our stocks took beatings during the year, but only time will tell whether we were
wrong or just early. We think in most cases the latter, given that we still own meaningful positions in 8 of
our 10 (and 15 of our 20) biggest losers on the long side in 2011. If even a handful of these stocks
perform like we think they will in the next 1-3 years, we won’t look as dumb as we do today – and thus
we might give ourselves a C for 2011. If these stocks don’t recover, then we deserve a D.
Why not an F? Because an F is reserved for blowing up – and we didn’t. In fact, when things got ugly in
August and September, we didn’t panic and dump everything and go to cash or a market neutral position.
-2-
3. Instead, we stayed calm, added to our favorite positions, and recouped some of our losses in the fourth
quarter.
We’re in the Same Boat
We believe in eating our own cooking – we have a higher percentage of our net worths in our funds than
anyone, by far – so it goes without saying that no-one has lost more money or feels worse about our
fund’s recent performance than we do.
We’re not only in the same boat financially, but also in terms of the decisions we have to make when
faced with poor performance. To the extent that you choose to invest in funds, you have thousands of
choices, just as we have thousands of stocks to choose from. As we discuss below in the section entitled
“Guaranteed Underperformance,” it is a certainty that every fund you invest in will underperform at
times, just as every stock we invest in will do so as well.
The critical question all of us face is: what should we do when a fund or a stock we own performs poorly?
There are only three choices: sell, hold, or buy more. This decision, more than any other, is the key to
long-term investment success – far more important than timing the entry point exactly right.
Unfortunately, there is no easy answer – every fund and every stock is different – but here are a few
thoughts: First, to quote Ben Graham, you must let the market be your servant, not your guide. Just
because other investors are selling in a panic doesn’t mean you should. In some cases, the herd is right,
but the real money is made betting against the herd when it’s wrong. It may be the right thing to sell and
move on – you don’t have to make it back the same way you lost it – but the decision whether to do so
mustn’t be guided by other investors’ behavior.
Our approach is to tune out the short-term noise and carefully evaluate the company and its management,
focusing on the long-term track record rather than the short-term poor performance. The key question to
ask is: has anything changed that leads us to believe that the recent performance is likely to be permanent,
or is this just one of those inevitable periods of bad luck and/or fixable mistakes, such that the company is
likely to revert to its long-term outperformance?
In the case of most of our poorly performing stocks of 2011, we believe the latter is the case, so we held
or bought more. We think the same will prove to be true for our fund, as neither our investment approach,
which is rooted in the timeless principles of value investing, nor our ability to execute on it has changed.
Deviating from the Crowd and Guaranteed Underperformance
Stocks are volatile and since we invest in a concentrated fashion, often in unpopular sectors, are willing to
“catch falling knives” if they’re cheap enough, and never engage in closet indexing, we’ve always known
from the day we started this business 13 years ago that our portfolio would occasionally suffer losses
and/or trail the market, perhaps to a significant degree. In other words, we guarantee underperformance at
times.
Our investment strategy is rooted in deviating from the crowd with contrarian bets. We think it’s the only
way to outperform the market over the long term, but it also carries with it the risk – indeed, the certainty
– that there will be periods during which one underperforms the market, which is why most money
managers don’t do it. Buffett once said, “As a group, lemmings have a rotten image, but no individual
lemming has ever received bad press.” Jean-Marie Eveillard put it even more succinctly: “It’s warmer
inside the herd.”
-3-
4. It’s easy to deviate from the crowd, of course, but it’s much harder to be right – and even harder to be
right on the timing. For example, as we discuss in Appendix A, we’re confident that Iridium’s stock will
triple over the next 3-5 years – but we don’t know when this will occur. In the meantime, the stock can –
and does – fluctuate quite widely (it was our biggest loser in 2011). We think we’ll eventually be proven
right on the positions we hold, both long and short, but sometimes it takes time for our investment thesis
to play out.
Guaranteed underperformance isn’t a topic often discussed publicly by money managers, but it’s
extremely important for both investors (you) and investment managers (us) to understand that virtually all
money managers will underperform at times, occasionally badly and for extended periods, yet the long-
term results can still be excellent. Indeed, the well-respected Davis Funds did a study of the 192 large-cap
funds with top-quartile performance during the decade ending 12/31/10 and found some stunning results:
93% of these top managers’ rankings fell to the bottom half of their peers for at least one
three-year period
A full 62% ranked among the bottom quartile of their peers for at least one three-year period,
and
31% ranked in the bottom decile for at least one three-year period, as this chart shows:
Davis Funds concluded:
When faced with short-term underperformance from an investment manager, investors may lose conviction
and switch to another manager. Unfortunately, when evaluating managers, short-term performance is not a
strong indicator of long-term success.
Though each of the managers in the study delivered excellent long-term returns, almost all suffered through
a difficult period. Investors who recognize and prepare for the fact that short-term underperformance is
-4-
5. inevitable—even from the best managers—may be less likely to make unnecessary and often destructive
changes to their investment plans.
We’ve Been Through This Before
We feel badly about our recent performance and obviously wish we’d done many things differently, but
we are not at all discouraged, as we’ve been through this before. If you look at our performance table at
the beginning of this letter, you will see that we’ve lost more money, much faster, on two other occasions:
we were down 27.4% in eight months from June 2002 – January 2003, and down 32.8% in five months
from October 2008 – February 2009. In both of these cases, by playing a strong hand and buying more of
our favorite stocks as they plunged, we made back all of the losses (and then some) remarkably quickly:
in only nine months in 2002-03 and a mere seven months in 2008-09. We could not be more confident
that we will rebound strongly from our latest losses as well.
This chart compares our fund’s performance over our worst five months last year from May through
September 2011 to the five months from October 2008 through February 2009:
0 1 2 Month 3 4 5
0%
-5%
May - Sept 2011
-10%
-15%
-20%
October 2008 -
February 2009
-25%
-30%
-35%
There are striking parallels between these two five-month periods. In both cases:
We identified and invested in materially undervalued stocks, but with the benefit of hindsight
(which is always 20/20), we bought too early, as we didn’t fully appreciate how much stocks
-5-
6. would tumble amidst the market turmoil – in other words, we bought cheap stocks, but they
became much cheaper;
We maintained our conviction in the great majority of our holdings and kept adding to many of
them at lower and lower prices, reducing our average cost significantly;
Our largest position (mid-teens percentage) was Berkshire Hathaway;
We made significant investments in the most out-of-favor U.S. financial and consumer-related
sectors;
We purchased a number of what we call mispriced options such as General Growth Properties in
early 2009, which turned into the biggest winner in our fund’s history (today we own a few similar
situations);
We ended the five-month periods with similar positioning: at the end of February 2009, our fund
was 113% long by 55% short, whereas at the end of September 2011 it was 119% long by 50%
short.
Our actions paid off last time, and we’re confident that they will again (though we can’t predict the
timing). This chart shows our fund’s performance in the subsequent seven months in 2009 and in the last
three months:
5%
Month
0%
0 1 2 3 4 5 6 7 8 9 10 11 12
-5%
-10%
May - Dec 2011
-15%
-20%
October 2008 -
September 2009
-25%
-30%
-35%
-6-
7. How We’ve Built Our Business
Armed with the knowledge that we are certain to underperform at times, we’ve built our business to
withstand such periods. As Warren Buffett said at the 2009 Berkshire Hathaway annual meeting, “You
don’t want to be in a position where someone can pull the rug out from under you or, emotionally, where
you pull it out from under yourself.” Here are the key ways in which we’ve done this:
1. We read constantly, with an emphasis on company and industry reports, market history, and
lessons from the greatest value investors. We do everything we can to tune out the short-term
noise so, for example, we almost never watch financial television.
2. We have never pursued hot money and, while that’s cost us in terms of assets under management,
today we’re happy to say that we have no fund of funds or any institutional money whatsoever.
All of our investors are investing their own money, with no intermediaries.
3. Our redemption terms – either full redemption once a year or ¼ redemptions quarterly, with 45
days notice – have also no doubt cost us substantial assets, but ensure that investors who choose to
redeem, which tends to happen when our performance is worst, can’t pull the rug out from under
us.
4. We’ve done everything we can think of to build a level of trust with our investors. We know of no
other fund that communicates with as much openness, depth, and frequency as we do. We want
our investors to understand what we’re doing so that when tough times come, they stay (or even
add to their investments).
Thanks to these steps – and thanks to you – we were able to play a strong hand during recent periods of
market turmoil and are confident that we will all ultimately be rewarded for this.
Economic Overview and Our Fund’s Positioning
In September, we attended a private dinner with Warren Buffett, who, thanks to Berkshire Hathaway’s
numerous operating businesses, has his finger on the pulse of the American economy better than perhaps
anyone. In response to a question about whether he’s still bullish on economic growth prospects for the
U.S. over the next 2-3 years, he replied:
Sure, and over the next six months for that matter. We have 70-plus businesses and about five of them are
related to residential home construction and they are flat on their rears, as they have been for more than
three years. But the other 60-plus are doing very well, as is the rest of American business.
We have three jewelry businesses with over 300 stores and I thought same store sales might be down in
August and September, but they were up significantly. We have a number of furniture businesses – and
people don’t have to buy furniture – and their same stores sales are up significantly. We are seeing good
business across the board except for residential home construction.
Buffett is only one of many data points we use in forming our economic views, but most of what we’re
seeing is consistent with his remarks. To be sure, economic growth is tepid, unemployment remains
stubbornly high, and consumer confidence, spending, and the housing market are quite weak, but
corporate profits and profit margins are at all-time highs and corporate balance sheets are extremely
strong, so it’s a mixed picture. Overall, however, the U.S. economy is hanging in there – for now. Those
last two words are key, of course. The market is always forward looking and investors are very worried
-7-
8. about various storm clouds on the horizon, especially the sovereign debt crisis in Europe and signs that, in
China, growth is slowing and/or a real estate bubble may be bursting.
We are closely monitoring developments and have been increasing our short exposure selectively, but we
remain substantially net long – as of the end of 2011, our fund was 142% long and 69% short (76% net
long) – because, unlike 2008, when we were convinced that the bursting of the housing bubble was going
to lead to a major shock to the system, today we think that the most likely scenario is that the U.S.
economy will muddle along for the next few years – hitting air pockets on occasion, no doubt, but
avoiding any major crises. Under this scenario, the market will likely be choppy and range-bound, not
steeply declining, in which case we expect our portfolio to do well.
Winners and Losers in 2011
Here are our 10 biggest losing positions last year, with the percentage losses to our fund:
1. Iridium -3.3%
2. Grupo Prisa -2.8%
3. Berkshire Hathaway -2.3%
4. Netflix -2.2%
5. Seagate -1.9%
6. Howard Hughes -1.8%
7. CIT Group -1.7%
8. dELiA*s -1.7%
9. Citigroup -1.4%
10. Microsoft -1.4%
These stocks accounted for the great majority – 21 percentage points – of our losses last year. Offsetting
this were almost no winners on the long side – here are our ten largest, which generated only 5 percentage
points of gains:
1. J.C. Penney 1.7%
2. MGIC 0.7%
3. Jeffries 0.5%
4. Dell 0.5%
5. SanDisk 0.4%
6. Kraft 0.4%
7. AB-InBev 0.3%
8. ADP 0.3%
9. Echostar 0.2%
10. Wells Fargo 0.2%
What can we learn from this? First, the paucity of winners is striking – and very unusual. In 2010, for
example, we had plenty of losing positions on the long side – Target alone cost us 3.3 percentage points
of return – but they were more than offset by four big winners:
-8-
9. 1. General Growth Props. 8.1%
2. Berkshire Hathaway 5.4%
3. Liberty Acquis. Warrants 5.2%
4. BP 4.3%
In 2011, we had no material winners other than J.C. Penney – but we don’t think this is a permanent state
of affairs.
A second thing to note is that we’ve made no single, obvious mistake. For example, unlike a number of
well-known funds that have performed poorly last year, we weren’t heavily exposed to financial stocks
early in the year.
Finally, and most importantly, as noted above, we think nearly all of our losses last year are temporary.
We continue to hold – and in many cases have added to – substantial positions in eight of our ten largest
losing positions last year (we no longer own Seagate and CIT Group). Thus, we believe the losses we’ve
taken to date will ultimately become large profits.
How We Approach Investment Decision Making Today
It is possible – indeed, almost certain – that we will be wrong in our assessment of one or more of these
positions. But rest assured that we aren’t clinging to them, refusing to acknowledge our mistakes, in an
irrational attempt to make back our losses. Instead, we are pretending like it didn’t happen. Seriously.
Allow us to explain…
Beyond the financial impact, we have our reputations on the line, take pride in what we do, and know
most of our investors personally, so we feel like we’ve let our friends and families down – a truly lousy
feeling. Given this, it would be very easy to fall into a number of mental traps: self-pity, obsessing about
what we could have done differently, going to cash or a market neutral position or, most dangerously, the
opposite: swinging for the fences in an attempt to quickly make back the losses. We are doing none of
this. Instead, we’re carefully evaluating our entire portfolio with the following question in mind: if we
were starting our fund from scratch today and held only cash, what would we do?
The answer is that our portfolio would look just like it does. It hasn’t been this attractive since the market
bottom in early 2009 – it’s not quite as cheap as it was then, to be sure, but the risks of a systemic
meltdown and another Great Depression aren’t nearly as great either. Simply put, we think every
significant position in our fund could easily double in the next 2-3 years, with the possible exception of
our safest big-cap stocks, which “only” have 50-80% upside.
-9-
10. Discussion of Our 15 Largest Long Positions
In Appendix A, we discuss our 15 largest long positions across all three hedge funds we manage, which
are (in descending order of size, as of 12/31/11):
Position 2011 Performance*
1) Berkshire Hathaway -4.7%
2) J.C. Penney 8.5%
3) Iridium stock/warrants -6.5%/-39.7%
4) Citigroup -44.4%
5) Howard Hughes -18.8%
6) Dell 8.0%
7) SanDisk -1.3%
8) Grupo Prisa (PRIS & PRIS.B) -49.3%
9) Goldman Sachs -46.3%
10) Netflix -60.6%
11) Microsoft -7.0%
12) Pep Boys -18.1%
13) MRV Communications -25.4%
14) AB InBev 6.8%
15) Wells Fargo -11.0%
* Certain positions were acquired during 2011, such that the 2011 performance does not reflect our actual gains or losses.
Our 10 Largest Short Positions
Our 10 largest short positions as of the end of 2011 were (in alphabetical order): Ethan Allen, First Solar,
Garmin, Green Mountain Coffee Roasters (see Appendix C), InterOil (discussed in our July and
November letters1), ITT Educational Services, Lululemon Athletica, Nokia, PVH Corp., and
Salesforce.com (discussed in our July letter).
Quarterly Conference Call
We will be hosting our Q4 conference call from noon-1:30pm EST on Thursday, January 12th. The call-in
number is [the call is only open to T2 investors]. As always, we will make a recording of the call
available to you shortly afterward.
Conclusion
We want to acknowledge and thank Damien Smith, who has been an outstanding analyst for us for nearly
nine years, and Kelli Alires, who does a fabulous job as office manager and handling investor relations.
Thank you for your continued confidence in us and the fund. As always, we welcome your comments so
please don’t hesitate to call us at (212) 386-7160.
Sincerely yours,
Whitney Tilson and Glenn Tongue
1
To access our private web site, the user name is tilson and the password is funds.
-10-
11. Appendix A: 15 Largest Long Positions
Notes: The stocks are listed in descending order of size as of 12/31/11.
1) Berkshire Hathaway
The Berkshire juggernaut continues to roll along and we have increased our estimate of intrinsic value to
nearly $172,000/A share, yet the stock languishes at $115,000, so we see 50% upside (even before
factoring in continued growth of intrinsic value, which we peg at approximately 10% annually). More
than $1 billion per month from Berkshire’s operating businesses is pouring into Omaha every month for
Warren Buffett to allocate, and he’s doing a great job of this.
Other than perhaps a lingering effect from the Sokol affair (which we discussed in our March letter), the
only reason we can think of for the stock’s recent weakness is that earnings were impacted by insurance
losses from the tsunami in Japan, the earthquake in New Zealand, flooding in Australia, and a dozen $1+
billion-in-claims natural disasters in the U.S., among others. Losses from such events are a normal part of
the super-cat insurance business, so it doesn’t affect our estimate of Berkshire’s intrinsic value – in fact,
we welcome the recent losses, which will hopefully reduce the excess capacity and soft pricing in the
industry, which hurts Berkshire.
In September Berkshire Hathaway issued a press release announcing an open-ended share repurchase
program. This was a bold statement by the world’s savviest investor, Warren Buffett, who said a number
of important things, not only to Berkshire shareholders, but to investors in general. Overall, it made us
even more bullish on the stock and, though it was already our largest position, we added to it as we think
this effectively put a floor on the stock price slightly below the current level, while the upside remains
large. See Appendix B for further comments in an article we published on the share repurchase
announcement.
We have posted a detailed slide presentation of our analysis of Berkshire at:
www.tilsonfunds.com/BRK.pdf.
2) J.C. Penney
Given our many investments over the years in the retail sector, of course we’d looked at J.C. Penney
periodically, but nothing got us excited about the company (or the stock) until Pershing Square Capital
Management and Vornado Realty Trust took more than a 25% stake in the company and, soon thereafter,
the CEOs of both organizations, Bill Ackman and Steve Roth, respectively, joined the J.C. Penney board.
We got even more excited when the company announced the hiring of a new CEO, Ron Johnson, the
architect of Apple’s retail strategy, who we believe is the best retail CEO in the world. Obviously they’re
completely different businesses, but we like the fact that J.C. Penney, which has sales per gross square
foot of $153, has brought in a new CEO who was responsible for building from scratch Apple’s retail
business, which generates $4,355 per square foot (28x higher).
We think J.C. Penney is a good business (contrary to popular perception, this is nothing like Sears/K-
Mart) with plenty of room for improvement, run by a new team of world-class people with
complementary skills: a capital allocator (Ackman), real estate expert (Roth), and retail CEO (Johnson).
-11-
12. The stock tumbled to below $24 in August, so we took advantage and added meaningfully to the position,
which has worked out well so far, as the stock finished the year at $35.15.
We presented our analysis of JCP at a conference in October:
www.tilsonfunds.com/T2PartnersValueInvestingCongressPresentation-10-18-11.pdf.
3) Iridium
Iridium operates a constellation of low-earth orbiting satellites that provide worldwide real-time data and
voice capabilities over 100% of the earth. The company delivers secure mission-critical communications
services to and from areas where landlines and terrestrial-based wireless services are either unavailable or
unreliable. It is one of two major players in the Global Satellite Communications industry.
The company has a tumultuous history. Originally a division of Motorola, Iridium spent $5 billion
launching satellites in the late 1990s, but filed for bankruptcy in 1999 with only 50,000 customers due to
too much debt and clunky phones that didn’t work inside buildings. Since then, however, Iridium has
thrived. It is growing very rapidly and is taking market share from its competitors.
The company went public in late September, 2009 by merging with a Special Purpose Acquisition
Company (SPAC) and the stock has been weak since then, despite recently reporting strong results.
Iridium’s stock jumped after the company reported very strong earnings on November 8th. The company
soundly beat analysts’ estimates and its own guidance for revenue, margins, EBITDA, and subscriber
growth, with particular strength in both the machine-to-machine and legacy commercial voice product
lines. Operational EBITDA margin hit a new high of 53.5% and management raised its 2011 outlook for
subscriber growth (up 25% year over year) and operational EBITDA (up 20% year-over-year to ~$190
million). As an added bonus, the company said it would pay “negligible cash taxes from 2011 to
approximately 2020.”
We think this earnings report should assuage the concerns we’ve heard from investors and analysts, and
are optimistic that it will prove to be a turning point for the stock, which we believe is deeply
undervalued.
We continue to believe that this is an excellent company and that the stock is extremely undervalued.
Comparable businesses are trading at 10x EV/EBITDA, while Iridium, which is growing significantly
faster than and taking share from its competitors, trades at under 4x EBITDA. Finally, we are encouraged
by the recent large insider purchases by both the CEO and Chairman of the company.
We’ve posted a slide presentation on Iridium at: www.tilsonfunds.com/IRDM-4-11.pdf.
4) Citigroup
This is perhaps the most controversial stock we own, as the consensus view on the company couldn’t be
more negative, but we have a different view.
We think of Citigroup as two businesses: good bank (Citicorp) and bad bank (Citi Holdings). The former
is a fabulous worldwide franchise that generates robust and growing profits that could easily approach
$10/share within a few years (net income was $1.51/share in Q3 – more than $6/share annualized).
Citicorp has been strongly profitable for more than two years, with the majority of (highly stable) profits
coming from high-growth emerging markets, as this chart shows:
-12-
13. In particular, consumer banking has been exceptionally strong: North American consumer banking had
$2.3 billion of net credit margin in Q3, up 28% year over year, and international consumer banking had
$4.1 billion of net credit margin, up 14%. In addition, net income in the Securities and Banking division
rose 58% to $2.1 billion.
Ah, but what about bad bank? Citigroup is rapidly shrinking Citi Holdings via sales, charge-offs and
runoff, as this chart shows:
(1) Peak quarter
-13-
14. Losses at Citi Holdings have also been shrinking thanks to lower expenses, credit losses, and loan loss
reserves:
But what about the balance sheet? Might Citigroup need to raise additional capital or require another
government bailout? We think not. Here are Citigroup’s key capital metrics, which are quite strong and
trending positively:
Overall, we like what we see: good bank is thriving, bad bank is shrinking and reducing losses, and the
balance sheet is in good shape. The current headlines are grim – and may remain so for some time – but
we think the stock more than discounts this: at $26.31, it trades at a 57% and 47% discount to book and
tangible book value, respectively, and at a mere 6.5x estimated 2011 earnings.
-14-
15. For another way to see how cheap the stock is, consider that it has returned to levels not seen since the
depths of the financial crisis in early 2009, yet both the company and macro environment are much
stronger:
We think tangible book value per share, which was $49.50 in Q3, up 11% year over year, will continue to
grow and that the stock is worth at least 1.0x tangible book, so we think it’s a good bet to double in the
next few years.
Note that Goldman, Citigroup and the other financial stocks we own should benefit over time from many
of their competitors encountering distress or even going out of business. As examples, Goldman no
longer has to compete against Bear Stearns or Lehman Brothers, Citigroup should be able to take share in
Europe from its weakened competitors, and Wells Fargo no longer has to compete against Washington
Mutual.
5) The Howard Hughes Corp.
When General Growth Properties emerged from bankruptcy in early November, 2010, it did so as two
companies: GGP, which had all of the best malls, and HHC, a collection of master planned communities,
operating properties, and development opportunities in 18 states. Many of these properties are generating
few if any cash flows and are thus very hard to value, but we think the company has undervalued, high-
quality real estate assets in premier locations and that there are many value-creating opportunities can be
tapped. We estimate intrinsic value at $77-$141 vs. the current price of $44.17.
We presented our analysis of HHC at a conference in July: www.tilsonfunds.com/T2PartnersPresentation-
7-13-11.pdf.
6) Dell
The stocks of many big-cap tech companies appear to be very cheap, but we think caution is in order as
there are plenty of value traps. We own the stocks of two great companies in the sector, where we think
the pessimism is unwarranted: Microsoft (discussed below) and Dell, which we aggressively purchased
beginning in August after the company reported Q2 earnings on Aug. 16th that we thought were excellent,
but the market disagreed and the stock dropped 10% the next day. Revenues were up only 1%, but
operating income jumped 54%, net income 63% and EPS 71%, thanks to sharply higher margins. This is
the result of a deliberate strategy by the company to give up low-margin business and focus on earnings
-15-
16. growth rather than revenue growth. This is exactly the right strategy, we believe, so we’re not concerned
that Dell revised “its full-year revenue-growth outlook to 1-5 percent from the previous range of 5-9
percent,” which is why the stock sold off. We’re delighted that Dell is disciplined enough to walk away
from low-margin business.
In Q3 it was more of the same, as revenues were flat yet adjusted net income and EPS rose 12% and 20%,
respectively. Dell ended the quarter with $7.8 billion of net cash, equal to $4.24/share or 29% of the
current stock price of $14.63, meaning the enterprise value of the business is only $10.39/share. With
expected earnings this year of $2.11/share, the stock, net of cash, is trading at a P/E of only 4.9x, which is
ridiculously cheap. We think a reasonable P/E multiple for Dell is 10-15x, not 5x, so the stock has huge
upside in our opinion.
We have posted our latest slides on Dell at: www.tilsonfunds.com/Dell-T2analysis-10-11.pdf.
7) SanDisk
SanDisk produces flash memory storage (also called NAND), which is used in a wide range of devices for
which traditional spinning disk storage isn’t appropriate: digital cameras, USB drives, iPads and other
tablets, iPhones and other smartphones, and certain lightweight laptop computers like MacBook Airs and
the new Ultrabook PCs. Flash memory is much more expensive, but is more compact and durable and
offers faster access, so its usage has grown dramatically with the proliferation of mobile computing.
We discovered SanDisk as we researched the storage industry in the context of our investments in Seagate
and Western Digital. We decided to sell these stocks because we decided there was too much of a risk
that they would turn into value traps, as flash memory took greater and greater market share over time.
The beneficiary of this, of course, is SanDisk and its peers.
Historically, the flash memory business has been commodity-like, with chronic excess capacity and
rapidly declining prices. Due to industry consolidation and explosive growth in end demand, however,
we think SanDisk is on the verge of very strong secular growth, with improving margins, which should
lead to explosive profit growth and a meaningful revaluation of the stock. The best stocks are ones that
combine high earnings growth and an expanding multiple on those earnings, and we think SanDisk is
poised for both.
Best of all, we don’t have to pay for this growth. Though the stock has risen smartly from its August lows
around $32 to close the year at $49.21, it’s still only trading at 10.7x 2011 estimates of $4.58. In addition,
the company has $3.7 billion of net cash, equal to 31% of its $12 billion market cap. Adjusting for this,
the stock is only trading at 7.4x earnings.
8) Grupo Prisa
Grupo Prisa is a Spanish media conglomerate with a good business but a bad balance sheet in a troubled
part of the world. Spain, which accounts for 70% of Prisa’s business, is going through a crisis similar to
the one the U.S. went through in late 2008, so it’s not surprising that the stock is suffering. It’s also not
surprising that the company’s operating performance has been affected by the deep recession in its
primary markets, though the company is holding up remarkably well in light of this: in the first three
quarters of 2011, adjusted revenues were down only 1.0%, adjusted EBITDA rose 1.9%, and the
company’s restructuring and cost-cutting is on track.
Grupo Prisa received a boost in November when Mexican billionaire Carlos Slim acquired a 3.2% stake.
-16-
17. Here is a Wall St. Journal article about it:
WSJ, DEALS & DEAL MAKERS
NOVEMBER 18, 2011, 9:50 A.M. ET
Slim Buys Stake in Spain's El Pais
By DAVID ROMAN And ANA GARCIA
MADRID—A company owned by Mexican billionaire Carlos Slim has acquired a 3.2% stake in Spain's media group
Promotora de Informaciones SA, in an unexpected move into one of the economies at the forefront of the euro zone's debt
crisis.
Mr. Slim, one of the world's richest men, bought the stake through Inmobiliaria Carso SA de CV, a firm which he controls,
according to regulatory filings released Friday. Mr. Slim has also used Carso to build up a 8.1% stake in New York Times
Co., the publisher of the New York-based daily.
Inmobiliaria Carso didn't disclose how much it paid for the stake. At current market prices, it is worth €12.5 million (about
$17 million). The shares of Prisa, as the Spanish company is known, jumped on the news of Mr. Slim's purchase, and they
last traded up 13% at €0.85, valuing the entire company at €383.2 million.
For Madrid-based Prisa, the country's largest media group, Mr. Slim's move is a much-needed show of backing. The
company, owner of Spain's best-selling newspaper El Pais, has been restructuring and shedding assets in recent years as it
seeks to reduce its heavy debt load.
As in the case of the New York Times Co., Prisa's share price has struggled recently. El Pais has suffered a dip in sales, as
well as a revenue squeeze owing to lower advertising. El Pais sells around 370,000 newspapers a day.
Late last year, Prisa announced a plan to lay off 2,500 staff through the first quarter of 2012. This came after U.S.
investment fund Liberty Acquisition Holdings Corp. bought a majority stake in the firm for some €650 million.
This is Mr. Slim's first foray in Spain's media sector, which until recently was flushed with cash owing to the country's
long-running property bubble. The sector is now in dire straits because large corporate and government advertisers have
cut down on investments sharply, just as Internet competition and a drop in spending by highly indebted households has
lowered demand for newspapers.
Prisa, haunted by a series of bad investments, has been Spain's largest media company for decades. Besides El Pais, it also
owns Cadena Ser, Spain's largest radio network by audience, and the profitable publisher Santillana, which has a large
foothold in Latin America.
Prisa reported more good news last week when it announced that it refinanced its debt to give it at least
two more years of breathing room to get through the current crisis.
Prisa reminds us of our experience with Huntsman in late 2008 and early 2009. Both companies have
strong management and assets, yet are in economically sensitive businesses and have too much debt. In
both cases, we calculated intrinsic value of more than $15/share in any kind of normal economic
environment, but the stocks got hammered as the economic environment deteriorated and investors
panicked.
Here’s the stock chart for Huntsman in the four months from November 2008 through February 2009:
-17-
18. The stock chart for Prisa (the B shares, which comprise the bulk of our holdings) since June looks very
similar:
We’re optimistic that Prisa will rebound, as Huntsman did – it was a 7-bagger in one year and nearly a 10-
bagger in less than two years, as this chart shows:
We presented our analysis of Prisa and its value at the Value Investing Congress on October 13, 2010:
www.tilsonfunds.com/Octpres.pdf (pages 32-46). We also recommend this May 7th article in Barron’s
entitled Read All About It: A Solid Spanish Media Play: http://bit.ly/barronsprisa.
-18-
19. 9) Goldman Sachs
Goldman, like nearly all of its peers, is going through a very difficult period of market turmoil, especially
in Europe, and regulatory uncertainty, which is depressing revenues and profits. In Q3, revenues fell 60%
and net earnings fell from $1.7 billion to minus $428 million year over year. ROE in the first three
quarters of 2011 (excluding a dividend related to the redemption of preferred stock) was a mere 6.0%, and
we anticipate that the Dodd-Frank Act and other regulation means that the business will likely never be as
profitable as it was in its glory days.
So why would we want to own this stock? Because when the dust settles, we think Goldman will remain
the premier investment banking franchise in the world and should be able to earn at least mid-teens ROE,
in which case it’s worth a substantial premium to book value, which as of the end of Q3 stood at $131.09
(tangible book was $120.41). (And we think book is good, as Goldman is more aggressive in writing
down assets and marking them to true market prices than anyone.) Thus, at $90.43, a 31% discount to
book (and a 25% discount to tangible book), we think the stock is a steal.
10) Netflix
We wrote at length about Netflix in our November letter and, in addition, published an article entitled
“Why We’re Long Netflix and Short Green Mountain Coffee Roasters” (attached in Appendix C).
11) Microsoft
Microsoft continues to put up solid growth and remains one of the most remarkable cash generating
machines in history, yet it gets no respect, which is why we call it the Rodney Dangerfield of the stock
market. The consensus view is that Microsoft is a fading giant, doomed to a future of lower market share,
sales, margins and profits. It is of course possible to concoct such a scenario – people have been doing it
for well over a decade – but there is little current evidence to support it. Microsoft’s market share in its
key business areas is stable or rising, and sales, margins and profits are growing nicely. We think there is
solid growth in store for Microsoft, as numerous areas of its business are booming.
In the company’s latest earnings release, revenues were up 7% and EPS grew 10%, while the company’s
cash hoard (including “equity and other investments” and subtracting debt) rose to $54.1 billion or
$6.37/share, 25% of the stock price of $25.96. Net of cash, the stock trades for 7.3x trailing EPS of
$2.69, which is much too cheap.
We have posted our latest slides on Microsoft at: www.tilsonfunds.com/MSFT-10-11.pdf. We also
recently published a letter from another hedge fund manager, Ivory Capital, calling on Microsoft to adopt
a better capital allocation strategy, which we agree with: http://seekingalpha.com/article/279061-why-
microsoft-should-borrow-heavily-to-buy-back-shares.
12) Pep Boys
Pep Boys provides automotive repair and maintenance services, tires, parts, and accessories via more than
7,000 service bays in more than 700 locations in 35 states and Puerto Rico. The stock trades at less than
5x EV/EBITDA, less than half its peer group, and margins are also roughly half its peer group, so we
think there’s potential to close both of these discrepancies. Additionally, we think there’s downside
protection from Pep Boys’s real estate, which was recently valued at nearly the entire enterprise value of
the company.
-19-
20. 13) MRV Communications
MRV Communications operates in the network communications industry. The company grew rapidly
over the last decade, but did it the wrong way – by making a number of high-priced, ill-fated
acquisitions. MRV lost control of its business, became delinquent on its financial filings, and stock was
delisted. Over the last two years, an activist investment group gained control of the board, stabilized the
company, divested several underperforming divisions, and brought the financials up to par.
The company now consists of two operating divisions, network equipment group and network integration
group, which we believe are worth at least $1/share. After the recent special dividend of $0.475/share, the
company still has approximately $0.50/share of cash and substantial NOLs, and we estimate the intrinsic
value of the company to be in excess of $1.50 per share (without incorporating the NOLs) vs. the current
share price of $0.86.
We were part of an activist group during 2011 and are working hard to unlock MRV’s value.
14) Anheuser-Busch Inbev
AB InBev is the world’s largest brewer, managing a portfolio of approximately 200 brands that includes
Budweiser, Bud Light, Michelob, Stella Artois and Beck’s. 13 brands have over $1 billion in sales and in
its top 31 markets, AB InBev is #1 or #2 in 25 of them. We think the beer business is very stable, with
slow growth in most of the world’s largest markets, but with high growth potential in certain developing
markets like China. Comparable businesses in our minds would be Coca Cola and McDonald’s. This
type of stable, dominant business gives us the confidence to project earnings and cash flows many years
into the future, and we expect that we might hold this stock for a long time.
We think AB InBev’s management team is among the finest we’ve ever invested alongside. They are
renowned for being both great operators and also ruthless cost cutters – and there’s a lot of fat to cut in the
recently acquired Anheuser Busch business, which should lead to substantial cost savings (and a resulting
jump in earnings).
We estimate pro forma free cash flow at $5.66/share in 2012. At a 14-16 multiple, that’s $79-$91/share,
30%-50% above 2011’s closing price of $60.99.
We presented AB InBev at the Value Investing Seminar on July 13, 2010:
www.tilsonfunds.com/Julypres.pdf (pages 9-26).
15) Wells Fargo
We made a lot of money on Wells Fargo during the financial crisis, shorting it around $30 after the
Wachovia acquisition, covering around $10, and then buying the stock and riding it back to well above
$20 (we dedicated an entire chapter of our book, More Mortgage Meltdown: 6 Ways to Profit in These
Bad Times, to Wells Fargo; please contact us if you’d like us to send you a free copy of the book in the
mail, or the Wells Fargo chapter via email).
We were nervous about the housing market so we sold Wells Fargo along with most other financial stocks
in 2010, but we are great admirers of the company and think it’s the best banking franchise by far among
the large U.S. banks, so we were hoping for a pullback in the stock to reestablish a position. That
opportunity came in August when the stock tumbled nearly 20% at one point and fell below $23.
The stock rallied a bit to $27.56 by the end of the year, but it still trades at 9.8x depressed 2011 earnings.
-20-
21. Appendix B
Berkshire Hathaway’s New Share Repurchase Program – And What It Means
September 26, 2011
http://seekingalpha.com/article/296012-berkshire-hathaway-s-new-share-repurchase-program-and-what-
it-means
This morning Berkshire Hathaway issued a press release announcing an open-ended share repurchase
program. This is a bold statement by the world’s savviest investor, Warren Buffett, who is saying a
number of important things, not only to Berkshire shareholders, but to investors in general. Overall, it
makes us even more bullish on the stock and, though it was already our largest position, we added to it
this morning as we think this effectively puts a floor on the stock price slightly above the current level,
while the upside remains large.
Interestingly, this is only the second time that Buffett has offered to buy back stock. The first was in his
1999 Letter to Berkshire Hathaway Shareholders (pages 16-17), which was released on Saturday, March
11, 2000 (not coincidentally, the very moment that the Nasdaq peaked). At the time, the stock was at
$41,300, but it popped 8% on the following Monday and continued rising all week, closing the following
Friday at $51,300, up 24.2%, so Buffett didn’t end up buying back any stock. This chart shows how the
stock performed in the subsequent year, rising 72% vs. an 11% decline in the S&P 500:
We wouldn’t be surprised to see similar outperformance over the coming year.
Turning to today’s press release, here’s the full text:
Berkshire Hathaway Authorizes Repurchase Program
Omaha, NE (NYSE: BRK.A; BRK.B)—Our Board of Directors has authorized Berkshire Hathaway to repurchase
Class A and Class B shares of Berkshire at prices no higher than a 10% premium over the then-current book value of
the shares. In the opinion of our Board and management, the underlying businesses of Berkshire are worth
considerably more than this amount, though any such estimate is necessarily imprecise. If we are correct in our
opinion, repurchases will enhance the per-share intrinsic value of Berkshire shares, benefiting shareholders who retain
their interest.
-21-
22. Berkshire plans to use cash on hand to fund repurchases, and repurchases will not be made if they would reduce
Berkshire’s consolidated cash equivalent holdings below $20 billion. Financial strength and redundant liquidity will
always be of paramount importance at Berkshire. Berkshire may repurchase shares in open market purchases or
through privately negotiated transactions, at management’s discretion. The repurchase program is expected to
continue indefinitely and the amount of purchases will depend entirely upon the levels of cash available, the
attractiveness of investment and business opportunities either at hand or on the horizon, and the degree of discount
from management’s estimate of intrinsic value. The repurchase program does not obligate Berkshire to repurchase any
dollar amount or number of Class A or Class B shares.
Buffett undoubtedly wrote this press release and, as all long-time Buffett-watchers know, he careful
chooses every word so let’s closely examine what he wrote and what it means.
Most importantly, Buffett is saying that the stock is deeply undervalued. He wouldn’t be buying it back at
a 10% premium to book value if he thought its intrinsic value was, say, 20% or even 30% above
book. How undervalued? Well, the press release says: “the underlying businesses of Berkshire are worth
considerably more than” a 10% premium to book value. The word “considerably” is critical because it’s
unnecessary – it’s Buffett’s way of saying the stock isn’t just cheap, but is screaming cheap. We peg
intrinsic value at close to $170,000 ($113/B share) – as we outline in our slide deck here – and we think
that the announcement today indicates that Buffett thinks it’s in this range as well.
So up to what price is Buffett willing to buy? (Note that of course it’s actually Berkshire that’s buying
back the stock, not Buffett himself, but he is setting the policy and is the largest shareholder, with a 23%
economic ownership, so it’s effectively him.) The press release says a 10% premium to “then-current
book value.” The latest filing is the end of Q2 (June 30), when Berkshire’s book value was $98,716
($65.81/B share). But this isn’t the current value, so one needs to consider what book value has done
since then. There are a lot of moving pieces, but the main factors are that the stock portfolio and index
puts have moved against Berkshire a bit, but the company has earned nearly three months of profits, so
net net we’d guess that book value today has declined slightly to perhaps $97,000 ($64.67/B
share). Thus, a 10% premium means that Buffett is willing to buy back stock up to $106,700 ($71.13/B
share), less than 2% below today’s closing price of $108,449 ($72.09/B share).
In other words, you can buy the stock at almost the same price that the world’s greatest investor is willing
to pay – quite an opportunity we think.
We also believe that the share repurchase program likely puts a floor on the stock for a number of
reasons. First, unlike most share repurchase announcements, there’s no dollar or time limit – Berkshire is
free to repurchase as much stock as Buffett wishes, for as long as he wishes, as long as the price is below
110% of book value. Second, as we discuss below, Buffett likely wants to buy back a lot stock. Finally,
Berkshire has enormous liquidity to do so. According to Berkshire’s Q2 10-Q (posted here), the company
has $43.2 billion of cash (excluding railroads, utilities, energy, finance and financial products), plus
another $34.8 billion in bonds (nearly all of which are short-term, cash equivalents), which totals $77
billion. In the press release, Buffett notes that “repurchases will not be made if they would reduce
Berkshire’s consolidated cash equivalent holdings below $20 billion,” so that means Berkshire has $57
billion, equal to one-third of the company’s current market capitalization, that it can deploy immediately
in investments or share repurchases. On top of this, the company generated more than $6.5 billion in free
cash flow in the first half of the 2011 – that’s right, more than $1 billion/month is pouring into Omaha.
Why is Buffett buying back his stock and, in particular, why now? To answer these questions, let’s look
again at his 1999 Letter to Berkshire Hathaway Shareholders, in which he wrote:
-22-
23. There is only one combination of facts that makes it advisable for a company to repurchase its shares: First, the
company has available funds — cash plus sensible borrowing capacity — beyond the near-term needs of the business
and, second, finds its stock selling in the market below its intrinsic value, conservatively-calculated.
…You should be aware that, at certain times in the past, I have erred in not making repurchases. My appraisal of
Berkshire’s value was then too conservative or I was too enthused about some alternative use of funds. We have
therefore missed some opportunities — though Berkshire’s trading volume at these points was too light for us to have
done much buying, which means that the gain in our per-share value would have been minimal. (A repurchase of, say,
2% of a company’s shares at a 25% discount from per-share intrinsic value produces only a ½% gain in that value at
most — and even less if the funds could alternatively have been deployed in value-building moves.)
Some of the letters we’ve received clearly imply that the writer is unconcerned about intrinsic value considerations but
instead wants us to trumpet an intention to repurchase so that the stock will rise (or quit going down). If the writer
wants to sell tomorrow, his thinking makes sense — for him! — but if he intends to hold, he should instead hope the
stock falls and trades in enough volume for us to buy a lot of it. That’s the only way a repurchase program can have
any real benefit for a continuing shareholder.
We will not repurchase shares unless we believe Berkshire stock is selling well below intrinsic value, conservatively
calculated. Nor will we attempt to talk the stock up or down. (Neither publicly or privately have I ever told anyone to
buy or sell Berkshire shares.) Instead we will give all shareholders — and potential shareholders — the same
valuation-related information we would wish to have if our positions were reversed.
…Please be clear about one point: We will never make purchases with the intention of stemming a decline in
Berkshire’s price. Rather we will make them if and when we believe that they represent an attractive use of the
Company’s money. At best, repurchases are likely to have only a very minor effect on the future rate of gain in our
stock’s intrinsic value.
So Buffett is clearly not trying to prop up the stock – rather, he believes that at a price below 110% of
book value, buying it today is “an attractive use of the Company’s money.” He is also implicitly saying
that he wants to buy back a lot of stock – otherwise it would only have “a very minor effect on the future
rate of gain in our stock’s intrinsic value.”
But in being willing to allocate capital to share repurchases, is Buffett also running up the white flag,
admitting that he can’t find better things to do with Berkshire’s money? He admits in his 1999 letter that
when the stock was cheap in the past, he didn’t buy it because he “was too enthused about some
alternative use of funds.” So why is he willing to buy it now?
The answer is, in part, that Berkshire has become so large that only very large investments – say, $5
billion and up – can move the needle, which means the investment universe is smaller, making it harder
for Buffett to find exceptional bargains. But the bigger reason is that Berkshire is drowning in so much
cash and free cash flow that Buffett doesn’t have to choose: he can buy back billions – even tens of
billions – of his stock and also have plenty of dry powder to do what he prefers: make large
investments. In other words, he can have his cake and eat it too.
To understand why, consider Berkshire’s largest acquisition ever, by far: the acquisition of Burlington
Northern, which cost $26.5 billion for the 77.4% that Berkshire didn’t own, of which $15.9 billion was
cash and the balance was Berkshire stock. Today, Berkshire could buy three Burlington Northerns (at
$15.9 billion in cash each) and still have more than $10 billion left over to buy back stock while retaining
$20 billion in cash on the balance sheet. It’s simply remarkable…
We interpret today’s announcement as not only a bullish statement by Buffett regarding Berkshire’s stock,
but also about the markets in general because Buffett wouldn’t even consider buying back his stock if he
-23-
24. thought there was even, say, a 20% chance that the world – and major stocks markets – were going to go
off a cliff, as they did in late 2008 and early 2009. At that time, he was able to invest more than $50
billion at distressed prices, which Buffett much prefers to buying back his own stock, so Buffett is clearly
saying that he thinks we’ll muddle through and that a major market correction is quite unlikely.
-24-
25. Appendix C
Why We’re Long Netflix and Short
Green Mountain Coffee Roasters
November 13, 2011
T2 Partners LLC
The GM Building
767 Fifth Avenue, 18th Floor
New York, NY 10153
(212) 386-7160
Info@T2PartnersLLC.com
-25-
26. Netflix and Green Mountain Coffee Roasters are former market darlings whose stocks have collapsed in
recent months, wiping out a combined $23.2 billion in market capitalization from their peaks ($11.7 and
$11.5 billion, respectively). By many metrics, both stocks appear cheap and the terrible headlines are
attractive to value investors like us, who like to buy when others are selling in a panic. For example, BP
was one of our biggest winners in 2010 (click here to read our analysis at the time). The company, its
CEO and the stock were all universally hated, with endless negative headlines (similar to Netflix today),
which provided a wonderful opportunity to buy the stock far below its intrinsic value. We love situations
like this – as long as we’re convinced that there’s a good company and a cheap stock once one cuts
through all of the noise.
So are Netflix and Green Mountain similar opportunities today? Yes and no. We’ve analyzed both
companies carefully and concluded that Netflix is an attractive investment at today’s price, so funds we
manage own the stock, but Green Mountain isn’t, we remain short it. Allow us to explain why.
Similarities
The stocks of both Netflix and Green Mountain over the past three months have suffered similar declines,
as this chart shows:
In addition, the companies are remarkably similar in revenues and profitability over the past 12 months:
NFLX GMCR
Revenues $2,925 $2,651
Operating Income $393 $369
Net Income $238 $201
Operating Margin 13.4% 13.9%
Net Margin 8.1% 7.6%
All figures are in millions, over the trailing 12 months
Yet here the similarities end. Let’s take a look at both companies.
-26-
27. Netflix
When Netflix fell 35% in one day last month to under $80, we purchased it aggressively, not as a short-
term trade, but with a multi-year horizon. Over the next few quarters, the company will likely lose money
as it invests in international growth and struggles to overcomes its missteps over the past few months.
Ultimately, however, we think Netflix is an excellent company and that the market has overreacted to all
of the recent negative news, thereby providing us the chance to own it at a cheap price, for reasons we
discussed in our October letter to investors.
Green Mountain
In contrast, we are not only still short Green Mountain’s stock, but it remains our largest short position,
even after last Thursday’s 40% decline. Our reasons are superbly articulated in the 110-slide presentation
that Greenlight Capital’s David Einhorn gave on the company at the Value Investing Congress last month.
Even if you don’t have a position in the stock, it’s worth studying as a brilliant piece of analytical work –
and it’s a must-read if you have a position. Although we were already short Green Mountain, after seeing
Einhorn’s presentation we concluded that it was an even better short than we realized and increased the
size of our investment, which has paid off handsomely.
There’s a saying that pigs get fed and hogs get slaughtered, so why don’t we cover our short and take our
profits? After all, the stock, at $43.71, is now trading at “only” 16.8x the midpoint of the company’s
guidance for next year, and at 12.5x Einhorn’s estimate of the company’s long-term earnings power of
$3.50 (see page 66 of his presentation).
The answer is that we think only the first shoe has dropped and there are more to come.
Netflix vs. Green Mountain
Here is a summary of our concerns about Green Mountain, with a comparison to Netflix:
Green Mountain gave strong guidance for next quarter and year, which we think, in light of the
company’s performance last quarter, is too high and will need to be reset downward. Analysts
remain bullish. In contrast, Netflix has given very poor – and, we believe, conservative –
guidance that we think the company can exceed, and analysts are significantly more bearish.
Though it has similar revenues and profits, Green Mountain’s market cap, at $7.0 billion, is nearly
50% higher than Netflix’s $4.7 billion, which means there’s more downside and less likelihood of
an acquisition.
Green Mountain’s business is highly dependent on two key patents, both of which expire on
September 16, 2012. Contrary to the company’s and bullish analysts’ views, we believe that soon
after these patents expire, there will be significant competitive pressures that will meaningfully
impact Green Mountain’s profitability and growth. Netflix faces no patent risk though it, too,
faces many competitive threats.
There is an ongoing SEC investigation at Green Mountain and we think Einhorn’s presentation
provides a detailed roadmap that will, in our opinion, likely lead the SEC to uncover various
accounting shenanigans. Netflix faces no such risk.
Green Mountain has spent $1.4 billion in cash on three richly-priced acquisitions over the past two
years, which raises questions about organic growth and earnings quality. Einhorn notes: “The
-27-
28. very high allocations to Goodwill raise suspicion about subsequent earnings quality.” (See page 53
of his presentation.) In contrast, Netflix has made no acquisitions in recent years.
Green Mountain inventories and cap ex have been growing much faster revenues: last year, on a
95% revenue increase, inventories rose 156% from $262 million to $672 million, while cap ex
rose 125% from $126 million to $283 million. The result has been severely negative free cash
flow and a significant worsening of the balance sheet over the past two years, which raises
questions about how the company will fund its cap ex plans for next year. The trends at Netflix
are precisely the opposite.
Netflix vs. Green Mountain: A Comparison of Balance Sheets and Cash Flows
The last bullet point warrants further discussion because, while the two companies have similar income
statements, their balance sheets and cash flows diverge massively. Netflix has a healthy net cash position
of $166 million, while Green Mountain has $561 million in net debt. And Netflix has healthy operating
cash flow, which substantially exceeds both net income and cap ex, resulting in free cash flow of $201
million, whereas Green Mountain is the reverse, with free cash flow of minus $282 million. This chart
shows the data for both companies over the past 12 months:
NFLX GMCR
Cash & Cash Equiv* $366 $13
Debt $200 $574
Net Cash (Debt) $166 ($561)
Operating Cash Flow $349 $1
Cap Ex** $148 $283
Free Cash Flow $201 ($282)
* For GMCR, excludes $28M of restricted cash
** For NFLX, cap ex includes "Acquisitions of DVD content library"
All figures are in millions, over the trailing 12 months
The balance sheet and cash flow numbers are critical because both companies are making large
investments to grow their businesses: in Netflix’s case, signing deals for streaming content and growing
internationally and, in Green Mountain’s case, primarily to “increase our portion pack packaging” and
“expand our physical plants.” Both companies (and stocks) are at risk if they run into trouble financing
these investments.
Given Netflix’s strong balance sheet and free cash flow, we think it’s highly likely that the company will
be able to fund its growth, even if it loses more subscribers than the company (and we) expect (within
reason). In contrast, Green Mountain is at much higher risk, both because of higher planned expenses and
also a far weaker balance sheet and cash flow statement.
As noted above, in last week’s earnings release, Green Mountain said “For fiscal 2012, we currently
expect to invest between $630.0 million to $700.0 million in capital expenditures to support the
Company’s future growth.” That’s a huge amount of money for a company that only had $201 million of
net income last year and less than $1 million of operating cash flow.
Our question is, where are they going to get the money? They’ve guided to $2.55-$2.65 in EPS in the
next 12 months, but we are highly skeptical that the company will meet this guidance, and it also excludes
-28-
29. some very real cash expenses like “acquisition-related transaction expenses; legal and accounting
expenses related to the SEC inquiry and the Company’s pending litigation.” In addition, the company’s
balance sheet is consuming huge amounts of cash: due mainly to the rise in inventories and, to a lesser
extent, accounts receivable, operating cash flow over the last 12 months was a mere $785,000 – basically
zero. Nor was this an exception: in the prior year, the company had $80 million in net income yet
operating cash flow of minus $3 million. On top of this are numerous richly priced acquisitions, which
consumed $908 million in cash last year and $459 million the year before.
To summarize, over the last two years, Green Mountain has generated $281 million of net income, yet lost
$2 million of operating cash flow, plus spent $410 million on cap ex and another $1,367 million on
acquisitions – a total cash burn of $1.8 billion! This chart shows the company’s accelerating cash burn
over the past three years:
GMCR ('09) GMCR ('10) GMCR ('11)
Operating Cash Flow $38 ($3) $1
Cap Ex $48 $126 $283
Free Cash Flow ($10) ($129) ($282)
Acquisitions $41 $459 $908
FCF Minus Acquisitions ($51) ($588) ($1,190)
So how has Green Mountain funded these huge cash flow deficits? By using cash, taking on debt, and
issuing stock. Over the past two years, the company has seen its net cash position go from +$164 million
to -$561 million, a swing of $725 million, plus it’s raised $990 million by selling stock, as this chart
shows:
GMCR ('09) GMCR ('10) GMCR ('11)
Cash & Cash Equiv* $242 $4 $13
Debt $78 $354 $574
Net Cash (Debt) $164 ($350) ($561)
Issuance of Common Stock $395 $9 $981
* Excludes restricted cash
In summary, we question how Green Mountain will fund its $630-$700 million cap ex plan over the next
12 months. Even if one believes the midpoint of the company’s guidance of $2.60/share, this only
translates into $414 million of net income, plus the balance sheet is likely to continue consuming cash.
We think investors will not look kindly on more debt, nor issuing stock at depressed prices, yet the
company almost certainly will have to do one or the other.
Conclusion
We’re long Netflix because we think the bad news is out, we like the company’s balance sheet and cash
flows, and see few red flags. In contrast, with Green Mountain, we think there is much more bad news to
come, are very concerned about the company’s balance sheet and cash flows, and see many red flags.
-29-
30. T2 Accredited Fund, LP (the “Fund”) commenced operations on January 1, 1999. The Fund’s investment
objective is to achieve long-term after-tax capital appreciation commensurate with moderate risk,
primarily by investing with a long-term perspective in a concentrated portfolio of U.S. stocks. In carrying
out the Partnership’s investment objective, the Investment Manager, T2 Partners Management, LLC,
seeks to buy stocks at a steep discount to intrinsic value such that there is low risk of capital loss and
significant upside potential. The primary focus of the Investment Manager is on the long-term fortunes of
the companies in the Partnership’s portfolio or which are otherwise followed by the Investment Manager,
relative to the prices of their stocks.
There is no assurance that any securities discussed herein will remain in Fund’s portfolio at the time you
receive this report or that securities sold have not been repurchased. The securities discussed may not
represent the Fund’s entire portfolio and in the aggregate may represent only a small percentage of an
account’s portfolio holdings. It should not be assumed that any of the securities transactions, holdings or
sectors discussed were or will prove to be profitable, or that the investment recommendations or decisions
we make in the future will be profitable or will equal the investment performance of the securities
discussed herein. All recommendations within the preceding 12 months or applicable period are available
upon request.
Performance results shown are for the T2 Accredited Fund, LP and are presented net of management fees,
brokerage commissions, administrative expenses, other operating expenses of the Fund, and accrued
performance allocation or incentive fees, if any. Net performance includes the reinvestment of all
dividends, interest, and capital gains. Performance for the most recent month is an estimate.
The fee schedule for the Investment Manager includes a 1.5% annual management fee and a 20%
incentive fee allocation. For periods prior to June 1, 2004, the Investment Manager’s fee schedule
included a 1% annual management fee and a 20% incentive fee allocation, subject to a 10% “hurdle”
rate. In practice, the incentive fee is “earned” on an annual, not monthly, basis or upon a withdrawal from
the Fund. Because some investors may have different fee arrangements and depending on the timing of a
specific investment, net performance for an individual investor may vary from the net performance as
stated herein.
The return of the S&P 500 and other indices are included in the presentation. The volatility of these
indices may be materially different from the volatility in the Fund. In addition, the Fund’s holdings differ
significantly from the securities that comprise the indices. The indices have not been selected to represent
appropriate benchmarks to compare an investor’s performance, but rather are disclosed to allow for
comparison of the investor’s performance to that of certain well-known and widely recognized indices.
You cannot invest directly in these indices.
Past results are no guarantee of future results and no representation is made that an investor will or is
likely to achieve results similar to those shown. All investments involve risk including the loss of
principal. This document is confidential and may not be distributed without the consent of the Investment
Manager and does not constitute an offer to sell or the solicitation of an offer to purchase any security or
investment product. Any such offer or solicitation may only be made by means of delivery of an
approved confidential offering memorandum.
-30-