SlideShare ist ein Scribd-Unternehmen logo
1 von 9
Downloaden Sie, um offline zu lesen
Whitney R. Tilson                                                                                      phone: 212 277 5606
Managing Partner                                                                                 WTilson@KaseCapital.com

April 3, 2013

Dear Partner:

Our fund is off to a solid start to the year, rising 6.7% in the first quarter vs. 10.6% for the S&P
and 11.9% for the Dow.

The fund s returns were driven by nice gains across most of the long portfolio, with a special
mention for Netflix, which more than doubled. Here is the Q1 performance of all 11 long stock
positions in the fund as of the beginning of the year (disclosed in the 2012 annual letter), plus
two new stocks I bought during the quarter (ranked in descending order of current size):

    1. AIG                                                  10.0%
    2. Berkshire Hathaway                                   16.6%
    3. Howard Hughes                                        14.8%
    4. Deckers                                              34.9%*
    5. Citigroup                                            11.8%
    6. Goldman Sachs                                        15.4%
    7. Netflix                                             104.4%
    8. Canadian Pacific                                     28.4%
    9. dELiA*s                                             -15.4%
    10. Iridium                                            -10.3%
    11. Grupo Prisa (B)                                     16.0%
    12. Sears Hometown & Outlet Stores                      -5.2%*
    13. Spark Networks                                      -9.7%
* Performance since the position was established. Note that this excludes two private placements in Spencer Holdings and the
Japan side fund.

The two headwinds to the portfolio during the quarter (both discussed below) were cash, which
comprised about a third of the fund, and the short book, which averaged approximately 20% of
the fund. The fund is currently 66% long and 22% short.

Two New Long Positions: Deckers and Sears Hometown & Outlet Stores
I m pleased that I was able to identify two compelling new stocks to add to our portfolio during
the quarter a satisfactory pace in light of the complacent market in which the major indices are
near all-time highs.

Deckers
Deckers is best known for its UGG brand, which accounted for 95% of sales last quarter. The
brand has been around since California surfers started wearing UGG boots in the late 1970s, but
UGGs really became a fashion trend (some would say a fad) a few years ago, which resulted in
the stock soaring nearly 10-fold from early 2009 to late 2011, peaking at close to $120. And then


                    Carnegie Hall Tower, 152 West 57th Street, 46th Floor, New York, NY 10019
the bottom fell out. The company reported steadily worse results as 2012 progressed and the
stock plunged to under $30 by the end of last October.

Even at its low point, however, the company was not only profitable, but had double-digit profit
margins, high returns on equity, and a strong balance sheet, so the question for investors was: are
UGGs a fad that will largely disappear (think Heelys), as the many people who are short the
stock believe (short interest was 40.5% of the float as of 3/15/13), or will UGGs prove to be an
enduring brand that s simply encountered some short-term turbulence? If so, then the stock
which was around $40 when I was analyzing the company two months ago trading at just over
10x depressed earnings, was a bargain.

The company attributed its weak results to three primary factors:

   1. One of the warmest winters ever in 2011;
   2. The price of sheepskin (the primary raw material in UGG boots) rising 80% due to floods
      in Australia that decimated sheep herds; and
   3. The economic weakness in Europe.

These are all true statements but was the company just making excuses to cover up the fact that
the fad had passed and nobody wanted to wear UGGs anymore? To answer this question, I
designed a survey (click here to see it) and sent it out to my various email lists. The 274
responses (posted here) I received were very revealing:

       60% of respondents owned UGGs classic sheepskin boots, 48% owned more than one
       UGGs product, and 78% had owned an UGGs product for at least two years.
       When asked how highly they would recommend UGGs to a friend (on a scale of 1-10),
       25% gave UGGs a perfect 10 and an additional 45% rated UGGs 7-9. 70% said they were
       certain (25%) or likely (35%) to buy UGGs again. These are satisfied customers.
       When asked whether they view their Uggs more as a fashion product or a
       utilitarian/functional product, 74% said the latter, and when asked how their views
       about Uggs changed over the past year, 65% said no change, 20% said more positive,
       and only 15% said more negative. These responses are not consistent with a fad product
       that s going away.

The comments in the open response part of the survey also reinforced my thesis that most
customers love their UGGs and would continue to buy, wear, and recommend them.

The survey was the final piece of evidence that confirmed my investment thesis that, while
UGGs may have become faddish for a while, the core brand and products were strong and
Deckers was mostly suffering from short-term issues, so I purchased the stock, which has risen
34.9% in the two months since then.

Sears Hometown & Outlet Stores
I also added Sears Hometown & Outlet Stores (SHOS) to the portfolio during the quarter. Last
October, Sears Holdings spun off SHOS, which is comprised of four divisions:


                                            -2-
Sears Outlet: 127 warehouse style stores, all but three of which are company owned,
       selling mostly scratched, dented, refurbished and old model appliances at steep discounts;
       $564 million in sales and $42.1 million in operating income in 2012;
       Sears Hometown Stores: 943 stores, all but one operated by franchisees, selling mostly
       appliances, lawn & garden, and tools, typically in small, rural markets (average store
       size: 8,500 sq. ft.) in all 50 states, Puerto Rico and Bermuda;
       Sears Hardware Stores: 90 stores in 16 states, 33 company owned, 57 franchised,
       selling similar merchandise as Hometown stores, but in bigger markets (average store
       size: 28,000 sq. ft.), similar to ACE Hardware;
       Sears Home Appliance Showrooms: 85 stores in 22 states, 27 company owned, 58
       franchised, selling strictly appliances in a 5,000 sq. ft. showroom.

The latter three, under the Sears Hometown and Hardware segment, had sales of $1.9 billion and
operating income of $57.4 million in 2012.

This might not sound like a good business, but keep in mind that 85% of the company s 1,245
total stores are franchised, meaning the franchisees put up the money and do the hard work,
while the SHOS simply collects a royalty on all this effort an excellent business.

SHOS has strong growth potential management has indicated that the company could more
than double its store count to 3,000 stores. As an independent company, management now has
appropriate incentives, and SHOS is also benefitting from Sears closing large numbers of its
mainline stores (it closed 1,462 stores in FY 2012, 36% of its total). In fact, given that Sears s
controlling shareholder and CEO, Eddie Lampert, owns a 62% stake in SHOS (larger than
Lampert s 56% stake in Sears itself), it appears that Lampert may be quietly adopting a strategy
of closing unprofitable full-size Sears stores and effectively transferring to SHOS the sales (and
profits) of Sears s best businesses, its appliances and other hard goods sold under top brands like
Kenmore and Craftsman. If so, this will provide a substantial long-term tailwind to SHOS, as
Sears had $40 billion in sales in 2012 vs. only $2.5 billion for SHOS.

If SHOS is such an attractive company, why is it only my 12th largest position (approximately
2%)? The answer is valuation. By the time I discovered this investment, the stock had run up
from under $30 at the time of the spinoff to over $40, leaving less margin of safety. At its current
price of $40, the company has an enterprise value of around $1 billion vs. 2012 operating income
of $99.5 million and adjusted EBITDA of $109.8 million. I think earnings will grow
substantially in years to come, so 9x trailing EBITDA is a reasonable multiple, but it s not cheap
enough to make it a full position so I ve established a starter position and am hoping the market
gives me the opportunity at some point to buy a lot more at a better price.

Short Book
Here is the first quarter performance of the three shorts I disclosed in my 2012 annual letter:

   1. InterOil                                  37.1%
   2. K-12                                      18.0%
   3. Nokia                                    -17.0%


                                             -3-
Their performance was quite representative of the 10 stocks that comprise our current short book
  while a few worked, most ran up along with the market. I remain highly confident that every
one of our short positions is vastly overvalued and there are catalysts that will cause the stocks to
tumble, but over a short period when the market is ripping upward and complacency abounds,
our short book is going to be a headwind.

Thoughts on Q1 Performance, Risks, and the Sustainability of Corporate Profit M argins
In the first sentence of this letter, I describe our Q1 performance as solid. In light of the fact
that our fund trailed the major indices, some might challenge this view, so allow me to explain.
First and foremost, my goal is to preserve capital and, secondly, to earn a satisfactory rate of
return. I achieved both of these objectives in Q1 hence the word solid. In general, our fund
will likely not keep up with the market when it is rising rapidly because I usually hold some cash
and always have a decent-sized short book.

This is not an ideal environment for a value investor like me because to find wonderful bargains
it helps to have some distress in the market or at least some area of the market but there s
very little of this today. The major indices are at or near all-time highs and, for example, the
VIX, a volatility measure of the S&P 500, dropped 30% during the first quarter. Nevertheless,


I spend almost all of my time doing bottoms-up analysis of companies and industries, but as I
construct the overall portfolio and determine how aggressively or conservatively to position the
fund, I am guided by Buffett s simple maxim: Be fearful when others are greedy and greedy
when others are fearful.

                                                              ck market bubble (the bond market is
another matter!), but our fund is quite conservatively positioned right now because valuations are
full, complacency is high, and bargains are scarce and there are plenty of things that could
change this. In addition to the usual risk factors (a tepid economy recovery in the U.S., possibly
dependent on unsustainable money printing and deficit spending; the ongoing recession in
Europe; a potential mother-of-all-real-estate/infrastructure bubbles bursting in China; and a
bankrupt Japan), who was even thinking about the risks associated with Cyprus or war breaking
out on the Korean Peninsula until very recently? Donald Rumsfeld
                                                                     well.

The critical question for U.S. stocks is whether corporate profit margins can remain at today s
all-time-high levels. This chart shows profit margins (before depreciation, interest, and tax, as a
percent of output) going back to 1929:


                                             -4-
As you can see, historically, when margins have peaked, they ve soon reverted to the mean. If
this happens again, stocks could be in for some rough sledding. If so, I believe we are well
positioned to take advantage due to our significant cash balance and relatively low market
exposure.

Privacy Policy and Updated Form ADV
Once a year, we are required to send you a copy of our Privacy Policy, so it s attached in
Appendix A. In addition, our latest Form ADV is posted at: www.tilsonfunds.com/ADV.pdf.

Conclusion
Thank you for your confidence and support. If you have any comments or questions, please call
me anytime on my cell phone at (646) 258-0687.

Sincerely yours,


Whitney Tilson


                                           -5-
The unaudited return for the Kase Fund versus major benchmarks (including reinvested
dividends) is:
                                                                               Q1                        Since Inception
Kase Fund net                                                                  6.7%                          124.7%
S&P 500                                                                       10.6%                           65.7%
Dow                                                                           11.9%                          121.6%
Past performance is not indicative of future results. Please refer to the disclosure section at the end of this letter. The Kase Fund
was launched on 1/1/99.

                                          Kase Fund Performance (Net) Since I nception
           200

           180

           160

           140

           120

           100
    (% ) 80

           60

           40

           20

            0

           -20

           -40
             Jan-99 Jan-00 Jan-01 Jan-02 Jan-03 Jan-04 Jan-05 Jan-06 Jan-07 Jan-08 Jan-09 Jan-10 Jan-11 Jan-12 Jan-13
                                                                                        Kase Fund                                    S& P 500
Past performance is not indicative of future results.

                             Kase Fund M onthly Performance (Net) Since I nception
              1999      2000      2001      2002      2003      2004      2005      2006      2007      2008      2009      2010      2011      2012      2013
            Kase S& P Kase S& P Kase S& P Kase S& P Kase S& P Kase S& P Kase S& P Kase S& P Kase S& P Kase S& P Kase S& P Kase S& P Kase S& P Kase S& P Kase S& P
            Fund 500 Fund 500 Fund 500 Fund 500 Fund 500 Fund 500 Fund 500 Fund 500 Fund 500 Fund 500 Fund 500 Fund 500 Fund 500 Fund 500 Fund 500
January     7.8    4.1    -6.3   -5.0   4.4    3.6    -1.8   -1.5   -5.5   -2.6   4.7    1.8    1.1    -2.4   1.9    2.7    2.4    1.7    1.9    -5.9   -3.6   -8.4   -1.6   -3.6   -2.8   2.4    12.6   4.5    4.5   5.2

February    -2.9   -3.1   6.2    -1.9   -0.6   -9.2   -1.1   -2.0   2.9    -1.6   7.0    1.5    2.1    2.0    -3.1   0.2    -3.3   -2.1   -6.9   -3.3   -8.9 -10.8 7.3       3.1    4.1    3.4    -0.8   4.3    0.8   1.4

M arch      4.1    4.0    10.3   9.8    -2.6   -6.4   3.0    3.7    1.4    0.9    3.9    -1.5   3.9    -1.7   3.9    1.3    -0.8   1.1    -2.3   -0.5   2.9    9.0    4.6    6.0    -4.1   0.0    10.9   3.3    1.3   3.8

April       2.1    3.7    -5.1   -3.0   5.1    7.8    -0.2   -6.0 10.5     8.2    2.4    -1.5   0.6    -1.9   2.2    1.4    4.4    4.6    -0.9   4.9    20.1   9.6    -2.1   1.6    1.9    3.0    1.3    -0.6

M ay        -5.7   -2.5   -2.8   -2.0   1.8    0.6    0.0    -0.8   6.6    5.3    -1.4   1.4    -2.6   3.2    1.8    -2.9   2.5    3.3    7.9    1.2    8.1    5.5    -2.6   -8.0   -1.9   -1.1 -13.6 -6.0

June        2.2    5.8    4.1    2.4    4.6    -2.4   -7.3   -7.1   2.9    1.3    0.1    1.9    -3.1   0.1    -0.2   0.2    -3.0   -1.5   -1.2   -8.4   -5.0   0.2    4.5    -5.2   -2.4   -1.7   0.5    4.1

July        -0.7   -3.2   -3.6   -1.6   -1.1   -1.0   -5.0   -7.9   2.3    1.7    4.6    -3.4   0.5    3.7    -0.9   0.7    -5.4   -3.0   -2.5   -0.9   6.8    7.6    3.5    7.0    -4.6   -2.0   0.2    1.4

August      4.1    -0.4   5.4    6.1    2.5    -6.3   -4.3   0.5    0.4    1.9    -0.9   0.4    -3.2   -1.0   2.9    2.3    1.7    1.5    -3.3   1.3    6.3    3.6    -1.5   -4.5 -13.9 -5.4      -7.2   2.3

September -3.3     -2.7   -7.2   -5.3   -6.1   -8.1   -5.4 -10.9 1.7       -1.0   -1.6   1.1    -1.5   0.8    5.0    2.6    -1.1   3.6    15.9 -9.1     5.9    3.7    1.7    8.9    -9.3   -7.0   0.0    2.6

October     8.1    6.4    -4.5   -0.3   -0.8   1.9    2.8    8.8    6.2    5.6    -0.4   1.5    3.5    -1.6   6.3    3.5    8.2    1.7 -12.5 -16.8 -1.9        -1.8   -1.7   3.8    7.0    10.9   1.6    -1.9

November    2.8    2.0    -1.5   -7.9   2.3    7.6    4.1    5.8    2.2    0.8    0.8    4.0    3.1    3.7    1.9    1.7    -3.6   -4.2   -8.9   -7.1   -1.2   6.0    -1.9   0.0    -0.6   -0.2   -4.5   0.6

December    9.8    5.9    2.3    0.5    6.5    0.9    -7.4   -5.8   -0.4   5.3    -0.2   3.4    -1.3   0.0    1.4    1.4    -4.3   -0.7   -4.0   1.1    5.5    1.9    0.5    6.7    0.1    1.0    0.1    0.9
YTD
            31.0 21.0 -4.5 -9.1 16.5 -11.9 -22.2 -22.1 35.1 28.6 20.6 10.9                      2.6    4.9    25.2 15.8 -3.2       5.5 -18.1 -37.0 37.1 26.5 10.5 15.1 -24.9 2.1                  -1.7 16.0     6.7   10.6
TOTAL

Past performance is not indicative of future results.
Note: Returns in 2001, 2003, and 2009 reflect the benefit of the high-water mark, assuming an investor at inception.


                                                                                                 -6-
Appendix A
                                      PRI VACY POLI CY

This privacy policy explains the manner in which the Partnership, the General Partner and the
Investment Manager (collectively, the Partnership ) collect, utilize and maintain nonpublic
personal information about the Partnership s investors, as required under Federal legislation.

Collection of I nvestor I nformation
The Partnership collects nonpublic personal information about its investors mainly through the
following sources: Subscription forms, investor questionnaires a nd other information provided
by the investor in writing, in person, by telephone, electronically or by any other means. This
information includes name, address, nationality, tax identification number and financial and
investment qualifications; and transactions within the Partnership, including account balances,
investments and withdrawals.

Disclosure of Nonpublic Personal I nformation

The Partnership does not sell or rent investor information. The Partnership does not disclose
nonpublic personal information about its investors to nonaffiliated third parties or to affiliated
entities, except as permitted by law. For example, the Partnership may share nonpublic personal
information in the following situations:

       To service providers in connection with the administration and servicing of the
       Partnership, which may include attorneys, accountants, auditors and other professionals.
       The Partnership may also share information in connection with the servicing or
       processing of Partnership transactions;
       To 3rd party marketing firms who have been engaged by the Investment Manager to raise
       assets for the Partnership. Any information provided to a 3rd party marketing firm would
       be limited to name and basic contact information.
       To affiliated companies in order to provide you with ongoing personal advice and
       assistance with respect to the products and services you have purchased through the
       Partnership and to introduce you to other products and services that may be of value to
       you;
       To respond to a subpoena or court order, judicial process or regulatory authorities;
       To protect against fraud, unauthorized transactions (such as money laundering), claims or
       other liabilities; and
       Upon consent of an investor to release such information, including authorization to
       disclose such information to persons acting in a fiduciary or representative capacity on
       behalf of the investor.

If you elect to opt-out and do not want us to share your non-public personal information other
than when required to perform normal services or when required by law, please contact us at:
Carnegie Hall Tower, 152 West 57th Street, 46th Floor, New York, New York 10019, Ph: (212)


                                            -7-
277-5606 or by email: kalires@kasecapital.com.

Protection of I nvestor I nformation
The Partnership s policy is to require that all employees, financial professionals and companies
providing services on its behalf keep client information confidential.

The Partnership maintains safeguards that comply with federal standards to protect investor
information. The Partnership restricts access to the personal and account information of investors
to those employees who need to know that information in the course of their job responsibilities.
Third parties with whom the Partnership shares investor information must agree to follow
appropriate standards of security and confidentiality.

The Partnership s privacy policy applies to both current and former investors. The Partnership
may disclose nonpublic personal information about a former investor to the same extent as for a
current investor.

Changes to Privacy Policy
The Partnership may make changes to its privacy policy in the future. The Partnership will not
make any change affecting you without first sending you a revised privacy policy describing the
change.


                                            -8-
The T2 Accredited Fund, LP (dba the Kase Fund) (the Fund ) commenced operations on January 1,
1999. The Fund s investment objective is to achieve long-term after-tax capital appreciation
commensurate with moderate risk, primarily by investing with a long-term perspective in a concentrated
portfolio of U.S. stocks. In carrying out the Partnership s investment objective, the Investment Manager,
T2 Partners Management, LP (dba Kase Capital Management), seeks to buy stocks at a steep discount to
intrinsic value such that there is low risk of capital loss and significant upside potential. The primary
focus of the Investment Manager is on the long-term fortunes of the companies in the Partnership s
portfolio or which are otherwise followed by the Investment Manager, relative to the prices of their
stocks.

There is no assurance that any securities discussed herein will remain in Fund s portfolio at the time you
receive this report or that securities sold have not been repurchased. The securities discussed may not
represent the Fund s entire portfolio and in the aggregate may represent only a small percentage of an
account s portfolio holdings. The material presented is compiled from sources believed to be reliable and
honest, but accuracy cannot be guaranteed.

It should not be assumed that any of the securities transactions, holdings or sectors discussed were or will
prove to be profitable, or that the investment recommendations or decisions we make in the future will be
profitable or will equal the investment performance of the securities discussed herein. All
recommendations within the preceding 12 months or applicable period are available upon request. Past
results are no guarantee of future results and no representation is made that an investor will or is likely to
achieve results similar to those shown. All investments involve risk including the loss of principal.

Performance results shown are for the Kase Fund and are presented net of all fees, including management
and incentive fees, brokerage commissions, administrative expenses, and other operating expenses of the
Fund. Net performance includes the reinvestment of all dividends, interest, and capital gains.

The fee schedule for the Investment Manager includes a 1.5% annual management fee and a 20%
incentive fee allocation. For periods prior to June 1, 2004 and after July 1, 2012, the Investment
Manager s fee schedule included a 1% annual management fee and a 20% incentive fee allocation. In
practice, the incentive fee is earned on an annual, not monthly, basis or upon a withdrawal from the
Fund. Because some investors may have different fee arrangements and depending on the timing of a
specific investment, net performance for an individual investor may vary from the net performance as
stated herein.

The return of the S&P 500 and other indices are included in the presentation. The volatility of these
indices may be materially different from the volatility in the Fund. In addition, the Fund s holdings differ
significantly from the securities that comprise the indices. The indices have not been selected to represent
appropriate benchmarks to compare an investor s performance, but rather are disclosed to allow for
comparison of the investor s performance to that of certain well-known and widely recognized indices.
You cannot invest directly in these indices.

This document is confidential and may not be distributed without the consent of the Investment Manager
and does not constitute an offer to sell or the solicitation of an offer to purchase any security or
investment product. Any such offer or solicitation may only be made by means of delivery of an approved
confidential offering memorandum.


                                                 -9-

Weitere Àhnliche Inhalte

Was ist angesagt?

ppt on coca cola
ppt on coca colappt on coca cola
ppt on coca colaNaved Qureshi
 
Relaxo cinderella
Relaxo cinderellaRelaxo cinderella
Relaxo cinderellaSanjay Bakshi
 
wholefoodsmarket presentation_AM07
wholefoodsmarket presentation_AM07wholefoodsmarket presentation_AM07
wholefoodsmarket presentation_AM07finance44
 
Tanger Presentation - Final
Tanger Presentation - FinalTanger Presentation - Final
Tanger Presentation - FinalCarter Chen
 
What Is Price To Earnings Or Pe Ratio?
What Is Price To Earnings Or Pe Ratio?What Is Price To Earnings Or Pe Ratio?
What Is Price To Earnings Or Pe Ratio?Peter Lim
 
20010430 bonding with iceland
20010430 bonding with iceland20010430 bonding with iceland
20010430 bonding with icelandMar Wolfgang Mixa
 
Mergers and acquisitions in oil and gas
Mergers and acquisitions in oil and gasMergers and acquisitions in oil and gas
Mergers and acquisitions in oil and gasSemalytix
 
Kraft Heinz Investment Memo - Hamidi
Kraft Heinz Investment Memo - HamidiKraft Heinz Investment Memo - Hamidi
Kraft Heinz Investment Memo - HamidiAchraf Hamidi
 
Investment Paper
Investment PaperInvestment Paper
Investment PaperFatima Shaikh
 
Financial Analysis: Kraft Foods Inc. (KFT)
Financial Analysis: Kraft Foods Inc. (KFT)Financial Analysis: Kraft Foods Inc. (KFT)
Financial Analysis: Kraft Foods Inc. (KFT)Yaw Ofosu
 
2006 06-28 Q3 2005/2006 Results
2006 06-28 Q3 2005/2006 Results2006 06-28 Q3 2005/2006 Results
2006 06-28 Q3 2005/2006 ResultsKappAhl
 
H.J. Heinz M&A Board meeting On the Proposed Acquisition
H.J. Heinz M&A  Board meeting On the Proposed AcquisitionH.J. Heinz M&A  Board meeting On the Proposed Acquisition
H.J. Heinz M&A Board meeting On the Proposed AcquisitionDebiprasad Dash
 
Hanesbrands Stock Report
Hanesbrands Stock Report Hanesbrands Stock Report
Hanesbrands Stock Report Miles Lester
 
2017 U.S.Goodwill Impairment Study
2017 U.S.Goodwill Impairment Study2017 U.S.Goodwill Impairment Study
2017 U.S.Goodwill Impairment StudyDuff & Phelps
 

Was ist angesagt? (14)

ppt on coca cola
ppt on coca colappt on coca cola
ppt on coca cola
 
Relaxo cinderella
Relaxo cinderellaRelaxo cinderella
Relaxo cinderella
 
wholefoodsmarket presentation_AM07
wholefoodsmarket presentation_AM07wholefoodsmarket presentation_AM07
wholefoodsmarket presentation_AM07
 
Tanger Presentation - Final
Tanger Presentation - FinalTanger Presentation - Final
Tanger Presentation - Final
 
What Is Price To Earnings Or Pe Ratio?
What Is Price To Earnings Or Pe Ratio?What Is Price To Earnings Or Pe Ratio?
What Is Price To Earnings Or Pe Ratio?
 
20010430 bonding with iceland
20010430 bonding with iceland20010430 bonding with iceland
20010430 bonding with iceland
 
Mergers and acquisitions in oil and gas
Mergers and acquisitions in oil and gasMergers and acquisitions in oil and gas
Mergers and acquisitions in oil and gas
 
Kraft Heinz Investment Memo - Hamidi
Kraft Heinz Investment Memo - HamidiKraft Heinz Investment Memo - Hamidi
Kraft Heinz Investment Memo - Hamidi
 
Investment Paper
Investment PaperInvestment Paper
Investment Paper
 
Financial Analysis: Kraft Foods Inc. (KFT)
Financial Analysis: Kraft Foods Inc. (KFT)Financial Analysis: Kraft Foods Inc. (KFT)
Financial Analysis: Kraft Foods Inc. (KFT)
 
2006 06-28 Q3 2005/2006 Results
2006 06-28 Q3 2005/2006 Results2006 06-28 Q3 2005/2006 Results
2006 06-28 Q3 2005/2006 Results
 
H.J. Heinz M&A Board meeting On the Proposed Acquisition
H.J. Heinz M&A  Board meeting On the Proposed AcquisitionH.J. Heinz M&A  Board meeting On the Proposed Acquisition
H.J. Heinz M&A Board meeting On the Proposed Acquisition
 
Hanesbrands Stock Report
Hanesbrands Stock Report Hanesbrands Stock Report
Hanesbrands Stock Report
 
2017 U.S.Goodwill Impairment Study
2017 U.S.Goodwill Impairment Study2017 U.S.Goodwill Impairment Study
2017 U.S.Goodwill Impairment Study
 

Ähnlich wie Kase capital-q1-2013

Greenlight q3-2013
Greenlight q3-2013Greenlight q3-2013
Greenlight q3-2013Frank Ragol
 
Wrhe 4 q2004 letter
Wrhe 4 q2004 letterWrhe 4 q2004 letter
Wrhe 4 q2004 letterMichael Durante
 
014-017_IW_1602
014-017_IW_1602014-017_IW_1602
014-017_IW_1602Hannah Smith
 
4Q16 SCFG Commentary_with Snapshot
4Q16 SCFG Commentary_with Snapshot4Q16 SCFG Commentary_with Snapshot
4Q16 SCFG Commentary_with SnapshotDrew Beja
 
Michael Durante Western Reserve June 2006 letter
Michael Durante Western Reserve June 2006 letterMichael Durante Western Reserve June 2006 letter
Michael Durante Western Reserve June 2006 letterMichael Durante
 
Analysing the Top 100 Stocks on the ASX Including Insurance & Gold Stocks
Analysing the Top 100 Stocks on the ASX Including Insurance & Gold StocksAnalysing the Top 100 Stocks on the ASX Including Insurance & Gold Stocks
Analysing the Top 100 Stocks on the ASX Including Insurance & Gold StocksInvast Financial Services
 
Real Estate Update 100515
Real Estate Update  100515Real Estate Update  100515
Real Estate Update 100515Jeffrey Leon
 
Quarterly report for our investors - Second Quarter 2019
Quarterly report for our investors - Second Quarter 2019Quarterly report for our investors - Second Quarter 2019
Quarterly report for our investors - Second Quarter 2019BESTINVER
 
Monthly portfolio (november)
Monthly portfolio (november)Monthly portfolio (november)
Monthly portfolio (november)Haris Memon
 
Running Head FINANCIAL RESEARCH REPORT1FINANCIAL RESEARCH RE.docx
Running Head FINANCIAL RESEARCH REPORT1FINANCIAL RESEARCH RE.docxRunning Head FINANCIAL RESEARCH REPORT1FINANCIAL RESEARCH RE.docx
Running Head FINANCIAL RESEARCH REPORT1FINANCIAL RESEARCH RE.docxwlynn1
 
Robinhood a force to be reckoned with
Robinhood a force to be reckoned withRobinhood a force to be reckoned with
Robinhood a force to be reckoned withInitio
 
Measuring the market
Measuring the marketMeasuring the market
Measuring the marketSocial MEDIA
 
LOW, HD, and HI post q2 20
LOW, HD, and HI post q2 20LOW, HD, and HI post q2 20
LOW, HD, and HI post q2 20thomas paulson
 
Sample 1
Sample 1Sample 1
Sample 1123jumpad
 
This paper is due TODAY AT 10.30 PM no later.Complete the follow.docx
This paper is due TODAY AT 10.30 PM no later.Complete the follow.docxThis paper is due TODAY AT 10.30 PM no later.Complete the follow.docx
This paper is due TODAY AT 10.30 PM no later.Complete the follow.docxbrockdebroah
 
Exceptional Stock Market returns in Turbulent Times
Exceptional Stock Market returns in Turbulent TimesExceptional Stock Market returns in Turbulent Times
Exceptional Stock Market returns in Turbulent TimesAtul Khekade
 

Ähnlich wie Kase capital-q1-2013 (20)

Greenlight q3-2013
Greenlight q3-2013Greenlight q3-2013
Greenlight q3-2013
 
Dick Davis Investment Digest Jan. 18, 2012
Dick Davis Investment Digest Jan. 18, 2012Dick Davis Investment Digest Jan. 18, 2012
Dick Davis Investment Digest Jan. 18, 2012
 
Wrhe 4 q2004 letter
Wrhe 4 q2004 letterWrhe 4 q2004 letter
Wrhe 4 q2004 letter
 
014-017_IW_1602
014-017_IW_1602014-017_IW_1602
014-017_IW_1602
 
4Q16 SCFG Commentary_with Snapshot
4Q16 SCFG Commentary_with Snapshot4Q16 SCFG Commentary_with Snapshot
4Q16 SCFG Commentary_with Snapshot
 
aer_0407_trendyinvesting
aer_0407_trendyinvestingaer_0407_trendyinvesting
aer_0407_trendyinvesting
 
Michael Durante Western Reserve June 2006 letter
Michael Durante Western Reserve June 2006 letterMichael Durante Western Reserve June 2006 letter
Michael Durante Western Reserve June 2006 letter
 
aer_0107_investingsmart
aer_0107_investingsmartaer_0107_investingsmart
aer_0107_investingsmart
 
Analysing the Top 100 Stocks on the ASX Including Insurance & Gold Stocks
Analysing the Top 100 Stocks on the ASX Including Insurance & Gold StocksAnalysing the Top 100 Stocks on the ASX Including Insurance & Gold Stocks
Analysing the Top 100 Stocks on the ASX Including Insurance & Gold Stocks
 
Real Estate Update 100515
Real Estate Update  100515Real Estate Update  100515
Real Estate Update 100515
 
Quarterly report for our investors - Second Quarter 2019
Quarterly report for our investors - Second Quarter 2019Quarterly report for our investors - Second Quarter 2019
Quarterly report for our investors - Second Quarter 2019
 
Monthly portfolio (november)
Monthly portfolio (november)Monthly portfolio (november)
Monthly portfolio (november)
 
Running Head FINANCIAL RESEARCH REPORT1FINANCIAL RESEARCH RE.docx
Running Head FINANCIAL RESEARCH REPORT1FINANCIAL RESEARCH RE.docxRunning Head FINANCIAL RESEARCH REPORT1FINANCIAL RESEARCH RE.docx
Running Head FINANCIAL RESEARCH REPORT1FINANCIAL RESEARCH RE.docx
 
Robinhood a force to be reckoned with
Robinhood a force to be reckoned withRobinhood a force to be reckoned with
Robinhood a force to be reckoned with
 
Measuring the market
Measuring the marketMeasuring the market
Measuring the market
 
LOW, HD, and HI post q2 20
LOW, HD, and HI post q2 20LOW, HD, and HI post q2 20
LOW, HD, and HI post q2 20
 
US Strategy Weekly
US Strategy Weekly US Strategy Weekly
US Strategy Weekly
 
Sample 1
Sample 1Sample 1
Sample 1
 
This paper is due TODAY AT 10.30 PM no later.Complete the follow.docx
This paper is due TODAY AT 10.30 PM no later.Complete the follow.docxThis paper is due TODAY AT 10.30 PM no later.Complete the follow.docx
This paper is due TODAY AT 10.30 PM no later.Complete the follow.docx
 
Exceptional Stock Market returns in Turbulent Times
Exceptional Stock Market returns in Turbulent TimesExceptional Stock Market returns in Turbulent Times
Exceptional Stock Market returns in Turbulent Times
 

Mehr von Frank Ragol

Tulip a eur_en
Tulip a eur_enTulip a eur_en
Tulip a eur_enFrank Ragol
 
Oei feb-16
Oei feb-16Oei feb-16
Oei feb-16Frank Ragol
 
Q1 2016-credit third avenue
Q1 2016-credit third avenueQ1 2016-credit third avenue
Q1 2016-credit third avenueFrank Ragol
 
Oei dec-15
Oei dec-15Oei dec-15
Oei dec-15Frank Ragol
 
Oei dec-15
Oei dec-15Oei dec-15
Oei dec-15Frank Ragol
 
Swan aug-15
Swan aug-15Swan aug-15
Swan aug-15Frank Ragol
 
Gdc FI-mayo-2015
Gdc FI-mayo-2015Gdc FI-mayo-2015
Gdc FI-mayo-2015Frank Ragol
 
Oei apr-15
Oei apr-15Oei apr-15
Oei apr-15Frank Ragol
 
30638 tl bill gross investment outlook may 2015-exp 5.30.16_3
30638 tl bill gross investment outlook may 2015-exp 5.30.16_330638 tl bill gross investment outlook may 2015-exp 5.30.16_3
30638 tl bill gross investment outlook may 2015-exp 5.30.16_3Frank Ragol
 
Resultados consolidados banca en españa a 30 septiembre
Resultados consolidados banca en españa a 30 septiembreResultados consolidados banca en españa a 30 septiembre
Resultados consolidados banca en españa a 30 septiembreFrank Ragol
 
Bass cognitive dissonance
Bass cognitive dissonanceBass cognitive dissonance
Bass cognitive dissonanceFrank Ragol
 
Greif inc (spruce point capital)
Greif inc (spruce point capital)Greif inc (spruce point capital)
Greif inc (spruce point capital)Frank Ragol
 
Third point-q4-2014-investor-letter-tpoi
Third point-q4-2014-investor-letter-tpoiThird point-q4-2014-investor-letter-tpoi
Third point-q4-2014-investor-letter-tpoiFrank Ragol
 
Oei 2014-12
Oei 2014-12Oei 2014-12
Oei 2014-12Frank Ragol
 
Skagen global noviembre 14
Skagen global noviembre 14Skagen global noviembre 14
Skagen global noviembre 14Frank Ragol
 
Lessons of oil by howard marks
Lessons of oil by howard marksLessons of oil by howard marks
Lessons of oil by howard marksFrank Ragol
 
Odey absolute return octubre 2014
Odey absolute return octubre 2014Odey absolute return octubre 2014
Odey absolute return octubre 2014Frank Ragol
 
Odey absolute return octubre 2014
Odey absolute return octubre 2014Odey absolute return octubre 2014
Odey absolute return octubre 2014Frank Ragol
 
Gmo qtly letter_3q14_full
Gmo qtly letter_3q14_fullGmo qtly letter_3q14_full
Gmo qtly letter_3q14_fullFrank Ragol
 
Estadistica anual definitiva 2013
Estadistica anual definitiva 2013Estadistica anual definitiva 2013
Estadistica anual definitiva 2013Frank Ragol
 

Mehr von Frank Ragol (20)

Tulip a eur_en
Tulip a eur_enTulip a eur_en
Tulip a eur_en
 
Oei feb-16
Oei feb-16Oei feb-16
Oei feb-16
 
Q1 2016-credit third avenue
Q1 2016-credit third avenueQ1 2016-credit third avenue
Q1 2016-credit third avenue
 
Oei dec-15
Oei dec-15Oei dec-15
Oei dec-15
 
Oei dec-15
Oei dec-15Oei dec-15
Oei dec-15
 
Swan aug-15
Swan aug-15Swan aug-15
Swan aug-15
 
Gdc FI-mayo-2015
Gdc FI-mayo-2015Gdc FI-mayo-2015
Gdc FI-mayo-2015
 
Oei apr-15
Oei apr-15Oei apr-15
Oei apr-15
 
30638 tl bill gross investment outlook may 2015-exp 5.30.16_3
30638 tl bill gross investment outlook may 2015-exp 5.30.16_330638 tl bill gross investment outlook may 2015-exp 5.30.16_3
30638 tl bill gross investment outlook may 2015-exp 5.30.16_3
 
Resultados consolidados banca en españa a 30 septiembre
Resultados consolidados banca en españa a 30 septiembreResultados consolidados banca en españa a 30 septiembre
Resultados consolidados banca en españa a 30 septiembre
 
Bass cognitive dissonance
Bass cognitive dissonanceBass cognitive dissonance
Bass cognitive dissonance
 
Greif inc (spruce point capital)
Greif inc (spruce point capital)Greif inc (spruce point capital)
Greif inc (spruce point capital)
 
Third point-q4-2014-investor-letter-tpoi
Third point-q4-2014-investor-letter-tpoiThird point-q4-2014-investor-letter-tpoi
Third point-q4-2014-investor-letter-tpoi
 
Oei 2014-12
Oei 2014-12Oei 2014-12
Oei 2014-12
 
Skagen global noviembre 14
Skagen global noviembre 14Skagen global noviembre 14
Skagen global noviembre 14
 
Lessons of oil by howard marks
Lessons of oil by howard marksLessons of oil by howard marks
Lessons of oil by howard marks
 
Odey absolute return octubre 2014
Odey absolute return octubre 2014Odey absolute return octubre 2014
Odey absolute return octubre 2014
 
Odey absolute return octubre 2014
Odey absolute return octubre 2014Odey absolute return octubre 2014
Odey absolute return octubre 2014
 
Gmo qtly letter_3q14_full
Gmo qtly letter_3q14_fullGmo qtly letter_3q14_full
Gmo qtly letter_3q14_full
 
Estadistica anual definitiva 2013
Estadistica anual definitiva 2013Estadistica anual definitiva 2013
Estadistica anual definitiva 2013
 

KĂŒrzlich hochgeladen

Katrina Personal Brand Project and portfolio 1
Katrina Personal Brand Project and portfolio 1Katrina Personal Brand Project and portfolio 1
Katrina Personal Brand Project and portfolio 1kcpayne
 
Forklift Operations: Safety through Cartoons
Forklift Operations: Safety through CartoonsForklift Operations: Safety through Cartoons
Forklift Operations: Safety through CartoonsForklift Trucks in Minnesota
 
Dr. Admir Softic_ presentation_Green Club_ENG.pdf
Dr. Admir Softic_ presentation_Green Club_ENG.pdfDr. Admir Softic_ presentation_Green Club_ENG.pdf
Dr. Admir Softic_ presentation_Green Club_ENG.pdfAdmir Softic
 
Call Girls Kengeri Satellite Town Just Call 👗 7737669865 👗 Top Class Call Gir...
Call Girls Kengeri Satellite Town Just Call 👗 7737669865 👗 Top Class Call Gir...Call Girls Kengeri Satellite Town Just Call 👗 7737669865 👗 Top Class Call Gir...
Call Girls Kengeri Satellite Town Just Call 👗 7737669865 👗 Top Class Call Gir...amitlee9823
 
Call Girls Jp Nagar Just Call 👗 7737669865 👗 Top Class Call Girl Service Bang...
Call Girls Jp Nagar Just Call 👗 7737669865 👗 Top Class Call Girl Service Bang...Call Girls Jp Nagar Just Call 👗 7737669865 👗 Top Class Call Girl Service Bang...
Call Girls Jp Nagar Just Call 👗 7737669865 👗 Top Class Call Girl Service Bang...amitlee9823
 
Russian Call Girls In Gurgaon ❀8448577510 âŠčBest Escorts Service In 24/7 Delh...
Russian Call Girls In Gurgaon ❀8448577510 âŠčBest Escorts Service In 24/7 Delh...Russian Call Girls In Gurgaon ❀8448577510 âŠčBest Escorts Service In 24/7 Delh...
Russian Call Girls In Gurgaon ❀8448577510 âŠčBest Escorts Service In 24/7 Delh...lizamodels9
 
Cracking the Cultural Competence Code.pptx
Cracking the Cultural Competence Code.pptxCracking the Cultural Competence Code.pptx
Cracking the Cultural Competence Code.pptxWorkforce Group
 
Chandigarh Escorts Service 📞8868886958📞 JustđŸ“Č Call Nihal Chandigarh Call Girl...
Chandigarh Escorts Service 📞8868886958📞 JustđŸ“Č Call Nihal Chandigarh Call Girl...Chandigarh Escorts Service 📞8868886958📞 JustđŸ“Č Call Nihal Chandigarh Call Girl...
Chandigarh Escorts Service 📞8868886958📞 JustđŸ“Č Call Nihal Chandigarh Call Girl...Sheetaleventcompany
 
BAGALUR CALL GIRL IN 98274*61493 ❀CALL GIRLS IN ESCORT SERVICE❀CALL GIRL
BAGALUR CALL GIRL IN 98274*61493 ❀CALL GIRLS IN ESCORT SERVICE❀CALL GIRLBAGALUR CALL GIRL IN 98274*61493 ❀CALL GIRLS IN ESCORT SERVICE❀CALL GIRL
BAGALUR CALL GIRL IN 98274*61493 ❀CALL GIRLS IN ESCORT SERVICE❀CALL GIRLkapoorjyoti4444
 
Famous Olympic Siblings from the 21st Century
Famous Olympic Siblings from the 21st CenturyFamous Olympic Siblings from the 21st Century
Famous Olympic Siblings from the 21st Centuryrwgiffor
 
Call Girls In DLf Gurgaon ➄99902@11544 ( Best price)100% Genuine Escort In 24...
Call Girls In DLf Gurgaon ➄99902@11544 ( Best price)100% Genuine Escort In 24...Call Girls In DLf Gurgaon ➄99902@11544 ( Best price)100% Genuine Escort In 24...
Call Girls In DLf Gurgaon ➄99902@11544 ( Best price)100% Genuine Escort In 24...lizamodels9
 
0183760ssssssssssssssssssssssssssss00101011 (27).pdf
0183760ssssssssssssssssssssssssssss00101011 (27).pdf0183760ssssssssssssssssssssssssssss00101011 (27).pdf
0183760ssssssssssssssssssssssssssss00101011 (27).pdfRenandantas16
 
Call Girls Electronic City Just Call 👗 7737669865 👗 Top Class Call Girl Servi...
Call Girls Electronic City Just Call 👗 7737669865 👗 Top Class Call Girl Servi...Call Girls Electronic City Just Call 👗 7737669865 👗 Top Class Call Girl Servi...
Call Girls Electronic City Just Call 👗 7737669865 👗 Top Class Call Girl Servi...amitlee9823
 
FULL ENJOY Call Girls In Mahipalpur Delhi Contact Us 8377877756
FULL ENJOY Call Girls In Mahipalpur Delhi Contact Us 8377877756FULL ENJOY Call Girls In Mahipalpur Delhi Contact Us 8377877756
FULL ENJOY Call Girls In Mahipalpur Delhi Contact Us 8377877756dollysharma2066
 
A DAY IN THE LIFE OF A SALESMAN / WOMAN
A DAY IN THE LIFE OF A  SALESMAN / WOMANA DAY IN THE LIFE OF A  SALESMAN / WOMAN
A DAY IN THE LIFE OF A SALESMAN / WOMANIlamathiKannappan
 
FULL ENJOY Call Girls In Majnu Ka Tilla, Delhi Contact Us 8377877756
FULL ENJOY Call Girls In Majnu Ka Tilla, Delhi Contact Us 8377877756FULL ENJOY Call Girls In Majnu Ka Tilla, Delhi Contact Us 8377877756
FULL ENJOY Call Girls In Majnu Ka Tilla, Delhi Contact Us 8377877756dollysharma2066
 
MONA 98765-12871 CALL GIRLS IN LUDHIANA LUDHIANA CALL GIRL
MONA 98765-12871 CALL GIRLS IN LUDHIANA LUDHIANA CALL GIRLMONA 98765-12871 CALL GIRLS IN LUDHIANA LUDHIANA CALL GIRL
MONA 98765-12871 CALL GIRLS IN LUDHIANA LUDHIANA CALL GIRLSeo
 
Call Girls Pune Just Call 9907093804 Top Class Call Girl Service Available
Call Girls Pune Just Call 9907093804 Top Class Call Girl Service AvailableCall Girls Pune Just Call 9907093804 Top Class Call Girl Service Available
Call Girls Pune Just Call 9907093804 Top Class Call Girl Service AvailableDipal Arora
 
Falcon Invoice Discounting platform in india
Falcon Invoice Discounting platform in indiaFalcon Invoice Discounting platform in india
Falcon Invoice Discounting platform in indiaFalcon Invoice Discounting
 
John Halpern sued for sexual assault.pdf
John Halpern sued for sexual assault.pdfJohn Halpern sued for sexual assault.pdf
John Halpern sued for sexual assault.pdfAmzadHosen3
 

KĂŒrzlich hochgeladen (20)

Katrina Personal Brand Project and portfolio 1
Katrina Personal Brand Project and portfolio 1Katrina Personal Brand Project and portfolio 1
Katrina Personal Brand Project and portfolio 1
 
Forklift Operations: Safety through Cartoons
Forklift Operations: Safety through CartoonsForklift Operations: Safety through Cartoons
Forklift Operations: Safety through Cartoons
 
Dr. Admir Softic_ presentation_Green Club_ENG.pdf
Dr. Admir Softic_ presentation_Green Club_ENG.pdfDr. Admir Softic_ presentation_Green Club_ENG.pdf
Dr. Admir Softic_ presentation_Green Club_ENG.pdf
 
Call Girls Kengeri Satellite Town Just Call 👗 7737669865 👗 Top Class Call Gir...
Call Girls Kengeri Satellite Town Just Call 👗 7737669865 👗 Top Class Call Gir...Call Girls Kengeri Satellite Town Just Call 👗 7737669865 👗 Top Class Call Gir...
Call Girls Kengeri Satellite Town Just Call 👗 7737669865 👗 Top Class Call Gir...
 
Call Girls Jp Nagar Just Call 👗 7737669865 👗 Top Class Call Girl Service Bang...
Call Girls Jp Nagar Just Call 👗 7737669865 👗 Top Class Call Girl Service Bang...Call Girls Jp Nagar Just Call 👗 7737669865 👗 Top Class Call Girl Service Bang...
Call Girls Jp Nagar Just Call 👗 7737669865 👗 Top Class Call Girl Service Bang...
 
Russian Call Girls In Gurgaon ❀8448577510 âŠčBest Escorts Service In 24/7 Delh...
Russian Call Girls In Gurgaon ❀8448577510 âŠčBest Escorts Service In 24/7 Delh...Russian Call Girls In Gurgaon ❀8448577510 âŠčBest Escorts Service In 24/7 Delh...
Russian Call Girls In Gurgaon ❀8448577510 âŠčBest Escorts Service In 24/7 Delh...
 
Cracking the Cultural Competence Code.pptx
Cracking the Cultural Competence Code.pptxCracking the Cultural Competence Code.pptx
Cracking the Cultural Competence Code.pptx
 
Chandigarh Escorts Service 📞8868886958📞 JustđŸ“Č Call Nihal Chandigarh Call Girl...
Chandigarh Escorts Service 📞8868886958📞 JustđŸ“Č Call Nihal Chandigarh Call Girl...Chandigarh Escorts Service 📞8868886958📞 JustđŸ“Č Call Nihal Chandigarh Call Girl...
Chandigarh Escorts Service 📞8868886958📞 JustđŸ“Č Call Nihal Chandigarh Call Girl...
 
BAGALUR CALL GIRL IN 98274*61493 ❀CALL GIRLS IN ESCORT SERVICE❀CALL GIRL
BAGALUR CALL GIRL IN 98274*61493 ❀CALL GIRLS IN ESCORT SERVICE❀CALL GIRLBAGALUR CALL GIRL IN 98274*61493 ❀CALL GIRLS IN ESCORT SERVICE❀CALL GIRL
BAGALUR CALL GIRL IN 98274*61493 ❀CALL GIRLS IN ESCORT SERVICE❀CALL GIRL
 
Famous Olympic Siblings from the 21st Century
Famous Olympic Siblings from the 21st CenturyFamous Olympic Siblings from the 21st Century
Famous Olympic Siblings from the 21st Century
 
Call Girls In DLf Gurgaon ➄99902@11544 ( Best price)100% Genuine Escort In 24...
Call Girls In DLf Gurgaon ➄99902@11544 ( Best price)100% Genuine Escort In 24...Call Girls In DLf Gurgaon ➄99902@11544 ( Best price)100% Genuine Escort In 24...
Call Girls In DLf Gurgaon ➄99902@11544 ( Best price)100% Genuine Escort In 24...
 
0183760ssssssssssssssssssssssssssss00101011 (27).pdf
0183760ssssssssssssssssssssssssssss00101011 (27).pdf0183760ssssssssssssssssssssssssssss00101011 (27).pdf
0183760ssssssssssssssssssssssssssss00101011 (27).pdf
 
Call Girls Electronic City Just Call 👗 7737669865 👗 Top Class Call Girl Servi...
Call Girls Electronic City Just Call 👗 7737669865 👗 Top Class Call Girl Servi...Call Girls Electronic City Just Call 👗 7737669865 👗 Top Class Call Girl Servi...
Call Girls Electronic City Just Call 👗 7737669865 👗 Top Class Call Girl Servi...
 
FULL ENJOY Call Girls In Mahipalpur Delhi Contact Us 8377877756
FULL ENJOY Call Girls In Mahipalpur Delhi Contact Us 8377877756FULL ENJOY Call Girls In Mahipalpur Delhi Contact Us 8377877756
FULL ENJOY Call Girls In Mahipalpur Delhi Contact Us 8377877756
 
A DAY IN THE LIFE OF A SALESMAN / WOMAN
A DAY IN THE LIFE OF A  SALESMAN / WOMANA DAY IN THE LIFE OF A  SALESMAN / WOMAN
A DAY IN THE LIFE OF A SALESMAN / WOMAN
 
FULL ENJOY Call Girls In Majnu Ka Tilla, Delhi Contact Us 8377877756
FULL ENJOY Call Girls In Majnu Ka Tilla, Delhi Contact Us 8377877756FULL ENJOY Call Girls In Majnu Ka Tilla, Delhi Contact Us 8377877756
FULL ENJOY Call Girls In Majnu Ka Tilla, Delhi Contact Us 8377877756
 
MONA 98765-12871 CALL GIRLS IN LUDHIANA LUDHIANA CALL GIRL
MONA 98765-12871 CALL GIRLS IN LUDHIANA LUDHIANA CALL GIRLMONA 98765-12871 CALL GIRLS IN LUDHIANA LUDHIANA CALL GIRL
MONA 98765-12871 CALL GIRLS IN LUDHIANA LUDHIANA CALL GIRL
 
Call Girls Pune Just Call 9907093804 Top Class Call Girl Service Available
Call Girls Pune Just Call 9907093804 Top Class Call Girl Service AvailableCall Girls Pune Just Call 9907093804 Top Class Call Girl Service Available
Call Girls Pune Just Call 9907093804 Top Class Call Girl Service Available
 
Falcon Invoice Discounting platform in india
Falcon Invoice Discounting platform in indiaFalcon Invoice Discounting platform in india
Falcon Invoice Discounting platform in india
 
John Halpern sued for sexual assault.pdf
John Halpern sued for sexual assault.pdfJohn Halpern sued for sexual assault.pdf
John Halpern sued for sexual assault.pdf
 

Kase capital-q1-2013

  • 1. Whitney R. Tilson phone: 212 277 5606 Managing Partner WTilson@KaseCapital.com April 3, 2013 Dear Partner: Our fund is off to a solid start to the year, rising 6.7% in the first quarter vs. 10.6% for the S&P and 11.9% for the Dow. The fund s returns were driven by nice gains across most of the long portfolio, with a special mention for Netflix, which more than doubled. Here is the Q1 performance of all 11 long stock positions in the fund as of the beginning of the year (disclosed in the 2012 annual letter), plus two new stocks I bought during the quarter (ranked in descending order of current size): 1. AIG 10.0% 2. Berkshire Hathaway 16.6% 3. Howard Hughes 14.8% 4. Deckers 34.9%* 5. Citigroup 11.8% 6. Goldman Sachs 15.4% 7. Netflix 104.4% 8. Canadian Pacific 28.4% 9. dELiA*s -15.4% 10. Iridium -10.3% 11. Grupo Prisa (B) 16.0% 12. Sears Hometown & Outlet Stores -5.2%* 13. Spark Networks -9.7% * Performance since the position was established. Note that this excludes two private placements in Spencer Holdings and the Japan side fund. The two headwinds to the portfolio during the quarter (both discussed below) were cash, which comprised about a third of the fund, and the short book, which averaged approximately 20% of the fund. The fund is currently 66% long and 22% short. Two New Long Positions: Deckers and Sears Hometown & Outlet Stores I m pleased that I was able to identify two compelling new stocks to add to our portfolio during the quarter a satisfactory pace in light of the complacent market in which the major indices are near all-time highs. Deckers Deckers is best known for its UGG brand, which accounted for 95% of sales last quarter. The brand has been around since California surfers started wearing UGG boots in the late 1970s, but UGGs really became a fashion trend (some would say a fad) a few years ago, which resulted in the stock soaring nearly 10-fold from early 2009 to late 2011, peaking at close to $120. And then Carnegie Hall Tower, 152 West 57th Street, 46th Floor, New York, NY 10019
  • 2. the bottom fell out. The company reported steadily worse results as 2012 progressed and the stock plunged to under $30 by the end of last October. Even at its low point, however, the company was not only profitable, but had double-digit profit margins, high returns on equity, and a strong balance sheet, so the question for investors was: are UGGs a fad that will largely disappear (think Heelys), as the many people who are short the stock believe (short interest was 40.5% of the float as of 3/15/13), or will UGGs prove to be an enduring brand that s simply encountered some short-term turbulence? If so, then the stock which was around $40 when I was analyzing the company two months ago trading at just over 10x depressed earnings, was a bargain. The company attributed its weak results to three primary factors: 1. One of the warmest winters ever in 2011; 2. The price of sheepskin (the primary raw material in UGG boots) rising 80% due to floods in Australia that decimated sheep herds; and 3. The economic weakness in Europe. These are all true statements but was the company just making excuses to cover up the fact that the fad had passed and nobody wanted to wear UGGs anymore? To answer this question, I designed a survey (click here to see it) and sent it out to my various email lists. The 274 responses (posted here) I received were very revealing: 60% of respondents owned UGGs classic sheepskin boots, 48% owned more than one UGGs product, and 78% had owned an UGGs product for at least two years. When asked how highly they would recommend UGGs to a friend (on a scale of 1-10), 25% gave UGGs a perfect 10 and an additional 45% rated UGGs 7-9. 70% said they were certain (25%) or likely (35%) to buy UGGs again. These are satisfied customers. When asked whether they view their Uggs more as a fashion product or a utilitarian/functional product, 74% said the latter, and when asked how their views about Uggs changed over the past year, 65% said no change, 20% said more positive, and only 15% said more negative. These responses are not consistent with a fad product that s going away. The comments in the open response part of the survey also reinforced my thesis that most customers love their UGGs and would continue to buy, wear, and recommend them. The survey was the final piece of evidence that confirmed my investment thesis that, while UGGs may have become faddish for a while, the core brand and products were strong and Deckers was mostly suffering from short-term issues, so I purchased the stock, which has risen 34.9% in the two months since then. Sears Hometown & Outlet Stores I also added Sears Hometown & Outlet Stores (SHOS) to the portfolio during the quarter. Last October, Sears Holdings spun off SHOS, which is comprised of four divisions: -2-
  • 3. Sears Outlet: 127 warehouse style stores, all but three of which are company owned, selling mostly scratched, dented, refurbished and old model appliances at steep discounts; $564 million in sales and $42.1 million in operating income in 2012; Sears Hometown Stores: 943 stores, all but one operated by franchisees, selling mostly appliances, lawn & garden, and tools, typically in small, rural markets (average store size: 8,500 sq. ft.) in all 50 states, Puerto Rico and Bermuda; Sears Hardware Stores: 90 stores in 16 states, 33 company owned, 57 franchised, selling similar merchandise as Hometown stores, but in bigger markets (average store size: 28,000 sq. ft.), similar to ACE Hardware; Sears Home Appliance Showrooms: 85 stores in 22 states, 27 company owned, 58 franchised, selling strictly appliances in a 5,000 sq. ft. showroom. The latter three, under the Sears Hometown and Hardware segment, had sales of $1.9 billion and operating income of $57.4 million in 2012. This might not sound like a good business, but keep in mind that 85% of the company s 1,245 total stores are franchised, meaning the franchisees put up the money and do the hard work, while the SHOS simply collects a royalty on all this effort an excellent business. SHOS has strong growth potential management has indicated that the company could more than double its store count to 3,000 stores. As an independent company, management now has appropriate incentives, and SHOS is also benefitting from Sears closing large numbers of its mainline stores (it closed 1,462 stores in FY 2012, 36% of its total). In fact, given that Sears s controlling shareholder and CEO, Eddie Lampert, owns a 62% stake in SHOS (larger than Lampert s 56% stake in Sears itself), it appears that Lampert may be quietly adopting a strategy of closing unprofitable full-size Sears stores and effectively transferring to SHOS the sales (and profits) of Sears s best businesses, its appliances and other hard goods sold under top brands like Kenmore and Craftsman. If so, this will provide a substantial long-term tailwind to SHOS, as Sears had $40 billion in sales in 2012 vs. only $2.5 billion for SHOS. If SHOS is such an attractive company, why is it only my 12th largest position (approximately 2%)? The answer is valuation. By the time I discovered this investment, the stock had run up from under $30 at the time of the spinoff to over $40, leaving less margin of safety. At its current price of $40, the company has an enterprise value of around $1 billion vs. 2012 operating income of $99.5 million and adjusted EBITDA of $109.8 million. I think earnings will grow substantially in years to come, so 9x trailing EBITDA is a reasonable multiple, but it s not cheap enough to make it a full position so I ve established a starter position and am hoping the market gives me the opportunity at some point to buy a lot more at a better price. Short Book Here is the first quarter performance of the three shorts I disclosed in my 2012 annual letter: 1. InterOil 37.1% 2. K-12 18.0% 3. Nokia -17.0% -3-
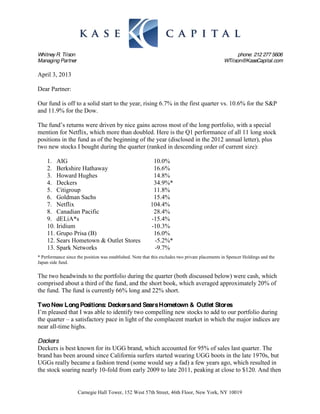
  • 4. Their performance was quite representative of the 10 stocks that comprise our current short book while a few worked, most ran up along with the market. I remain highly confident that every one of our short positions is vastly overvalued and there are catalysts that will cause the stocks to tumble, but over a short period when the market is ripping upward and complacency abounds, our short book is going to be a headwind. Thoughts on Q1 Performance, Risks, and the Sustainability of Corporate Profit M argins In the first sentence of this letter, I describe our Q1 performance as solid. In light of the fact that our fund trailed the major indices, some might challenge this view, so allow me to explain. First and foremost, my goal is to preserve capital and, secondly, to earn a satisfactory rate of return. I achieved both of these objectives in Q1 hence the word solid. In general, our fund will likely not keep up with the market when it is rising rapidly because I usually hold some cash and always have a decent-sized short book. This is not an ideal environment for a value investor like me because to find wonderful bargains it helps to have some distress in the market or at least some area of the market but there s very little of this today. The major indices are at or near all-time highs and, for example, the VIX, a volatility measure of the S&P 500, dropped 30% during the first quarter. Nevertheless, I spend almost all of my time doing bottoms-up analysis of companies and industries, but as I construct the overall portfolio and determine how aggressively or conservatively to position the fund, I am guided by Buffett s simple maxim: Be fearful when others are greedy and greedy when others are fearful. ck market bubble (the bond market is another matter!), but our fund is quite conservatively positioned right now because valuations are full, complacency is high, and bargains are scarce and there are plenty of things that could change this. In addition to the usual risk factors (a tepid economy recovery in the U.S., possibly dependent on unsustainable money printing and deficit spending; the ongoing recession in Europe; a potential mother-of-all-real-estate/infrastructure bubbles bursting in China; and a bankrupt Japan), who was even thinking about the risks associated with Cyprus or war breaking out on the Korean Peninsula until very recently? Donald Rumsfeld well. The critical question for U.S. stocks is whether corporate profit margins can remain at today s all-time-high levels. This chart shows profit margins (before depreciation, interest, and tax, as a percent of output) going back to 1929: -4-
  • 5. As you can see, historically, when margins have peaked, they ve soon reverted to the mean. If this happens again, stocks could be in for some rough sledding. If so, I believe we are well positioned to take advantage due to our significant cash balance and relatively low market exposure. Privacy Policy and Updated Form ADV Once a year, we are required to send you a copy of our Privacy Policy, so it s attached in Appendix A. In addition, our latest Form ADV is posted at: www.tilsonfunds.com/ADV.pdf. Conclusion Thank you for your confidence and support. If you have any comments or questions, please call me anytime on my cell phone at (646) 258-0687. Sincerely yours, Whitney Tilson -5-
  • 6. The unaudited return for the Kase Fund versus major benchmarks (including reinvested dividends) is: Q1 Since Inception Kase Fund net 6.7% 124.7% S&P 500 10.6% 65.7% Dow 11.9% 121.6% Past performance is not indicative of future results. Please refer to the disclosure section at the end of this letter. The Kase Fund was launched on 1/1/99. Kase Fund Performance (Net) Since I nception 200 180 160 140 120 100 (% ) 80 60 40 20 0 -20 -40 Jan-99 Jan-00 Jan-01 Jan-02 Jan-03 Jan-04 Jan-05 Jan-06 Jan-07 Jan-08 Jan-09 Jan-10 Jan-11 Jan-12 Jan-13 Kase Fund S& P 500 Past performance is not indicative of future results. Kase Fund M onthly Performance (Net) Since I nception 1999 2000 2001 2002 2003 2004 2005 2006 2007 2008 2009 2010 2011 2012 2013 Kase S& P Kase S& P Kase S& P Kase S& P Kase S& P Kase S& P Kase S& P Kase S& P Kase S& P Kase S& P Kase S& P Kase S& P Kase S& P Kase S& P Kase S& P Fund 500 Fund 500 Fund 500 Fund 500 Fund 500 Fund 500 Fund 500 Fund 500 Fund 500 Fund 500 Fund 500 Fund 500 Fund 500 Fund 500 Fund 500 January 7.8 4.1 -6.3 -5.0 4.4 3.6 -1.8 -1.5 -5.5 -2.6 4.7 1.8 1.1 -2.4 1.9 2.7 2.4 1.7 1.9 -5.9 -3.6 -8.4 -1.6 -3.6 -2.8 2.4 12.6 4.5 4.5 5.2 February -2.9 -3.1 6.2 -1.9 -0.6 -9.2 -1.1 -2.0 2.9 -1.6 7.0 1.5 2.1 2.0 -3.1 0.2 -3.3 -2.1 -6.9 -3.3 -8.9 -10.8 7.3 3.1 4.1 3.4 -0.8 4.3 0.8 1.4 M arch 4.1 4.0 10.3 9.8 -2.6 -6.4 3.0 3.7 1.4 0.9 3.9 -1.5 3.9 -1.7 3.9 1.3 -0.8 1.1 -2.3 -0.5 2.9 9.0 4.6 6.0 -4.1 0.0 10.9 3.3 1.3 3.8 April 2.1 3.7 -5.1 -3.0 5.1 7.8 -0.2 -6.0 10.5 8.2 2.4 -1.5 0.6 -1.9 2.2 1.4 4.4 4.6 -0.9 4.9 20.1 9.6 -2.1 1.6 1.9 3.0 1.3 -0.6 M ay -5.7 -2.5 -2.8 -2.0 1.8 0.6 0.0 -0.8 6.6 5.3 -1.4 1.4 -2.6 3.2 1.8 -2.9 2.5 3.3 7.9 1.2 8.1 5.5 -2.6 -8.0 -1.9 -1.1 -13.6 -6.0 June 2.2 5.8 4.1 2.4 4.6 -2.4 -7.3 -7.1 2.9 1.3 0.1 1.9 -3.1 0.1 -0.2 0.2 -3.0 -1.5 -1.2 -8.4 -5.0 0.2 4.5 -5.2 -2.4 -1.7 0.5 4.1 July -0.7 -3.2 -3.6 -1.6 -1.1 -1.0 -5.0 -7.9 2.3 1.7 4.6 -3.4 0.5 3.7 -0.9 0.7 -5.4 -3.0 -2.5 -0.9 6.8 7.6 3.5 7.0 -4.6 -2.0 0.2 1.4 August 4.1 -0.4 5.4 6.1 2.5 -6.3 -4.3 0.5 0.4 1.9 -0.9 0.4 -3.2 -1.0 2.9 2.3 1.7 1.5 -3.3 1.3 6.3 3.6 -1.5 -4.5 -13.9 -5.4 -7.2 2.3 September -3.3 -2.7 -7.2 -5.3 -6.1 -8.1 -5.4 -10.9 1.7 -1.0 -1.6 1.1 -1.5 0.8 5.0 2.6 -1.1 3.6 15.9 -9.1 5.9 3.7 1.7 8.9 -9.3 -7.0 0.0 2.6 October 8.1 6.4 -4.5 -0.3 -0.8 1.9 2.8 8.8 6.2 5.6 -0.4 1.5 3.5 -1.6 6.3 3.5 8.2 1.7 -12.5 -16.8 -1.9 -1.8 -1.7 3.8 7.0 10.9 1.6 -1.9 November 2.8 2.0 -1.5 -7.9 2.3 7.6 4.1 5.8 2.2 0.8 0.8 4.0 3.1 3.7 1.9 1.7 -3.6 -4.2 -8.9 -7.1 -1.2 6.0 -1.9 0.0 -0.6 -0.2 -4.5 0.6 December 9.8 5.9 2.3 0.5 6.5 0.9 -7.4 -5.8 -0.4 5.3 -0.2 3.4 -1.3 0.0 1.4 1.4 -4.3 -0.7 -4.0 1.1 5.5 1.9 0.5 6.7 0.1 1.0 0.1 0.9 YTD 31.0 21.0 -4.5 -9.1 16.5 -11.9 -22.2 -22.1 35.1 28.6 20.6 10.9 2.6 4.9 25.2 15.8 -3.2 5.5 -18.1 -37.0 37.1 26.5 10.5 15.1 -24.9 2.1 -1.7 16.0 6.7 10.6 TOTAL Past performance is not indicative of future results. Note: Returns in 2001, 2003, and 2009 reflect the benefit of the high-water mark, assuming an investor at inception. -6-
  • 7. Appendix A PRI VACY POLI CY This privacy policy explains the manner in which the Partnership, the General Partner and the Investment Manager (collectively, the Partnership ) collect, utilize and maintain nonpublic personal information about the Partnership s investors, as required under Federal legislation. Collection of I nvestor I nformation The Partnership collects nonpublic personal information about its investors mainly through the following sources: Subscription forms, investor questionnaires a nd other information provided by the investor in writing, in person, by telephone, electronically or by any other means. This information includes name, address, nationality, tax identification number and financial and investment qualifications; and transactions within the Partnership, including account balances, investments and withdrawals. Disclosure of Nonpublic Personal I nformation The Partnership does not sell or rent investor information. The Partnership does not disclose nonpublic personal information about its investors to nonaffiliated third parties or to affiliated entities, except as permitted by law. For example, the Partnership may share nonpublic personal information in the following situations: To service providers in connection with the administration and servicing of the Partnership, which may include attorneys, accountants, auditors and other professionals. The Partnership may also share information in connection with the servicing or processing of Partnership transactions; To 3rd party marketing firms who have been engaged by the Investment Manager to raise assets for the Partnership. Any information provided to a 3rd party marketing firm would be limited to name and basic contact information. To affiliated companies in order to provide you with ongoing personal advice and assistance with respect to the products and services you have purchased through the Partnership and to introduce you to other products and services that may be of value to you; To respond to a subpoena or court order, judicial process or regulatory authorities; To protect against fraud, unauthorized transactions (such as money laundering), claims or other liabilities; and Upon consent of an investor to release such information, including authorization to disclose such information to persons acting in a fiduciary or representative capacity on behalf of the investor. If you elect to opt-out and do not want us to share your non-public personal information other than when required to perform normal services or when required by law, please contact us at: Carnegie Hall Tower, 152 West 57th Street, 46th Floor, New York, New York 10019, Ph: (212) -7-
  • 8. 277-5606 or by email: kalires@kasecapital.com. Protection of I nvestor I nformation The Partnership s policy is to require that all employees, financial professionals and companies providing services on its behalf keep client information confidential. The Partnership maintains safeguards that comply with federal standards to protect investor information. The Partnership restricts access to the personal and account information of investors to those employees who need to know that information in the course of their job responsibilities. Third parties with whom the Partnership shares investor information must agree to follow appropriate standards of security and confidentiality. The Partnership s privacy policy applies to both current and former investors. The Partnership may disclose nonpublic personal information about a former investor to the same extent as for a current investor. Changes to Privacy Policy The Partnership may make changes to its privacy policy in the future. The Partnership will not make any change affecting you without first sending you a revised privacy policy describing the change. -8-
  • 9. The T2 Accredited Fund, LP (dba the Kase Fund) (the Fund ) commenced operations on January 1, 1999. The Fund s investment objective is to achieve long-term after-tax capital appreciation commensurate with moderate risk, primarily by investing with a long-term perspective in a concentrated portfolio of U.S. stocks. In carrying out the Partnership s investment objective, the Investment Manager, T2 Partners Management, LP (dba Kase Capital Management), seeks to buy stocks at a steep discount to intrinsic value such that there is low risk of capital loss and significant upside potential. The primary focus of the Investment Manager is on the long-term fortunes of the companies in the Partnership s portfolio or which are otherwise followed by the Investment Manager, relative to the prices of their stocks. There is no assurance that any securities discussed herein will remain in Fund s portfolio at the time you receive this report or that securities sold have not been repurchased. The securities discussed may not represent the Fund s entire portfolio and in the aggregate may represent only a small percentage of an account s portfolio holdings. The material presented is compiled from sources believed to be reliable and honest, but accuracy cannot be guaranteed. It should not be assumed that any of the securities transactions, holdings or sectors discussed were or will prove to be profitable, or that the investment recommendations or decisions we make in the future will be profitable or will equal the investment performance of the securities discussed herein. All recommendations within the preceding 12 months or applicable period are available upon request. Past results are no guarantee of future results and no representation is made that an investor will or is likely to achieve results similar to those shown. All investments involve risk including the loss of principal. Performance results shown are for the Kase Fund and are presented net of all fees, including management and incentive fees, brokerage commissions, administrative expenses, and other operating expenses of the Fund. Net performance includes the reinvestment of all dividends, interest, and capital gains. The fee schedule for the Investment Manager includes a 1.5% annual management fee and a 20% incentive fee allocation. For periods prior to June 1, 2004 and after July 1, 2012, the Investment Manager s fee schedule included a 1% annual management fee and a 20% incentive fee allocation. In practice, the incentive fee is earned on an annual, not monthly, basis or upon a withdrawal from the Fund. Because some investors may have different fee arrangements and depending on the timing of a specific investment, net performance for an individual investor may vary from the net performance as stated herein. The return of the S&P 500 and other indices are included in the presentation. The volatility of these indices may be materially different from the volatility in the Fund. In addition, the Fund s holdings differ significantly from the securities that comprise the indices. The indices have not been selected to represent appropriate benchmarks to compare an investor s performance, but rather are disclosed to allow for comparison of the investor s performance to that of certain well-known and widely recognized indices. You cannot invest directly in these indices. This document is confidential and may not be distributed without the consent of the Investment Manager and does not constitute an offer to sell or the solicitation of an offer to purchase any security or investment product. Any such offer or solicitation may only be made by means of delivery of an approved confidential offering memorandum. -9-