SlideShare ist ein Scribd-Unternehmen logo
1 von 5
S1370.2 Bull and Bear Markets S&P 500 Index Daily Price-Only Returns: December 31, 1965-July 31, 2008 The S&P data are provided by Standard & Poor's Index Services Group.  Bull and bear markets are defined in hindsight using cumulative daily returns. A bear market (1) begins with a negative daily return, (2) must achieve a cumulative return less than or equal to -15%, and (3) ends at the most negative cumulative return prior to achieving a positive cumulative return. All data points which are not considered part of a bear market are designated as a bull market.  Performance data represents past performance and does not predict future performance. Average Duration Bull Market: 1,188 Days Bear Market: 413 Days Average Return Bull Market: 103% Bear Market: -29% 40 Days +2% 240 Days -22% 541 Days -36% 630 Days -48% 525 Days -19% 498 Days -25% 288 Days -14% 101 Days -34% 87 Days -20% 927 Days -49% 296 Days -19% 782 Days +48% 961 Days +74% 719 Days +73% 1,128 Days +57% 424 Days +69% 1,127 Days +128% 953 Days +65% 3,452 Days +417% 1,826 Days +101% 1966 1971 1976 1981 1986 1991 1996 2001 2006
Bull and Bear Markets S&P 500 Index (USD) Monthly Returns: January 1926-July 2008 The S&P data are provided by Standard & Poor's Index Services Group.  Bull and bear markets are defined in hindsight using cumulative monthly returns. A bear market (1) begins with a negative monthly return, (2) must achieve a cumulative return less than or equal to -10%, and (3) ends at the most negative cumulative return prior to achieving a positive cumulative return. All data points which are not considered part of a bear market are designated as a bull market.  1925  1930 1935 1940 1945 1950 1960 1965 1970 1975 1980 1985 1990 2000 2005 Average Duration: Bull Market: 32 Months Bear Market: 11 Months Months = Duration of Bull/Bear Mkt.  % = Total Return for the Bull/Bear Mkt. 44 months 193% 34 months -83% 2 months 92% 6 months 100% 3 months 26% 4 months 12% 23 months 133% 6 months -30% 2 months -19% 6 months -21% 4 months -10% 9 months 61% 5 months 22% 4 mos. -16% 31 mos. -30% 49 months 210% 6 months -22% 116 months 491% 13 mos. -50% 5 mos. 12% 7 months -10% 5 months -15% 48 mos. 105% 6 months -22% 9 mos. 55% 15 mos. 35% 20 mos. -17% 61 months 282% 3 months -30% 30 mos. 71% 2 mos. -15% 92 months 355% 24 mos. 63% 9 months -17% 61 months 108% 8 months -16% 19 mos. -29% 21 months -43% 3 mos. -11% 5 months -15% 25 months -45% 43 months 90% 26 mos. 52% 30 months 76% 33 months 86% 14 mos. -14% S1370.2
Bull and Bear Markets Russell 2000 Index (USD) Monthly Returns: January 1979-July 2008 Russell data copyright © Russell Investment Group 1995-2008, all rights reserved.  Bull and bear markets are defined in hindsight using cumulative monthly returns. A bear market (1) begins with a negative monthly return, (2) must achieve a cumulative return less than or equal to -10%, and (3) ends at the most negative cumulative return prior to achieving a positive cumulative return. All data points which are not considered part of a bear market are designated as a bull market.  1979  1981 1983 1985 1987 1989 1991 1993 1995 1997 1999 2001 2003 2005 2007 8 mos. 38% 2 mos. 11% 3 mos. 26% 2 mos. -20% 14 months 82% 14 months -22% 11 months 100% 13 months -21% 22 months 69% 4 months -12% 11 mos. 32% 3 months -36% 22 months 65% 13 months -32% 67 months 234% 2 months -12% 21 months 57% 4 months -30% 18 months 74% 31 months -35% 2 months 12% 3 months -11% 22 months 85% 4 months -11% 25 months 50% 9 months -18% 4 months 1% Average Duration: Bull Market: 18 Months Bear Market: 8 Months Months = Duration of Bull/Bear Market  % = Total Return for the Bull/Bear Market S1370.2
Bull and Bear Markets MSCI EAFE Index, Net Dividends (USD) Monthly Returns: January 1970-July 2008 MSCI data copyright MSCI 2008, all rights reserved.  Bull and bear markets are defined in hindsight using cumulative monthly returns. A bear market (1) begins with a negative monthly return, (2) must achieve a cumulative return less than or equal to -10%, and (3) ends at the most negative cumulative return prior to achieving a positive cumulative return. All data points which are not considered part of a bear market are designated as a bull market.  1970  1972 1974 1976 1978 1980 1982 1984 1986 1988 1990 1992 1994 1996 1998 2000 2002 2004 2006 2008 7 months 41% 4 mos. 19% 5 months -15% 34 months 103% 18 months -42% 39 months 93% 5 mos. -13% 13 months 36% 15 mos. 53% 18 mos. 67% 2 mos. -11% 37 months 323% 17 months -20% 26 months 47% 4 months -17% 2 months -15% 57 months 93% 9 months -31% 5 months 26% 20 months -15% 8 mos. 18% 55 months 206% 4 mos. -11% 9 months 19% Average Duration: Bull Market: 24 Months Bear Market: 10 Months Months = Duration of Bull/Bear Market  % = Total Return for the Bull/Bear Market 2 mos. -15% 39 months -48% 9 mos. -13% S1370.2
Bull and Bear Markets MSCI Emerging Markets Index, Gross Dividends (USD) Monthly Returns: January 1988-July 2008 MSCI data copyright MSCI 2008, all rights reserved.  Bull and bear markets are defined in hindsight using cumulative monthly returns. A bear market (1) begins with a negative monthly return, (2) must achieve a cumulative return less than or equal to -10%, and (3) ends at the most negative cumulative return prior to achieving a positive cumulative return. All data points which are not considered part of a bear market are designated as a bull market.  1988  1989 1990 1991 1992 1993 1994 1995 1996 1997 1998 1999 2000 2001 2002 2003 2004 2005 2006 2007 8 mos. 43% 4 mos. 31% 1 mo. -12% 17 months 98% 1 mo. -14% 16 months 101% 4 months -29% 17 months 92% 5 months -14% 5 mos. 21% 3 months -12% 29 months 38% 5 months -25% 19 months 114% 13 months -56% 18 months -48% 7 months 42% 5 months -24% 18 months 89% 4 months -11% 21 months 109% 16 months 85% 2 months -11% 9 months 21% Average Duration: Bull Market: 15 Months Bear Market: 6 Months Months = Duration of Bull/Bear Market  % = Total Return for the Bull/Bear Market S1370.2

Weitere ähnliche Inhalte

Kürzlich hochgeladen

The Economic History of the U.S. Lecture 20.pdf
The Economic History of the U.S. Lecture 20.pdfThe Economic History of the U.S. Lecture 20.pdf
The Economic History of the U.S. Lecture 20.pdfGale Pooley
 
VVIP Pune Call Girls Katraj (7001035870) Pune Escorts Nearby with Complete Sa...
VVIP Pune Call Girls Katraj (7001035870) Pune Escorts Nearby with Complete Sa...VVIP Pune Call Girls Katraj (7001035870) Pune Escorts Nearby with Complete Sa...
VVIP Pune Call Girls Katraj (7001035870) Pune Escorts Nearby with Complete Sa...Call Girls in Nagpur High Profile
 
The Economic History of the U.S. Lecture 19.pdf
The Economic History of the U.S. Lecture 19.pdfThe Economic History of the U.S. Lecture 19.pdf
The Economic History of the U.S. Lecture 19.pdfGale Pooley
 
Best VIP Call Girls Noida Sector 18 Call Me: 8448380779
Best VIP Call Girls Noida Sector 18 Call Me: 8448380779Best VIP Call Girls Noida Sector 18 Call Me: 8448380779
Best VIP Call Girls Noida Sector 18 Call Me: 8448380779Delhi Call girls
 
The Economic History of the U.S. Lecture 21.pdf
The Economic History of the U.S. Lecture 21.pdfThe Economic History of the U.S. Lecture 21.pdf
The Economic History of the U.S. Lecture 21.pdfGale Pooley
 
High Class Call Girls Nagpur Grishma Call 7001035870 Meet With Nagpur Escorts
High Class Call Girls Nagpur Grishma Call 7001035870 Meet With Nagpur EscortsHigh Class Call Girls Nagpur Grishma Call 7001035870 Meet With Nagpur Escorts
High Class Call Girls Nagpur Grishma Call 7001035870 Meet With Nagpur Escortsranjana rawat
 
Vip Call US 📞 7738631006 ✅Call Girls In Sakinaka ( Mumbai )
Vip Call US 📞 7738631006 ✅Call Girls In Sakinaka ( Mumbai )Vip Call US 📞 7738631006 ✅Call Girls In Sakinaka ( Mumbai )
Vip Call US 📞 7738631006 ✅Call Girls In Sakinaka ( Mumbai )Pooja Nehwal
 
Pooja 9892124323 : Call Girl in Juhu Escorts Service Free Home Delivery
Pooja 9892124323 : Call Girl in Juhu Escorts Service Free Home DeliveryPooja 9892124323 : Call Girl in Juhu Escorts Service Free Home Delivery
Pooja 9892124323 : Call Girl in Juhu Escorts Service Free Home DeliveryPooja Nehwal
 
The Economic History of the U.S. Lecture 23.pdf
The Economic History of the U.S. Lecture 23.pdfThe Economic History of the U.S. Lecture 23.pdf
The Economic History of the U.S. Lecture 23.pdfGale Pooley
 
The Economic History of the U.S. Lecture 22.pdf
The Economic History of the U.S. Lecture 22.pdfThe Economic History of the U.S. Lecture 22.pdf
The Economic History of the U.S. Lecture 22.pdfGale Pooley
 
TEST BANK For Corporate Finance, 13th Edition By Stephen Ross, Randolph Weste...
TEST BANK For Corporate Finance, 13th Edition By Stephen Ross, Randolph Weste...TEST BANK For Corporate Finance, 13th Edition By Stephen Ross, Randolph Weste...
TEST BANK For Corporate Finance, 13th Edition By Stephen Ross, Randolph Weste...ssifa0344
 
Log your LOA pain with Pension Lab's brilliant campaign
Log your LOA pain with Pension Lab's brilliant campaignLog your LOA pain with Pension Lab's brilliant campaign
Log your LOA pain with Pension Lab's brilliant campaignHenry Tapper
 
06_Joeri Van Speybroek_Dell_MeetupDora&Cybersecurity.pdf
06_Joeri Van Speybroek_Dell_MeetupDora&Cybersecurity.pdf06_Joeri Van Speybroek_Dell_MeetupDora&Cybersecurity.pdf
06_Joeri Van Speybroek_Dell_MeetupDora&Cybersecurity.pdfFinTech Belgium
 
VIP Independent Call Girls in Bandra West 🌹 9920725232 ( Call Me ) Mumbai Esc...
VIP Independent Call Girls in Bandra West 🌹 9920725232 ( Call Me ) Mumbai Esc...VIP Independent Call Girls in Bandra West 🌹 9920725232 ( Call Me ) Mumbai Esc...
VIP Independent Call Girls in Bandra West 🌹 9920725232 ( Call Me ) Mumbai Esc...dipikadinghjn ( Why You Choose Us? ) Escorts
 
The Economic History of the U.S. Lecture 30.pdf
The Economic History of the U.S. Lecture 30.pdfThe Economic History of the U.S. Lecture 30.pdf
The Economic History of the U.S. Lecture 30.pdfGale Pooley
 
05_Annelore Lenoir_Docbyte_MeetupDora&Cybersecurity.pptx
05_Annelore Lenoir_Docbyte_MeetupDora&Cybersecurity.pptx05_Annelore Lenoir_Docbyte_MeetupDora&Cybersecurity.pptx
05_Annelore Lenoir_Docbyte_MeetupDora&Cybersecurity.pptxFinTech Belgium
 
02_Fabio Colombo_Accenture_MeetupDora&Cybersecurity.pptx
02_Fabio Colombo_Accenture_MeetupDora&Cybersecurity.pptx02_Fabio Colombo_Accenture_MeetupDora&Cybersecurity.pptx
02_Fabio Colombo_Accenture_MeetupDora&Cybersecurity.pptxFinTech Belgium
 
VIP Independent Call Girls in Andheri 🌹 9920725232 ( Call Me ) Mumbai Escorts...
VIP Independent Call Girls in Andheri 🌹 9920725232 ( Call Me ) Mumbai Escorts...VIP Independent Call Girls in Andheri 🌹 9920725232 ( Call Me ) Mumbai Escorts...
VIP Independent Call Girls in Andheri 🌹 9920725232 ( Call Me ) Mumbai Escorts...dipikadinghjn ( Why You Choose Us? ) Escorts
 

Kürzlich hochgeladen (20)

The Economic History of the U.S. Lecture 20.pdf
The Economic History of the U.S. Lecture 20.pdfThe Economic History of the U.S. Lecture 20.pdf
The Economic History of the U.S. Lecture 20.pdf
 
VVIP Pune Call Girls Katraj (7001035870) Pune Escorts Nearby with Complete Sa...
VVIP Pune Call Girls Katraj (7001035870) Pune Escorts Nearby with Complete Sa...VVIP Pune Call Girls Katraj (7001035870) Pune Escorts Nearby with Complete Sa...
VVIP Pune Call Girls Katraj (7001035870) Pune Escorts Nearby with Complete Sa...
 
The Economic History of the U.S. Lecture 19.pdf
The Economic History of the U.S. Lecture 19.pdfThe Economic History of the U.S. Lecture 19.pdf
The Economic History of the U.S. Lecture 19.pdf
 
Best VIP Call Girls Noida Sector 18 Call Me: 8448380779
Best VIP Call Girls Noida Sector 18 Call Me: 8448380779Best VIP Call Girls Noida Sector 18 Call Me: 8448380779
Best VIP Call Girls Noida Sector 18 Call Me: 8448380779
 
The Economic History of the U.S. Lecture 21.pdf
The Economic History of the U.S. Lecture 21.pdfThe Economic History of the U.S. Lecture 21.pdf
The Economic History of the U.S. Lecture 21.pdf
 
High Class Call Girls Nagpur Grishma Call 7001035870 Meet With Nagpur Escorts
High Class Call Girls Nagpur Grishma Call 7001035870 Meet With Nagpur EscortsHigh Class Call Girls Nagpur Grishma Call 7001035870 Meet With Nagpur Escorts
High Class Call Girls Nagpur Grishma Call 7001035870 Meet With Nagpur Escorts
 
Vip Call US 📞 7738631006 ✅Call Girls In Sakinaka ( Mumbai )
Vip Call US 📞 7738631006 ✅Call Girls In Sakinaka ( Mumbai )Vip Call US 📞 7738631006 ✅Call Girls In Sakinaka ( Mumbai )
Vip Call US 📞 7738631006 ✅Call Girls In Sakinaka ( Mumbai )
 
(Vedika) Low Rate Call Girls in Pune Call Now 8250077686 Pune Escorts 24x7
(Vedika) Low Rate Call Girls in Pune Call Now 8250077686 Pune Escorts 24x7(Vedika) Low Rate Call Girls in Pune Call Now 8250077686 Pune Escorts 24x7
(Vedika) Low Rate Call Girls in Pune Call Now 8250077686 Pune Escorts 24x7
 
Pooja 9892124323 : Call Girl in Juhu Escorts Service Free Home Delivery
Pooja 9892124323 : Call Girl in Juhu Escorts Service Free Home DeliveryPooja 9892124323 : Call Girl in Juhu Escorts Service Free Home Delivery
Pooja 9892124323 : Call Girl in Juhu Escorts Service Free Home Delivery
 
The Economic History of the U.S. Lecture 23.pdf
The Economic History of the U.S. Lecture 23.pdfThe Economic History of the U.S. Lecture 23.pdf
The Economic History of the U.S. Lecture 23.pdf
 
The Economic History of the U.S. Lecture 22.pdf
The Economic History of the U.S. Lecture 22.pdfThe Economic History of the U.S. Lecture 22.pdf
The Economic History of the U.S. Lecture 22.pdf
 
TEST BANK For Corporate Finance, 13th Edition By Stephen Ross, Randolph Weste...
TEST BANK For Corporate Finance, 13th Edition By Stephen Ross, Randolph Weste...TEST BANK For Corporate Finance, 13th Edition By Stephen Ross, Randolph Weste...
TEST BANK For Corporate Finance, 13th Edition By Stephen Ross, Randolph Weste...
 
Log your LOA pain with Pension Lab's brilliant campaign
Log your LOA pain with Pension Lab's brilliant campaignLog your LOA pain with Pension Lab's brilliant campaign
Log your LOA pain with Pension Lab's brilliant campaign
 
06_Joeri Van Speybroek_Dell_MeetupDora&Cybersecurity.pdf
06_Joeri Van Speybroek_Dell_MeetupDora&Cybersecurity.pdf06_Joeri Van Speybroek_Dell_MeetupDora&Cybersecurity.pdf
06_Joeri Van Speybroek_Dell_MeetupDora&Cybersecurity.pdf
 
VIP Independent Call Girls in Bandra West 🌹 9920725232 ( Call Me ) Mumbai Esc...
VIP Independent Call Girls in Bandra West 🌹 9920725232 ( Call Me ) Mumbai Esc...VIP Independent Call Girls in Bandra West 🌹 9920725232 ( Call Me ) Mumbai Esc...
VIP Independent Call Girls in Bandra West 🌹 9920725232 ( Call Me ) Mumbai Esc...
 
The Economic History of the U.S. Lecture 30.pdf
The Economic History of the U.S. Lecture 30.pdfThe Economic History of the U.S. Lecture 30.pdf
The Economic History of the U.S. Lecture 30.pdf
 
05_Annelore Lenoir_Docbyte_MeetupDora&Cybersecurity.pptx
05_Annelore Lenoir_Docbyte_MeetupDora&Cybersecurity.pptx05_Annelore Lenoir_Docbyte_MeetupDora&Cybersecurity.pptx
05_Annelore Lenoir_Docbyte_MeetupDora&Cybersecurity.pptx
 
02_Fabio Colombo_Accenture_MeetupDora&Cybersecurity.pptx
02_Fabio Colombo_Accenture_MeetupDora&Cybersecurity.pptx02_Fabio Colombo_Accenture_MeetupDora&Cybersecurity.pptx
02_Fabio Colombo_Accenture_MeetupDora&Cybersecurity.pptx
 
Veritas Interim Report 1 January–31 March 2024
Veritas Interim Report 1 January–31 March 2024Veritas Interim Report 1 January–31 March 2024
Veritas Interim Report 1 January–31 March 2024
 
VIP Independent Call Girls in Andheri 🌹 9920725232 ( Call Me ) Mumbai Escorts...
VIP Independent Call Girls in Andheri 🌹 9920725232 ( Call Me ) Mumbai Escorts...VIP Independent Call Girls in Andheri 🌹 9920725232 ( Call Me ) Mumbai Escorts...
VIP Independent Call Girls in Andheri 🌹 9920725232 ( Call Me ) Mumbai Escorts...
 

Empfohlen

AI Trends in Creative Operations 2024 by Artwork Flow.pdf
AI Trends in Creative Operations 2024 by Artwork Flow.pdfAI Trends in Creative Operations 2024 by Artwork Flow.pdf
AI Trends in Creative Operations 2024 by Artwork Flow.pdfmarketingartwork
 
PEPSICO Presentation to CAGNY Conference Feb 2024
PEPSICO Presentation to CAGNY Conference Feb 2024PEPSICO Presentation to CAGNY Conference Feb 2024
PEPSICO Presentation to CAGNY Conference Feb 2024Neil Kimberley
 
Content Methodology: A Best Practices Report (Webinar)
Content Methodology: A Best Practices Report (Webinar)Content Methodology: A Best Practices Report (Webinar)
Content Methodology: A Best Practices Report (Webinar)contently
 
How to Prepare For a Successful Job Search for 2024
How to Prepare For a Successful Job Search for 2024How to Prepare For a Successful Job Search for 2024
How to Prepare For a Successful Job Search for 2024Albert Qian
 
Social Media Marketing Trends 2024 // The Global Indie Insights
Social Media Marketing Trends 2024 // The Global Indie InsightsSocial Media Marketing Trends 2024 // The Global Indie Insights
Social Media Marketing Trends 2024 // The Global Indie InsightsKurio // The Social Media Age(ncy)
 
Trends In Paid Search: Navigating The Digital Landscape In 2024
Trends In Paid Search: Navigating The Digital Landscape In 2024Trends In Paid Search: Navigating The Digital Landscape In 2024
Trends In Paid Search: Navigating The Digital Landscape In 2024Search Engine Journal
 
5 Public speaking tips from TED - Visualized summary
5 Public speaking tips from TED - Visualized summary5 Public speaking tips from TED - Visualized summary
5 Public speaking tips from TED - Visualized summarySpeakerHub
 
ChatGPT and the Future of Work - Clark Boyd
ChatGPT and the Future of Work - Clark Boyd ChatGPT and the Future of Work - Clark Boyd
ChatGPT and the Future of Work - Clark Boyd Clark Boyd
 
Getting into the tech field. what next
Getting into the tech field. what next Getting into the tech field. what next
Getting into the tech field. what next Tessa Mero
 
Google's Just Not That Into You: Understanding Core Updates & Search Intent
Google's Just Not That Into You: Understanding Core Updates & Search IntentGoogle's Just Not That Into You: Understanding Core Updates & Search Intent
Google's Just Not That Into You: Understanding Core Updates & Search IntentLily Ray
 
Time Management & Productivity - Best Practices
Time Management & Productivity -  Best PracticesTime Management & Productivity -  Best Practices
Time Management & Productivity - Best PracticesVit Horky
 
The six step guide to practical project management
The six step guide to practical project managementThe six step guide to practical project management
The six step guide to practical project managementMindGenius
 
Beginners Guide to TikTok for Search - Rachel Pearson - We are Tilt __ Bright...
Beginners Guide to TikTok for Search - Rachel Pearson - We are Tilt __ Bright...Beginners Guide to TikTok for Search - Rachel Pearson - We are Tilt __ Bright...
Beginners Guide to TikTok for Search - Rachel Pearson - We are Tilt __ Bright...RachelPearson36
 
Unlocking the Power of ChatGPT and AI in Testing - A Real-World Look, present...
Unlocking the Power of ChatGPT and AI in Testing - A Real-World Look, present...Unlocking the Power of ChatGPT and AI in Testing - A Real-World Look, present...
Unlocking the Power of ChatGPT and AI in Testing - A Real-World Look, present...Applitools
 
12 Ways to Increase Your Influence at Work
12 Ways to Increase Your Influence at Work12 Ways to Increase Your Influence at Work
12 Ways to Increase Your Influence at WorkGetSmarter
 

Empfohlen (20)

AI Trends in Creative Operations 2024 by Artwork Flow.pdf
AI Trends in Creative Operations 2024 by Artwork Flow.pdfAI Trends in Creative Operations 2024 by Artwork Flow.pdf
AI Trends in Creative Operations 2024 by Artwork Flow.pdf
 
Skeleton Culture Code
Skeleton Culture CodeSkeleton Culture Code
Skeleton Culture Code
 
PEPSICO Presentation to CAGNY Conference Feb 2024
PEPSICO Presentation to CAGNY Conference Feb 2024PEPSICO Presentation to CAGNY Conference Feb 2024
PEPSICO Presentation to CAGNY Conference Feb 2024
 
Content Methodology: A Best Practices Report (Webinar)
Content Methodology: A Best Practices Report (Webinar)Content Methodology: A Best Practices Report (Webinar)
Content Methodology: A Best Practices Report (Webinar)
 
How to Prepare For a Successful Job Search for 2024
How to Prepare For a Successful Job Search for 2024How to Prepare For a Successful Job Search for 2024
How to Prepare For a Successful Job Search for 2024
 
Social Media Marketing Trends 2024 // The Global Indie Insights
Social Media Marketing Trends 2024 // The Global Indie InsightsSocial Media Marketing Trends 2024 // The Global Indie Insights
Social Media Marketing Trends 2024 // The Global Indie Insights
 
Trends In Paid Search: Navigating The Digital Landscape In 2024
Trends In Paid Search: Navigating The Digital Landscape In 2024Trends In Paid Search: Navigating The Digital Landscape In 2024
Trends In Paid Search: Navigating The Digital Landscape In 2024
 
5 Public speaking tips from TED - Visualized summary
5 Public speaking tips from TED - Visualized summary5 Public speaking tips from TED - Visualized summary
5 Public speaking tips from TED - Visualized summary
 
ChatGPT and the Future of Work - Clark Boyd
ChatGPT and the Future of Work - Clark Boyd ChatGPT and the Future of Work - Clark Boyd
ChatGPT and the Future of Work - Clark Boyd
 
Getting into the tech field. what next
Getting into the tech field. what next Getting into the tech field. what next
Getting into the tech field. what next
 
Google's Just Not That Into You: Understanding Core Updates & Search Intent
Google's Just Not That Into You: Understanding Core Updates & Search IntentGoogle's Just Not That Into You: Understanding Core Updates & Search Intent
Google's Just Not That Into You: Understanding Core Updates & Search Intent
 
How to have difficult conversations
How to have difficult conversations How to have difficult conversations
How to have difficult conversations
 
Introduction to Data Science
Introduction to Data ScienceIntroduction to Data Science
Introduction to Data Science
 
Time Management & Productivity - Best Practices
Time Management & Productivity -  Best PracticesTime Management & Productivity -  Best Practices
Time Management & Productivity - Best Practices
 
The six step guide to practical project management
The six step guide to practical project managementThe six step guide to practical project management
The six step guide to practical project management
 
Beginners Guide to TikTok for Search - Rachel Pearson - We are Tilt __ Bright...
Beginners Guide to TikTok for Search - Rachel Pearson - We are Tilt __ Bright...Beginners Guide to TikTok for Search - Rachel Pearson - We are Tilt __ Bright...
Beginners Guide to TikTok for Search - Rachel Pearson - We are Tilt __ Bright...
 
Unlocking the Power of ChatGPT and AI in Testing - A Real-World Look, present...
Unlocking the Power of ChatGPT and AI in Testing - A Real-World Look, present...Unlocking the Power of ChatGPT and AI in Testing - A Real-World Look, present...
Unlocking the Power of ChatGPT and AI in Testing - A Real-World Look, present...
 
12 Ways to Increase Your Influence at Work
12 Ways to Increase Your Influence at Work12 Ways to Increase Your Influence at Work
12 Ways to Increase Your Influence at Work
 
ChatGPT webinar slides
ChatGPT webinar slidesChatGPT webinar slides
ChatGPT webinar slides
 
More than Just Lines on a Map: Best Practices for U.S Bike Routes
More than Just Lines on a Map: Best Practices for U.S Bike RoutesMore than Just Lines on a Map: Best Practices for U.S Bike Routes
More than Just Lines on a Map: Best Practices for U.S Bike Routes
 

Bull and bear markets

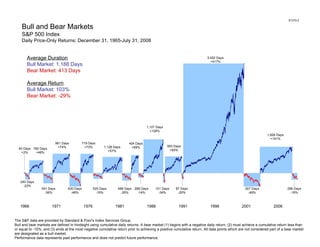
  • 1. S1370.2 Bull and Bear Markets S&P 500 Index Daily Price-Only Returns: December 31, 1965-July 31, 2008 The S&P data are provided by Standard & Poor's Index Services Group. Bull and bear markets are defined in hindsight using cumulative daily returns. A bear market (1) begins with a negative daily return, (2) must achieve a cumulative return less than or equal to -15%, and (3) ends at the most negative cumulative return prior to achieving a positive cumulative return. All data points which are not considered part of a bear market are designated as a bull market. Performance data represents past performance and does not predict future performance. Average Duration Bull Market: 1,188 Days Bear Market: 413 Days Average Return Bull Market: 103% Bear Market: -29% 40 Days +2% 240 Days -22% 541 Days -36% 630 Days -48% 525 Days -19% 498 Days -25% 288 Days -14% 101 Days -34% 87 Days -20% 927 Days -49% 296 Days -19% 782 Days +48% 961 Days +74% 719 Days +73% 1,128 Days +57% 424 Days +69% 1,127 Days +128% 953 Days +65% 3,452 Days +417% 1,826 Days +101% 1966 1971 1976 1981 1986 1991 1996 2001 2006
  • 2. Bull and Bear Markets S&P 500 Index (USD) Monthly Returns: January 1926-July 2008 The S&P data are provided by Standard & Poor's Index Services Group. Bull and bear markets are defined in hindsight using cumulative monthly returns. A bear market (1) begins with a negative monthly return, (2) must achieve a cumulative return less than or equal to -10%, and (3) ends at the most negative cumulative return prior to achieving a positive cumulative return. All data points which are not considered part of a bear market are designated as a bull market. 1925 1930 1935 1940 1945 1950 1960 1965 1970 1975 1980 1985 1990 2000 2005 Average Duration: Bull Market: 32 Months Bear Market: 11 Months Months = Duration of Bull/Bear Mkt. % = Total Return for the Bull/Bear Mkt. 44 months 193% 34 months -83% 2 months 92% 6 months 100% 3 months 26% 4 months 12% 23 months 133% 6 months -30% 2 months -19% 6 months -21% 4 months -10% 9 months 61% 5 months 22% 4 mos. -16% 31 mos. -30% 49 months 210% 6 months -22% 116 months 491% 13 mos. -50% 5 mos. 12% 7 months -10% 5 months -15% 48 mos. 105% 6 months -22% 9 mos. 55% 15 mos. 35% 20 mos. -17% 61 months 282% 3 months -30% 30 mos. 71% 2 mos. -15% 92 months 355% 24 mos. 63% 9 months -17% 61 months 108% 8 months -16% 19 mos. -29% 21 months -43% 3 mos. -11% 5 months -15% 25 months -45% 43 months 90% 26 mos. 52% 30 months 76% 33 months 86% 14 mos. -14% S1370.2
  • 3. Bull and Bear Markets Russell 2000 Index (USD) Monthly Returns: January 1979-July 2008 Russell data copyright © Russell Investment Group 1995-2008, all rights reserved. Bull and bear markets are defined in hindsight using cumulative monthly returns. A bear market (1) begins with a negative monthly return, (2) must achieve a cumulative return less than or equal to -10%, and (3) ends at the most negative cumulative return prior to achieving a positive cumulative return. All data points which are not considered part of a bear market are designated as a bull market. 1979 1981 1983 1985 1987 1989 1991 1993 1995 1997 1999 2001 2003 2005 2007 8 mos. 38% 2 mos. 11% 3 mos. 26% 2 mos. -20% 14 months 82% 14 months -22% 11 months 100% 13 months -21% 22 months 69% 4 months -12% 11 mos. 32% 3 months -36% 22 months 65% 13 months -32% 67 months 234% 2 months -12% 21 months 57% 4 months -30% 18 months 74% 31 months -35% 2 months 12% 3 months -11% 22 months 85% 4 months -11% 25 months 50% 9 months -18% 4 months 1% Average Duration: Bull Market: 18 Months Bear Market: 8 Months Months = Duration of Bull/Bear Market % = Total Return for the Bull/Bear Market S1370.2
  • 4. Bull and Bear Markets MSCI EAFE Index, Net Dividends (USD) Monthly Returns: January 1970-July 2008 MSCI data copyright MSCI 2008, all rights reserved. Bull and bear markets are defined in hindsight using cumulative monthly returns. A bear market (1) begins with a negative monthly return, (2) must achieve a cumulative return less than or equal to -10%, and (3) ends at the most negative cumulative return prior to achieving a positive cumulative return. All data points which are not considered part of a bear market are designated as a bull market. 1970 1972 1974 1976 1978 1980 1982 1984 1986 1988 1990 1992 1994 1996 1998 2000 2002 2004 2006 2008 7 months 41% 4 mos. 19% 5 months -15% 34 months 103% 18 months -42% 39 months 93% 5 mos. -13% 13 months 36% 15 mos. 53% 18 mos. 67% 2 mos. -11% 37 months 323% 17 months -20% 26 months 47% 4 months -17% 2 months -15% 57 months 93% 9 months -31% 5 months 26% 20 months -15% 8 mos. 18% 55 months 206% 4 mos. -11% 9 months 19% Average Duration: Bull Market: 24 Months Bear Market: 10 Months Months = Duration of Bull/Bear Market % = Total Return for the Bull/Bear Market 2 mos. -15% 39 months -48% 9 mos. -13% S1370.2
  • 5. Bull and Bear Markets MSCI Emerging Markets Index, Gross Dividends (USD) Monthly Returns: January 1988-July 2008 MSCI data copyright MSCI 2008, all rights reserved. Bull and bear markets are defined in hindsight using cumulative monthly returns. A bear market (1) begins with a negative monthly return, (2) must achieve a cumulative return less than or equal to -10%, and (3) ends at the most negative cumulative return prior to achieving a positive cumulative return. All data points which are not considered part of a bear market are designated as a bull market. 1988 1989 1990 1991 1992 1993 1994 1995 1996 1997 1998 1999 2000 2001 2002 2003 2004 2005 2006 2007 8 mos. 43% 4 mos. 31% 1 mo. -12% 17 months 98% 1 mo. -14% 16 months 101% 4 months -29% 17 months 92% 5 months -14% 5 mos. 21% 3 months -12% 29 months 38% 5 months -25% 19 months 114% 13 months -56% 18 months -48% 7 months 42% 5 months -24% 18 months 89% 4 months -11% 21 months 109% 16 months 85% 2 months -11% 9 months 21% Average Duration: Bull Market: 15 Months Bear Market: 6 Months Months = Duration of Bull/Bear Market % = Total Return for the Bull/Bear Market S1370.2

Hinweis der Redaktion

  1. Talking Points: This graph documents bull and bear market periods in the S&P 500 Index from December 31, 1965 to July 31, 2008. Financial Management, a Blue-Ash, ohio based fee-only advisor uses this historical information to help structure a global diversified portfolio using low cost, institutional class mutual funds and ETF’s, with an emphasis on using institutional mutual funds by DFA, Dimensional Fund Advisors. See more at www.fmgonline.com The market cycles are identified in hindsight using historical cumulative daily returns. These are price-only returns which do not consider the payment or reinvestment of dividends. All observations are performed after the fact. A bear market is identified in hindsight when the market experiences a negative daily return followed by a cumulative loss of at least 15%. The bear market ends at its low point, which is defined as the day of the greatest negative cumulative return before the reversal. A bull market is defined by data points not considered part of a bear market. The rising trend lines in blue designate the bull markets occurring since 1965, and the falling trend lines in red document the bear markets. The bars that frame the trend lines help to describe the length and intensity of the gains and losses. The numbers above or below the bars indicate the duration (in calendar days) and cumulative return percentage of the bull or bear market. Keep in mind that this graph does not show total compounded returns or growth of wealth since 1965. Once the cycle is established in retrospect, the first day of that cycle resets the performance baseline to zero. Investors may draw a number of lessons from this graph. First, since 1965, bull markets in the S&P 500 Index have lasted longer than bear markets and delivered price gains that are disproportionately greater than the bear market losses. Second, fluctuating performance within each trend illustrates that volatility and uncertainty occur even within established market cycles: bull markets may have short-term dips, and bear markets may have short-term advances. The immediate trend is not readily apparent to market observers, and in fact, may become clear only in hindsight. This illustrates the difficulty of accurately predicting and timing market cycles. Finally, the graph suggests the importance of maintaining a disciplined investment approach that views market events and trends from a long-term perspective. Investors who react emotionally to short-term movements are at risk of making ill-timed decisions that compromise long-term performance.
  2. Talking Points: This graph documents bull and bear market periods in the S&P 500 Index from January 1926 to July 2008.   The market cycles are identified in hindsight, applying the same methodology as the other slides in the “Bull and Bear Markets” series. Monthly index returns are total returns, which include reinvestment of dividends. Financial Management, a Blue-Ash, ohio based fee-only advisor uses this historical information to help structure a global diversified portfolio using low cost, institutional class mutual funds and ETF’s, with an emphasis on using institutional mutual funds by DFA, Dimensional Fund Advisors. See more at www.fmgonline.com
  3. Talking Points: This graph documents bull and bear market periods in the Russell 2000 Index from January 1979 to July 2008.   The market cycles are identified in hindsight, applying the same methodology as the other slides in the “Bull and Bear Markets” series. Monthly index returns are total returns, which include reinvestment of dividends. Financial Management, a Blue-Ash, ohio based fee-only advisor uses this historical information to help structure a global diversified portfolio using low cost, institutional class mutual funds and ETF’s, with an emphasis on using institutional mutual funds by DFA, Dimensional Fund Advisors. See more at www.fmgonline.com
  4. Talking Points: This graph documents bull and bear market periods in the MSCI EAFE Index from January 1970 to July 2008. Financial Management, a Blue-Ash, ohio based fee-only advisor uses this historical information to help structure a global diversified portfolio using low cost, institutional class mutual funds and ETF’s, with an emphasis on using institutional mutual funds by DFA, Dimensional Fund Advisors. See more at www.fmgonline.com The market cycles are identified in hindsight using historical cumulative monthly returns. These returns consider the reinvestment of dividends, net of foreign government withholding taxes. All monthly observations are performed after the fact. A bear market is identified in hindsight when the market experiences a negative monthly return followed by a cumulative loss of at least 10%. The bear market ends at its low point, which is defined as the month of the greatest negative cumulative return before the reversal. A bull market is defined by data points not considered part of a bear market. The rising trend lines in blue designate the bull markets occurring since 1970, and the falling trend lines in red document the bear markets. The bars that frame the trend lines help to describe the length and intensity of the gains and losses. The numbers above or below the bars indicate the duration (in months) and cumulative return percentage of the bull or bear market. Keep in mind that this graph does not show total compounded returns or growth of wealth since 1970. Once the cycle is established in retrospect, the first month of that cycle resets the performance baseline to zero. Investors may draw a number of lessons from this graph. First, since 1970, bull markets in the MSCI EAFE Index have lasted longer than bear markets and delivered gains that are disproportionately greater than the bear market losses. Keep in mind, however, that this time series is relatively short. Second, fluctuating performance within each trend illustrates that volatility and uncertainty occur even within established market cycles: bull markets may have short-term dips, and bear markets may have short-term advances. The immediate trend is not readily apparent to market observers, and in fact, may become clear only in hindsight. This illustrates the difficulty of accurately predicting and timing market cycles. Finally, the graph suggests the importance of maintaining a disciplined investment approach that views market events and trends from a long-term perspective. Investors who react emotionally to short-term movements are at risk of making ill-timed decisions that compromise long-term performance.
  5. Talking Points: This graph documents bull and bear market periods in the MSCI Emerging Markets Index from January 1988 to July 2008. Financial Management, a Blue-Ash, ohio based fee-only advisor uses this historical information to help structure a global diversified portfolio using low cost, institutional class mutual funds and ETF’s, with an emphasis on using institutional mutual funds by DFA, Dimensional Fund Advisors. See more at www.fmgonline.com The market cycles are identified in hindsight, applying the same methodology as the other slides in the “Bull and Bear Markets” series. Monthly index returns include the reinvestment of gross dividends.   The graph demonstrates the same principles as the previous data:   In the data since 1988, which is a relatively short time series, bull markets in the MSCI Emerging Markets Index have lasted longer than bear markets and delivered gains that are disproportionately greater than the bear market losses. Index performance fluctuates, even within established market cycles. Investors who maintain a disciplined investment approach may avoid making ill-timed decisions amidst the market volatility.