BPPG response - Options for Defined Benefit schemes - 19Apr24.pdf
coca cola Reconciliation of Q4 and Full Year 2008 Non-GAAP financial measures
1. Page 1 of 5
The Company reports its financial results in accordance with U.S. generally accepted accounting principles (GAAP). However, management believes that certain non-GAAP
financial measures used in managing the business may provide users of this financial information additional meaningful comparisons between current results and results in
prior operating periods. Management believes that these non-GAAP financial measures can provide additional meaningful reflection of underlying trends of the business
because they provide a comparison of historical information that excludes certain items that impact the overall comparability. Management also uses these non-GAAP
financial measures in making financial, operating and planning decisions and in evaluating the Company's performance. See the Tables below for supplemental financial
data and corresponding reconciliations to GAAP financial measures for the three months ended December 31, 2008 and December 31, 2007. Non-GAAP financial measures
should be viewed in addition to, and not as an alternative for, the Company’s reported results prepared in accordance with GAAP.
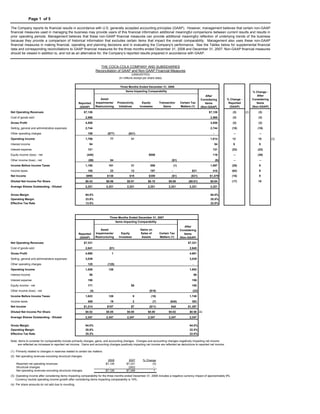
THE COCA-COLA COMPANY AND SUBSIDIARIES
Reconciliation of GAAP and Non-GAAP Financial Measures
(UNAUDITED)
(In millions except per share data)
Three Months Ended December 31, 2008
Items Impacting Comparability % Change -
After
After
Asset % Change - Considering
Considering
Impairments/ Productivity Equity Transaction Certain Tax Reported Items
Reported Items
Restructuring Initiatives Investees Gains Matters (1) (GAAP) (Non-GAAP)
(GAAP) (Non-GAAP)
Net Operating Revenues $7,126 $7,126 (3) (2) (3)
Cost of goods sold 2,568 2,568 (3) (3)
Gross Profit 4,558 4,558 (3) (3)
Selling, general and administrative expenses 2,744 2,744 (10) (10)
Other operating charges 108 ($77) ($31) - -- --
Operating Income 1,706 77 31 1,814 12 10 (3)
Interest income 94 94 9 9
Interest expense 121 121 (22) (22)
Equity income (loss) - net (440) $556 116 -- (36)
Other income (loss) - net (89) 84 ($1) (6) -- --
Income Before Income Taxes 1,150 161 31 556 (1) 1,897 (29) 9
Income taxes 155 23 12 197 - $31 418 (62) 9
Net Income $995 $138 $19 $359 ($1) ($31) $1,479 (18) 9
Diluted Net Income Per Share $0.43 $0.06 $0.01 $0.15 $0.00 ($0.01) $0.64 (17) 10
Average Shares Outstanding - Diluted 2,321 2,321 2,321 2,321 2,321 2,321 2,321
Gross Margin 64.0% 64.0%
Operating Margin 23.9% 25.5%
Effective Tax Rate 13.5% 22.0%
Three Months Ended December 31, 2007
Items Impacting Comparability
After
Asset Gains on Considering
Impairments/ Equity Sales of Certain Tax
Reported Items
Restructuring Investees Assets Matters (1)
(GAAP) (Non-GAAP)
Net Operating Revenues $7,331 $7,331
Cost of goods sold 2,641 ($1) 2,640
Gross Profit 4,690 1 4,691
Selling, general and administrative expenses 3,039 3,039
Other operating charges 125 (125) -
Operating Income 1,526 126 1,652
Interest income 86 86
Interest expense 156 156
Equity income - net 171 $9 180
Other income (loss) - net (4) ($18) (22)
Income Before Income Taxes 1,623 126 9 (18) 1,740
Income taxes 409 19 2 (7) ($40) 383
Net Income $1,214 $107 $7 ($11) $40 $1,357
Diluted Net Income Per Share $0.52 $0.05 $0.00 $0.00 $0.02 $0.58 (4)
Average Shares Outstanding - Diluted 2,347 2,347 2,347 2,347 2,347 2,347
Gross Margin 64.0% 64.0%
Operating Margin 20.8% 22.5%
Effective Tax Rate 25.2% 22.0%
Note: Items to consider for comparability include primarily charges, gains, and accounting changes. Charges and accounting changes negatively impacting net income
are reflected as increases to reported net income. Gains and accounting changes positively impacting net income are reflected as deductions to reported net income.
(1) Primarily related to changes in reserves related to certain tax matters.
(2) Net operating revenues excluding structural changes:
2008 2007 % Change
Reported net operating revenues $7,126 $7,331 (3)
Structural changes - (262) --
Net operating revenues excluding structural changes $7,126 $7,069 1
(3) Operating income after considering items impacting comparability for the three months ended December 31, 2008 includes a negative currency impact of approximately 9%.
Currency neutral operating income growth after considering items impacting comparability is 19%.
(4) Per share amounts do not add due to rounding.
2. Page 2 of 5
The Company reports its financial results in accordance with U.S. generally accepted accounting principles (GAAP). However, management believes that certain non-GAAP
financial measures used in managing the business may provide users of this financial information additional meaningful comparisons between current results and results in
prior operating periods. Management believes that these non-GAAP financial measures can provide additional meaningful reflection of underlying trends of the business
because they provide a comparison of historical information that excludes certain items that impact the overall comparability. Management also uses these non-GAAP
financial measures in making financial, operating and planning decisions and in evaluating the Company's performance. See the Tables below for supplemental financial
data and corresponding reconciliations to GAAP financial measures for the years ended December 31, 2008 and December 31, 2007. Non-GAAP financial measures should
be viewed in addition to, and not as an alternative for, the Company’s reported results prepared in accordance with GAAP.
THE COCA-COLA COMPANY AND SUBSIDIARIES
Reconciliation of GAAP and Non-GAAP Financial Measures
(UNAUDITED)
(In millions except per share data)
Year Ended December 31, 2008
Items Impacting Comparability % Change -
After
After
Asset % Change - Considering
Considering
Impairments/ Productivity Equity Transaction Certain Tax Reported Items
Reported Items
Restructuring Initiatives Investees Gains Matters (1) (GAAP) (Non-GAAP)
(GAAP) (Non-GAAP)
Net Operating Revenues $31,944 $31,944 11 (2) 11
Cost of goods sold 11,374 11,374 9 9
Gross Profit 20,570 20,570 11 11
Selling, general and administrative expenses 11,774 11,774 8 8
Other operating charges 350 ($295) ($55) - -- --
Operating Income 8,446 295 55 8,796 16 17 (3)
Interest income 333 333 41 41
Interest expense 438 438 (4) (4)
Equity income (loss) - net (874) $1,686 812 -- (1)
Other income (loss) - net (28) 84 ($119) (63) -- --
Income Before Income Taxes 7,439 379 55 1,686 (119) 9,440 (6) 17
Income taxes 1,632 66 21 392 (29) ($5) 2,077 (14) 17
Net Income $5,807 $313 $34 $1,294 ($90) $5 $7,363 (3) 17
Diluted Net Income Per Share $2.49 $0.13 $0.01 $0.55 ($0.04) $0.00 $3.15 (4) (3) 17
Average Shares Outstanding - Diluted 2,336 2,336 2,336 2,336 2,336 2,336 2,336
Gross Margin 64.4% 64.4%
Operating Margin 26.4% 27.5%
Effective Tax Rate 21.9% 22.0%
Year Ended December 31, 2007
Items Impacting Comparability
After
Asset Gains on Considering
Impairments/ Equity Sales of Certain Tax
Reported Items
Restructuring Investees Assets Matters (1)
(GAAP) (Non-GAAP)
Net Operating Revenues $28,857 $28,857
Cost of goods sold 10,406 ($14) 10,392
Gross Profit 18,451 14 18,465
Selling, general and administrative expenses 10,945 10,945
Other operating charges 254 (254) -
Operating Income 7,252 268 7,520
Interest income 236 236
Interest expense 456 456
Equity income - net 668 $150 818
Other income (loss) - net 173 ($227) (54)
Income Before Income Taxes 7,873 268 150 (227) 8,064
Income taxes 1,892 49 21 (111) ($77) 1,774
Net Income $5,981 $219 $129 ($116) $77 $6,290
Diluted Net Income Per Share $2.57 $0.09 $0.06 ($0.05) $0.03 $2.70
Average Shares Outstanding - Diluted 2,331 2,331 2,331 2,331 2,331 2,331
Gross Margin 63.9% 64.0%
Operating Margin 25.1% 26.1%
Effective Tax Rate 24.0% 22.0%
Note: Items to consider for comparability include primarily charges, gains, and accounting changes. Charges and accounting changes negatively impacting net income
are reflected as increases to reported net income. Gains and accounting changes positively impacting net income are reflected as deductions to reported net income.
(1) Primarily related to changes in reserves related to certain tax matters.
(2) Net operating revenues excluding structural changes:
2008 2007 % Change
Reported net operating revenues $31,944 $28,857 11
Structural changes (912) (816) --
Net operating revenues excluding structural changes $31,032 $28,041 11
(3) Operating income after considering items impacting comparability for the year ended December 31, 2008 includes a positive currency impact of approximately 6%.
Currency neutral operating income growth after considering items impacting comparability is 11%.
(4) Per share amounts do not add due to rounding.
3. Page 3 of 5
The Company reports its financial results in accordance with U. S. generally accepted accounting principles (GAAP). However, management believes that certain non-GAAP financial
measures used in managing the business may provide users of this financial information additional meaningful comparisons between current results and results in prior operating
periods. Management believes that these non-GAAP financial measures can provide additional meaningful reflection of underlying trends of the business because they provide a
comparison of historical information that excludes certain items that impact the overall comparability. Management also uses these non-GAAP financial measures in making financial,
operating and planning decisions and in evaluating the Company's performance. See the Table below for supplemental financial data and corresponding reconciliations to GAAP
financial measures for the three months ended December 31, 2008 and December 31, 2007. Non-GAAP financial measures should be viewed in addition to, and not as an alternative
for, the Company’s reported results prepared in accordance with GAAP.
THE COCA-COLA COMPANY AND SUBSIDIARIES
Reconciliation of GAAP and Non-GAAP Financial Measures
Operating Income (Loss) by Segment
(UNAUDITED)
(In millions)
Three Months Ended December 31, 2008 Three Months Ended December 31, 2007
Items
Impacting
Comparability
Items Impacting Comparability
% Favorable
(Unfavorable) -
% Favorable After
After After
(Unfavorable) - Considering
Considering Considering
Asset Asset
Reported
Impairments/ Productivity Impairments/ Items
Reported Items Reported Items
(GAAP)
Restructuring Initiatives Restructuring (Non-GAAP)
(GAAP) (Non-GAAP) (GAAP) (Non-GAAP)
Eurasia & Africa $158 $1 $159 $188 $2 $190 (16) (16)
Europe 628 628 549 21 570 14 10
Latin America 503 503 491 1 492 2 2
North America 411 44 455 402 10 412 2 10
Pacific 375 375 393 2 395 (5) (5)
Bottling Investments 25 21 46 22 4 26 14 77
Corporate (394) 11 $31 (352) (519) 86 (433) 24 19
Consolidated $1,706 $77 $31 $1,814 $1,526 $126 $1,652 12 10
4. Page 4 of 5
The Company reports its financial results in accordance with U. S. generally accepted accounting principles (GAAP). However, management believes that certain non-GAAP financial
measures used in managing the business may provide users of this financial information additional meaningful comparisons between current results and results in prior operating
periods. Management believes that these non-GAAP financial measures can provide additional meaningful reflection of underlying trends of the business because they provide a
comparison of historical information that excludes certain items that impact the overall comparability. Management also uses these non-GAAP financial measures in making financial,
operating and planning decisions and in evaluating the Company's performance. See the Table below for supplemental financial data and corresponding reconciliations to GAAP
financial measures for the years ended December 31, 2008 and December 31, 2007. Non-GAAP financial measures should be viewed in addition to, and not as an alternative for, the
Company’s reported results prepared in accordance with GAAP.
THE COCA-COLA COMPANY AND SUBSIDIARIES
Reconciliation of GAAP and Non-GAAP Financial Measures
Operating Income (Loss) by Segment
(UNAUDITED)
(In millions)
Year Ended December 31, 2008 Year Ended December 31, 2007
Items
Impacting
Comparability
Items Impacting Comparability
% Favorable
(Unfavorable) -
% Favorable After
After After
(Unfavorable) - Considering
Considering Considering
Asset Asset
Reported
Impairments/ Productivity Impairments/ Items
Reported Items Reported Items
(GAAP)
Restructuring Initiatives Restructuring (Non-GAAP)
(GAAP) (Non-GAAP) (GAAP) (Non-GAAP)
Eurasia & Africa $834 $1 $835 $667 $37 $704 25 19
Europe 3,175 3,175 2,775 33 2,808 14 13
Latin America 2,099 1 2,100 1,749 4 1,753 20 20
North America 1,584 56 1,640 1,696 23 1,719 (7) (5)
Pacific 1,858 1,858 1,699 3 1,702 9 9
Bottling Investments 264 46 310 153 47 200 73 55
Corporate (1,368) 191 $55 (1,122) (1,487) 121 (1,366) 8 18
Consolidated $8,446 $295 $55 8,796 $7,252 $268 $7,520 16 17
5. Page 5 of 5
The Company reports its financial results in accordance with U.S. generally accepted accounting principles (GAAP). However, management believes that certain non-GAAP financial measures used in managing the
business may provide users of this financial information additional meaningful comparisons between current results and results in prior operating periods. Management believes that these non-GAAP financial measures
can provide additional meaningful reflection of underlying trends of the business because they provide a comparison of historical information that excludes certain items that impact the overall comparability.
Management also uses these non-GAAP financial measures in making financial, operating and planning decisions and in evaluating the Company's performance. See the Table below for supplemental financial data
and corresponding reconciliations to GAAP financial measures for the years ended December 31, 2008 and December 31, 2007. Non-GAAP financial measures should be viewed in addition to, and not as an
alternative for, the Company’s reported results prepared in accordance with GAAP.
THE COCA-COLA COMPANY AND SUBSIDIARIES
Reconciliation of GAAP and Non-GAAP Financial Measures
Net Cash Provided by Operating Activities
(UNAUDITED)
(In Millions)
Year Ended December 31, 2008 Year Ended December 31, 2007
Items Impacting Comparability Items Impacting Comparability % Change -
Cash Payments After
After After
Cash Payments Related to Cash Payment Cash Payments Cash Benefit % Change - Considering
Considering Considering
Related to Productivity Related to Tax Related to Related to Tax Reported Items
Reported Items Reported Items
Restructuring Initiatives Matter Restructuring Matter (GAAP) (Non-GAAP)
(GAAP) (Non-GAAP) (GAAP) (Non-GAAP)
Net Cash Provided by Operating Activities $7,571 $186 $38 $179 $7,974 $7,150 $83 ($154) $7,079 6 13