coca cola Reconciliation of Q4 and Full Year 2007 Non-GAAP Financial Measures
1. Page 1 of 4
The Company reports its financial results in accordance with U.S. generally accepted accounting principles (GAAP). However, management believes that certain non-GAAP financial measures used in
managing the business may provide users of this financial information additional meaningful comparisons between current results and results in prior operating periods. Management believes that these
non-GAAP financial measures can provide additional meaningful reflection of underlying trends of the business because they provide a comparison of historical information that excludes certain items that
impact the overall comparability. Management also uses these non-GAAP financial measures in making financial, operating and planning decisions and in evaluating the Company's performance. See
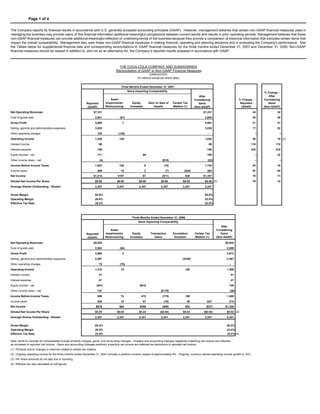
the Tables below for supplemental financial data and corresponding reconciliations to GAAP financial measures for the three months ended December 31, 2007 and December 31, 2006. Non-GAAP
financial measures should be viewed in addition to, and not as an alternative for, the Company’s reported results prepared in accordance with GAAP.
THE COCA-COLA COMPANY AND SUBSIDIARIES
Reconciliation of GAAP to Non-GAAP Financial Measures
(UNAUDITED)
(In millions except per share data)
Three Months Ended December 31, 2007
Items Impacting Comparability
% Change -
After
After
Asset % Change - Considering
Considering
Impairments/ Equity Gain on Sale of Certain Tax Reported Items
Reported Items
Restructuring Investees Assets Matters (1) (GAAP) (Non-GAAP)
(GAAP) (Non-GAAP)
Net Operating Revenues $7,331 $7,331 24 24
Cost of goods sold 2,641 ($1) 2,640 28 28
Gross Profit 4,690 1 4,691 21 21
Selling, general and administrative expenses 3,039 3,039 17 22
Other operating charges 125 (125) - -- --
Operating Income 1,526 126 1,652 26 19 (2)
Interest income 86 86 110 110
Interest expense 156 156 232 232
Equity income - net 171 $9 180 -- 22
Other income (loss) - net (4) ($18) (22) -- --
Income Before Income Taxes 1,623 126 9 (18) 1,740 83 16
Income taxes 409 19 2 (7) ($40) 383 97 40
Net Income $1,214 $107 $7 ($11) $40 $1,357 79 11
Diluted Net Income Per Share $0.52 $0.05 $0.00 $0.00 $0.02 $0.58 (3) 79 12
Average Shares Outstanding - Diluted 2,347 2,347 2,347 2,347 2,347 2,347
Gross Margin 64.0% 64.0%
Operating Margin 20.8% 22.5%
Effective Tax Rate 25.2% 22.0%
Three Months Ended December 31, 2006
Items Impacting Comparability
After
Asset Considering
Impairments/ Equity Transaction Foundation Certain Tax Items
Reported
Restructuring Investees Gains Donation Matters (1) (Non-GAAP)
(GAAP)
Net Operating Revenues $5,932 $5,932
Cost of goods sold 2,063 ($4) 2,059
Gross Profit 3,869 4 3,873
Selling, general and administrative expenses 2,587 ($100) 2,487
Other operating charges 70 (70) -
Operating Income 1,212 74 100 1,386
Interest income 41 41
Interest expense 47 47
Equity income - net (467) $615 148
Other income (loss) - net 147 ($175) (28)
Income Before Income Taxes 886 74 615 (175) 100 1,500
Income taxes 208 10 57 (76) 38 $37 274
Net Income $678 $64 $558 ($99) $62 ($37) $1,226
Diluted Net Income Per Share $0.29 $0.03 $0.24 ($0.04) $0.03 ($0.02) $0.52 (3)
Average Shares Outstanding - Diluted 2,341 2,341 2,341 2,341 2,341 2,341 2,341
Gross Margin 65.2% 65.3%
Operating Margin 20.4% 23.4%
Effective Tax Rate 23.5% 18.2% (4)
Note: Items to consider for comparability include primarily charges, gains, and accounting changes. Charges and accounting changes negatively impacting net income are reflected
as increases to reported net income. Gains and accounting changes positively impacting net income are reflected as deductions to reported net income.
(1) Primarily due to changes in reserves related to certain tax matters.
(2) Ongoing operating income for the three months ended December 31, 2007 includes a positive currency impact of approximately 9%. Ongoing, currency neutral operating income growth is 10%.
(3) Per share amounts do not add due to rounding.
(4) Effective tax rate calculated on full figures.
2. Page 2 of 4
The Company reports its financial results in accordance with U.S. generally accepted accounting principles (GAAP). However, management believes that certain non-GAAP financial
measures used in managing the business may provide users of this financial information additional meaningful comparisons between current results and results in prior operating periods.
Management believes that these non-GAAP financial measures can provide additional meaningful reflection of underlying trends of the business because they provide a comparison of
historical information that excludes certain items that impact the overall comparability. Management also uses these non-GAAP financial measures in making financial, operating and
planning decisions and in evaluating the Company's performance. See the Tables below for supplemental financial data and corresponding reconciliations to GAAP financial measures for
the years ended December 31, 2007 and December 31, 2006. Non-GAAP financial measures should be viewed in addition to, and not as an alternative for, the Company’s reported results
prepared in accordance with GAAP.
THE COCA-COLA COMPANY AND SUBSIDIARIES
Reconciliation of GAAP to Non-GAAP Financial Measures
(UNAUDITED)
(In millions except per share data)
Year Ended December 31, 2007
Items Impacting Comparability % Change -
After
After
Asset % Change - Considering
Considering
Impairments/ Equity Gains on Sales Certain Tax Reported Items
Reported Items
Restructuring Investees of Assets Matters (1) (GAAP) (Non-GAAP)
(GAAP) (Non-GAAP)
Net Operating Revenues $28,857 $28,857 20 20 (2)
Cost of goods sold 10,406 ($14) 10,392 27 27
Gross Profit 18,451 14 18,465 16 16
Selling, general and administrative expenses 10,945 10,945 16 17
Other operating charges 254 (254) - -- --
Operating Income 7,252 268 7,520 15 14 (3)
Interest income 236 236 22 22
Interest expense 456 456 107 107
Equity income - net 668 $150 818 555 16
Other income (loss) - net 173 ($227) (54) -- --
Income Before Income Taxes 7,873 268 150 (227) 8,064 20 12
Income taxes 1,892 49 21 (111) ($77) 1,774 26 10
Net Income $5,981 $219 $129 ($116) $77 $6,290 18 13
Diluted Net Income Per Share $2.57 $0.09 $0.06 ($0.05) $0.03 $2.70 19 14
Average Shares Outstanding - Diluted 2,331 2,331 2,331 2,331 2,331 2,331
Gross Margin 63.9% 64.0%
Operating Margin 25.1% 26.1%
Effective Tax Rate 24.0% 22.0%
Year Ended December 31, 2006
Items Impacting Comparability
After
Asset Considering
Impairments/ Equity Transaction Foundation Certain Tax
Reported Items
Restructuring Investees Gains Donation Matters (1)
(GAAP) (Non-GAAP)
Net Operating Revenues $24,088 $24,088
Cost of goods sold 8,164 ($4) 8,160
Gross Profit 15,924 4 15,928
Selling, general and administrative expenses 9,431 ($100) 9,331
Other operating charges 185 (185) -
Operating Income 6,308 189 100 6,597
Interest income 193 193
Interest expense 220 220
Equity income - net 102 $606 708
Other income (loss) - net 195 ($298) (103)
Income Before Income Taxes 6,578 189 606 (298) 100 7,175
Income taxes 1,498 30 57 8 38 ($24) 1,607
Net Income $5,080 $159 $549 ($306) $62 $24 $5,568
Diluted Net Income Per Share $2.16 $0.07 $0.23 ($0.13) $0.03 $0.01 $2.37
Average Shares Outstanding - Diluted 2,350 2,350 2,350 2,350 2,350 2,350 2,350
Gross Margin 66.1% 66.1%
Operating Margin 26.2% 27.4%
Effective Tax Rate 22.8% 22.4%
Note: Items to consider for comparability include primarily charges, gains, and accounting changes. Charges and accounting changes negatively impacting net income are reflected
as increases to reported net income. Gains and accounting changes positively impacting net income are reflected as deductions to reported net income.
(1) Primarily due to changes in reserves related to certain tax matters.
(2) Net operating revenues excluding structural changes:
2007 2006 % Change
Reported net operating revenues $28,857 $24,088 20%
Structural changes (1,762) -- --
Net operating revenues excluding structural changes $27,095 $24,088 12%
(3) Ongoing operating income for the year ended December 31, 2007 includes a positive currency impact of approximately 4%. Ongoing, currency neutral operating income growth is 10%.
3. Page 3 of 4
The Company reports its financial results in accordance with U. S. generally accepted accounting principles (GAAP). However, management believes that certain non-GAAP
financial measures used in managing the business may provide users of this financial information additional meaningful comparisons between current results and results in prior
operating periods. Management believes that these non-GAAP financial measures can provide additional meaningful reflection of underlying trends of the business because they
provide a comparison of historical information that excludes certain items that impact the overall comparability. Management also uses these non-GAAP financial measures in
making financial, operating and planning decisions and in evaluating the Company's performance. See the Table below for supplemental financial data and corresponding
reconciliations to GAAP financial measures for the three months ended December 31, 2007 and December 31, 2006. Non-GAAP financial measures should be viewed in addition to,
and not as an alternative for, the Company’s reported results prepared in accordance with GAAP.
THE COCA-COLA COMPANY AND SUBSIDIARIES
Reconciliation of GAAP to Non-GAAP Financial Measures
Operating Income (Loss) by Segment
(UNAUDITED)
(In millions)
Three Months Ended December 31, 2007 Three Months Ended December 31, 2006
Items Impacting
Comparability Items Impacting Comparability
% Favorable
(Unfavorable) -
% Favorable
After After After
(Unfavorable) -
Considering Considering Considering
Asset Asset
Reported
Reported Items Reported Items
Impairments/ Impairments/ Foundation Items
(GAAP)
Restructuring Restructuring Donation
(GAAP) (Non-GAAP) (GAAP) (Non-GAAP) (Non-GAAP)
Africa $160 $1 $161 $137 $2 $139 17 16
Eurasia 50 1 51 36 36 39 42
European Union 527 21 548 480 2 482 10 14
Latin America 491 1 492 390 390 26 26
North America 402 10 412 419 419 (4) (2)
Pacific 393 2 395 374 42 416 5 (5)
Bottling Investments 22 4 26 (59) 27 (32) -- --
Corporate (519) 86 (433) (565) 1 $100 (464) 8 7
Consolidated $1,526 $126 $1,652 $1,212 $74 $100 $1,386 26 19
4. Page 4 of 4
The Company reports its financial results in accordance with U. S. generally accepted accounting principles (GAAP). However, management believes that certain non-GAAP
financial measures used in managing the business may provide users of this financial information additional meaningful comparisons between current results and results in prior
operating periods. Management believes that these non-GAAP financial measures can provide additional meaningful reflection of underlying trends of the business because they
provide a comparison of historical information that excludes certain items that impact the overall comparability. Management also uses these non-GAAP financial measures in
making financial, operating and planning decisions and in evaluating the Company's performance. See the Table below for supplemental financial data and corresponding
reconciliations to GAAP financial measures for the years ended December 31, 2007 and December 31, 2006. Non-GAAP financial measures should be viewed in addition to, and
not as an alternative for, the Company’s reported results prepared in accordance with GAAP.
THE COCA-COLA COMPANY AND SUBSIDIARIES
Reconciliation of GAAP to Non-GAAP Financial Measures
Operating Income (Loss) by Segment
(UNAUDITED)
(In millions)
Year Ended December 31, 2007 Year Ended December 31, 2006
Items Impacting
Comparability Items Impacting Comparability
% Favorable
(Unfavorable) -
% Favorable
After After After
(Unfavorable) -
Considering Considering Considering
Asset Asset
Reported
Reported Items Reported Items
Impairments/ Impairments/ Foundation Items
(GAAP)
Restructuring Restructuring Donation
(GAAP) (Non-GAAP) (GAAP) (Non-GAAP) (Non-GAAP)
Africa $450 $34 $484 $424 $3 $427 6 13
Eurasia 380 3 383 275 275 38 39
European Union 2,612 33 2,645 2,254 36 2,290 16 16
Latin America 1,749 4 1,753 1,438 1,438 22 22
North America 1,696 23 1,719 1,683 1,683 1 2
Pacific 1,699 3 1,702 1,650 62 1,712 3 (1)
Bottling Investments 153 47 200 18 87 105 750 90
Corporate (1,487) 121 (1,366) (1,434) 1 $100 (1,333) (4) (2)
Consolidated $7,252 $268 $7,520 $6,308 $189 $100 $6,597 15 14