SlideShare ist ein Scribd-Unternehmen logo
1 von 5
Downloaden Sie, um offline zu lesen
The Company reports its financial results in accordance with generally accepted accounting principles (GAAP). However, management believes that certain non-GAAP financial measures used in managing the business may provide users of this financial information
additional meaningful comparisons between current results and results in prior operating periods. Management believes that these non-GAAP financial measures can provide additional meaningful reflection of underlying trends of the business because they provide a
comparison of historical information that excludes certain items that impact the overall comparability. Management also uses these non-GAAP financial measures in making financial, operating and planning decisions and in evaluating the Company's performance. See the
Table below for supplemental financial data and corresponding reconciliations to GAAP financial measures for the three months ended December 31, 2005 and December 31, 2004. Non-GAAP financial measures should be viewed in addition to, and not as an alternative for,
the Company’s reported results prepared in accordance with GAAP.


                                                                                                                             THE COCA-COLA COMPANY AND SUBSIDIARIES
                                                                                                                           Reconciliation of GAAP to Non-GAAP Financial Measures
                                                                                                                                                       (UNAUDITED)
                                                                                                                                   (In millions except per share data and percentages)


                                                                                  Three Months Ended December 31, 2005                                                                                 Three Months Ended December 31, 2004
                                                                                        Items Impacting Comparability                                                                                       Items Impacting Comparability                                                              % Change -
                                                                                                                                                                                                                                                                                                          After
                                                                                                                                               After                                                                                                                       After
                                                                                                         Repatriation of                                                            Issuances of                                      Donation to                                        % Change -   Considering
                                                                                                                                           Considering                                                                                                                 Considering
                                                                           HFCS         Resolution of       Foreign         Equity                                                 Stock by Equity   Resolution of    Insurance       Coca-Cola        New Tax                            Reported       Items
                                                        Reported                                                                              Items              Reported                                                                                                 Items
                                                                         Settlement      Tax Matters       Earnings        Investee                                                   Investees       Tax Matters     Settlement      Foundation      Legislation                          (GAAP)     (Non-GAAP)
                                                         (GAAP)                                                                            (Non-GAAP)             (GAAP)                                                                                               (Non-GAAP)
Net Operating Revenues                                       $5,551                                                                               $5,551               $5,204                                                                                                $5,204           7           7
Cost of goods sold                                            1,996               $5                                                               2,001                 1,813                                                                                                1,813         10           10

Gross Profit                                                  3,555               (5)                                                              3,550                 3,391                                                                                                3,391           5           5
Selling, general and administrative expenses                  2,293                                                                                2,293                 2,044                                                $75             ($75)                           2,044         12           12
Operating Income                                              1,262               (5)                                                              1,257                 1,347                                                 (75)            75                             1,347          (6)          (7)
Interest income                                                     72                                                                                   72                 51                                                                                                      51      41           41
Interest expense                                                    61                                                                                   61                 58                                                                                                      58        5           5
Equity income - net                                             127                                                                $49               176                  125                                                                                                  125            2          41
Other loss - net                                                (27)                                                                                 (27)                  (18)                                                                                                 (18)          --           --
Issuances of stock by equity investees                          -                                                                                    -                     (25)               $25                                                                               -             --           --
Income Before Income Taxes                                    1,373               (5)                                                 49           1,417                 1,422                 25                              (75)            75                             1,447          (3)          (2)
Income taxes                                                    509               (2)             $10             ($188)              4              333                  221                  10             $48              (29)            29               $50            329         130            1
Net Income                                                     $864              ($3)            ($10)            $188             $45             $1,084              $1,201                 $15             ($48)          ($46)            $46             ($50)          $1,118         (28)          (3)

Diluted Net Income Per Share                                  $0.36            $0.00            $0.00             $0.08          $0.02             $0.46                 $0.50              $0.01           ($0.02)         ($0.02)          $0.02           ($0.02)          $0.46 *       (28)          0

Average Shares Outstanding - Diluted                          2,375            2,375            2,375             2,375          2,375             2,375                 2,415              2,415            2,415          2,415            2,415           2,415            2,415          (2)          (2)

Gross Margin                                                  64.0%                                                                                64.0%                 65.2%                                                                                                65.2%
Operating Margin                                              22.7%                                                                                22.6%                 25.9%                                                                                                25.9%
Effective Tax Rate                                            37.1%                                                                                23.5%                 15.5%                                                                                                22.7%

Note: Items to consider for comparability include primarily charges, gains, and accounting changes. Charges and accounting changes negatively impacting net income are reflected
as increases to reported net income. Gains positively impacting net income are reflected as deductions to reported net income.

*Per share amounts do not add across due to rounding.


                                                                                                                                                                       - more -
The Company reports its financial results in accordance with generally accepted accounting principles (GAAP). However, management believes that certain non-GAAP financial measures used in
managing the business may provide users of this financial information additional meaningful comparisons between current results and results in prior operating periods. Management believes that these
non-GAAP financial measures can provide additional meaningful reflection of underlying trends of the business because they provide a comparison of historical information that excludes certain items that
impact the overall comparability. Management also uses these non-GAAP financial measures in making financial, operating and planning decisions and in evaluating the Company's performance. See the
Table below for supplemental financial data and corresponding reconciliations to GAAP financial measures for the year ended December 31, 2005. Non-GAAP financial measures should be viewed in
addition to, and not as an alternative for, the Company’s reported results prepared in accordance with GAAP.


                                                                                          THE COCA-COLA COMPANY AND SUBSIDIARIES
                                                                                        Reconciliation of GAAP to Non-GAAP Financial Measures
                                                                                                                    (UNAUDITED)
                                                                                                 (In millions except per share data and percentages)


                                                                                                                Year Ended December 31, 2005
                                                                                                               Items Impacting Comparability

                                                                                                                                                                                                                           % Change -
                                                                                                                        Issuances of       Accelerated                                                                        After
                                                                                                                                                                                              After
                                                                                                        Repatriation       Stock by       Amortization of                                                    % Change -   Considering
                                                                                                                                                                                           Considering
                                                                         HFCS         Resolution of      of Foreign         Equity         Stock-Based       Equity        Asset Write-                       Reported       Items
                                                       Reported                                                                                                                               Items
                                                                       Settlement      Tax Matters        Earnings        Investees       Compensation      Investee         downs                             (GAAP)     (Non-GAAP)
                                                        (GAAP)                                                                                                                             (Non-GAAP)

Net Operating Revenues                                     $23,104                                                                                                                              $23,104         6            6

Cost of goods sold                                            8,195            $47                                                                                                                8,242         7            7

Gross Profit                                                 14,909            (47)                                                                                                              14,862         6            6
Selling, general and administrative expenses                  8,739                                                                                 ($50)                                         8,689        11            10
Other operating charges                                          85                                                                                                                ($85)            -           --           --
Operating Income*                                             6,085            (47)                                                                    50                            85           6,173         7            (0)
Interest income                                                 235                                                                                                                                235         50            50
Interest expense                                                240                                                                                                                                240         22            22
Equity income - net                                             680                                                                                                $33                4            717         10            23
Other loss - net                                                (93)                                                                                                                                (93)        --           --
Gains on issuances of stock by equity investees                  23                                                             ($23)                                                               -          (4)           --
Income Before Income Taxes                                    6,690            (47)                                                (23)                50           33               89           6,792         8            2
Income taxes                                                  1,818            (18)            $101            ($315)              ($8)                12              2              4           1,596        32            (2)
Net Income                                                   $4,872           ($29)           ($101)           $315             ($15)                $38           $31              $85          $5,196         1            4

Diluted Net Income Per Share                                  $2.04         ($0.01)           ($0.04)          $0.13          ($0.01)              $0.02          $0.01            $0.04          $2.17 **      2            5

Average Shares Outstanding - Diluted                          2,393          2,393            2,393            2,393           2,393               2,393          2,393            2,393          2,393        (1)           (1)

Gross Margin                                                  64.5%                                                                                                                               64.3%
Operating Margin                                              26.3%                                                                                                                               26.7%
Effective Tax Rate                                            27.2%                                                                                                                               23.5%

Note: Items to consider for comparability include primarily charges, gains, and accounting changes. Charges and accounting changes negatively impacting net income are reflected
as increases to reported net income. Gains positively impacting net income are reflected as deductions to reported net income.

*2005 reported operating income includes a currency benefit of approximately 4%. After items impacting comparability, the currency benefit is approximately 3%.

**Per share amounts may not add due to rounding.


                                                                                                                        - more -
The Company reports its financial results in accordance with generally accepted accounting principles (GAAP). However, management believes that certain non-GAAP financial measures used in
managing the business may provide users of this financial information additional meaningful comparisons between current results and results in prior operating periods. Management believes that these
non-GAAP financial measures can provide additional meaningful reflection of underlying trends of the business because they provide a comparison of historical information that excludes certain items that
impact the overall comparability. Management also uses these non-GAAP financial measures in making financial, operating and planning decisions and in evaluating the Company's performance. See
the Table below for supplemental financial data and corresponding reconciliations to GAAP financial measures for the year ended December 31, 2004. Non-GAAP financial measures should be viewed in
addition to, and not as an alternative for, the Company’s reported results prepared in accordance with GAAP.


                                                                                                                     THE COCA-COLA COMPANY AND SUBSIDIARIES
                                                                                                                   Reconciliation of GAAP to Non-GAAP Financial Measures
                                                                                                                                             (UNAUDITED)
                                                                                                                        (In millions except per share data and percentages)


                                                                                                                                   Year Ended December 31, 2004
                                                                                                                                    Items Impacting Comparability


                                                                                                     Gain on                                                                                                                   After
                                                                              Tax Settlement      Issuance of                                            German                            Donation to                     Considering
                                                                               at Coca-Cola     Stock by Equity     Asset Write-      Resolution of    Deferred Tax     Insurance          Coca-Cola        New Tax
                                                            Reported                                                                                                                                                          Items
                                                                                  FEMSA             Investee          downs            Tax Matters        Asset         Settlement         Foundation      Legislation
                                                             (GAAP)                                                                                                                                                        (Non-GAAP)


Net Operating Revenues                                           $21,742                                                                                                                                                        $21,742

Cost of goods sold                                                 7,674                                                                                                                                                          7,674

Gross Profit                                                      14,068                                                                                                                                                         14,068

Selling, general and administrative expenses                       7,890                                                                                                           $75             ($75)                          7,890
Other operating charges                                              480                                                    ($480)                                                                                                  -
Operating Income                                                   5,698                                                      480                                                   (75)            75                            6,178

Interest income                                                      157                                                                                                                                                           157
Interest expense                                                     196                                                                                                                                                           196
Equity income - net                                                  621                ($37)                                                                                                                                      584
Other loss - net                                                       (82)                                                                                                                                                         (82)
Gains on issuances of stock by equity investees                        24                                 ($24)                                                                                                                     -
Income Before Income Taxes                                         6,222                 (37)               (24)              480                                                   (75)            75                            6,641
Income taxes                                                       1,375                 (13)                (9)              171             $128              ($75)               (29)            29               50           1,627
Net Income                                                        $4,847                ($24)             ($15)             $309              ($128)            $75                ($46)           $46             ($50)         $5,014

Diluted Net Income Per Share                                       $2.00              ($0.01)            ($0.01)            $0.13            ($0.05)          $0.03           ($0.02)             $0.02          ($0.02)          $2.06 *

Average Shares Outstanding - Diluted                               2,429               2,429             2,429              2,429             2,429           2,429            2,429              2,429           2,429           2,429


Gross Margin                                                       64.7%                                                                                                                                                          64.7%
Operating Margin                                                   26.2%                                                                                                                                                          28.4%
Effective Tax Rate                                                 22.1%                                                                                                                                                          24.5%

Note: Items to consider for comparability include primarily charges, gains, and accounting changes. Charges and accounting changes negatively impacting net income are reflected
as increases to reported net income. Gains positively impacting net income are reflected as deductions to reported net income.

*Per share amounts may not add due to rounding.


                                                                                                                               - more -
The Company reports its financial results in accordance with generally accepted accounting principles (GAAP). However, management believes that certain non-GAAP financial measures used in
managing the business may provide users of this financial information additional meaningful comparisons between current results and results in prior operating periods. Management believes that
these non-GAAP financial measures can provide additional meaningful reflection of underlying trends of the business because they provide a comparison of historical information that excludes
certain items that impact the overall comparability. Management also uses these non-GAAP financial measures in making financial, operating and planning decisions and in evaluating the
Company's performance. See the Table below for supplemental financial data and corresponding reconciliations to GAAP financial measures for the three months ended December 31, 2005 and
December 31, 2004. Non-GAAP financial measures should be viewed in addition to, and not as an alternative for, the Company’s reported results prepared in accordance with GAAP.


                                                                     THE COCA-COLA COMPANY AND SUBSIDIARIES
                                                                 Reconciliation of GAAP to Non-GAAP Financial Measures
                                                                           Operating Income (Loss), by Segment
                                                                                       (UNAUDITED)
                                                                   (In millions except per share data and percentages)

                                           Three Months Ended December 31, 2005                          Three Months Ended December 31, 2004
                                                           Items
                                                         Impacting                                                    Items Impacting
                                                        Comparability                                                   Comparability
                                                                                                                                                                                 % Favorable
                                                                                                                                                                                (Unfavorable) -
                                                                                                                                                              % Favorable            After
                                                                             After                                                                After
                                                                                                                                Donation to                  (Unfavorable) -     Considering
                                                                         Considering                                                          Considering
                                                           HFCS                                                   Insurance     Coca-Cola                      Reported             Items
                                          Reported                          Items                 Reported                                       Items
                                                         Settlement                                              Settletment    Foundation                      (GAAP)           (Non-GAAP)
                                           (GAAP)                        (Non-GAAP)                (GAAP)                                     (Non-GAAP)

North America                                  $366                                $366                 $380                                        $380           (4)                (4)
Africa                                          135                                 135                  102                                         102           32                 32
East, South Asia and Pacific Rim                  35                                  35                  45                                           45          (22)              (22)
European Union                                  455                                 455                  475                                         475           (4)                (4)
Latin America                                   321                                 321                  288                                         288           11                 11
North Asia, Eurasia and Middle East             407                                 407                  346                                         346           18                 18
Corporate                                       (457)             ($5)              (462)                (289)          ($75)           $75          (289)         (58)              (60)
Consolidated                                 $1,262               ($5)           $1,257                $1,347           ($75)           $75       $1,347           (6)                (7)


                                                                                            - more -
The Company reports its financial results in accordance with generally accepted accounting principles (GAAP). However, management believes that certain non-GAAP financial measures used in managing the business may provide users of
this financial information additional meaningful comparisons between current results and results in prior operating periods. Management believes that these non-GAAP financial measures can provide additional meaningful reflection of underlying
trends of the business because they provide a comparison of historical information that excludes certain items that impact the overall comparability. Management also uses these non-GAAP financial measures in making financial, operating and
planning decisions and in evaluating the Company's performance. See the Table below for supplemental financial data and corresponding reconciliations to GAAP financial measures for the year ended December 31, 2005 and December 31,
2004. Non-GAAP financial measures should be viewed in addition to, and not as an alternative for, the Company’s reported results prepared in accordance with GAAP.


                                                                                             THE COCA-COLA COMPANY AND SUBSIDIARIES
                                                                                         Reconciliation of GAAP to Non-GAAP Financial Measures
                                                                                                    Operating Income (Loss), by Segment
                                                                                                                (UNAUDITED)
                                                                                           (In millions, except per share data and percentages )

                                                                 Year Ended December 31, 2005                                                       Year Ended December 31, 2004
                                                              Items Impacting Comparability                                                        Items Impacting Comparability
                                                                                                                                                                                                                                 % Favorable
                                                                                                                                                                                                                                (Unfavorable) -
                                                                         Accelerated                                                                                                                          % Favorable            After
                                                                                                             After                                                                              After
                                                                        Amortization of                                                                                     Donation to                      (Unfavorable) -     Considering
                                                                                                          Considering                                                                        Considering
                                                         HFCS            Stock-Based    Asset                                                    Asset    Insurance         Coca-Cola                          Reported             Items
                                         Reported                                                            Items              Reported                                                        Items
                                                       Settlement       Compensation Write-downs                                              Write-downs Settlement        Foundation                          (GAAP)           (Non-GAAP)
                                          (GAAP)                                                          (Non-GAAP)             (GAAP)                                                      (Non-GAAP)

North America                                $1,554                                $12                            $1,566            $1,606           $18                                          $1,624           (3)                (4)
Africa                                          415                                  3                               418               340                                                           340           22                 23
East, South Asia and Pacific Rim                201                                  3            $85                289               344             15                                            359           (42)               (19)
European Union                                2,247                                  3                             2,250             1,812            368                                           2,180          24                 3
Latin America                                 1,207                                  4                             1,211             1,069              6                                           1,075          13                 13
North Asia, Eurasia and Middle East           1,709                                  3                             1,712             1,629              9                                           1,638           5                 5
Corporate                                    (1,248)            ($47)               22                            (1,273)           (1,102)            64          ($75)               $75         (1,038)         (13)               (23)
Consolidated                                 $6,085             ($47)              $50            $85             $6,173            $5,698          $480           ($75)               $75        $6,178            7                 (0)

Weitere ähnliche Inhalte

Was ist angesagt?

coca cola Reconciliation of Q2 and YTD 2008 Non-GAAP Financial Measures
coca cola  	Reconciliation of Q2 and YTD 2008 Non-GAAP Financial Measurescoca cola  	Reconciliation of Q2 and YTD 2008 Non-GAAP Financial Measures
coca cola Reconciliation of Q2 and YTD 2008 Non-GAAP Financial Measuresfinance9
 
coca cola Reconciliation of Q3 and YTD 2007 Non-GAAP Financial Measures
coca cola Reconciliation of Q3 and YTD 2007 Non-GAAP Financial Measurescoca cola Reconciliation of Q3 and YTD 2007 Non-GAAP Financial Measures
coca cola Reconciliation of Q3 and YTD 2007 Non-GAAP Financial Measuresfinance9
 
coca cola Reconciliation of Q2 2003 Non-GAAP Financial Measures
coca cola Reconciliation of Q2 2003 Non-GAAP Financial Measurescoca cola Reconciliation of Q2 2003 Non-GAAP Financial Measures
coca cola Reconciliation of Q2 2003 Non-GAAP Financial Measuresfinance9
 
coca cola Apr 21, 2004 Reconciliation of Q1 2004 Non-GAAP Financial Measures
coca cola Apr 21, 2004	Reconciliation of Q1 2004 Non-GAAP Financial Measurescoca cola Apr 21, 2004	Reconciliation of Q1 2004 Non-GAAP Financial Measures
coca cola Apr 21, 2004 Reconciliation of Q1 2004 Non-GAAP Financial Measuresfinance9
 
delta air line 2007 4th
 delta air line 2007 4th delta air line 2007 4th
delta air line 2007 4thfinance13
 
coca cola Reconciliation of Q1 2003 Non-GAAP Financial Measures
coca cola Reconciliation of Q1 2003 Non-GAAP Financial Measurescoca cola Reconciliation of Q1 2003 Non-GAAP Financial Measures
coca cola Reconciliation of Q1 2003 Non-GAAP Financial Measuresfinance9
 
United Health GroupReconciliation of Non-GAAP Financial Measures
United Health GroupReconciliation of Non-GAAP Financial MeasuresUnited Health GroupReconciliation of Non-GAAP Financial Measures
United Health GroupReconciliation of Non-GAAP Financial Measuresfinance3
 
bnsf 1Q_2005_Investors_Report
bnsf 1Q_2005_Investors_Reportbnsf 1Q_2005_Investors_Report
bnsf 1Q_2005_Investors_Reportfinance16
 
coca cola Reconciliation of Q2 and YTD 2004 Non-GAAP Financial Measures
coca cola Reconciliation of Q2 and YTD 2004 Non-GAAP Financial Measurescoca cola Reconciliation of Q2 and YTD 2004 Non-GAAP Financial Measures
coca cola Reconciliation of Q2 and YTD 2004 Non-GAAP Financial Measuresfinance9
 
duke energy 1Q 07_RegG
duke energy 1Q 07_RegGduke energy 1Q 07_RegG
duke energy 1Q 07_RegGfinance21
 
coca cola Reconciliation of Q3 & YTD 2004 Segment Operating Income
coca cola Reconciliation of Q3 & YTD 2004 Segment Operating Incomecoca cola Reconciliation of Q3 & YTD 2004 Segment Operating Income
coca cola Reconciliation of Q3 & YTD 2004 Segment Operating Incomefinance9
 
energy future holindings Q408InvestorCallDeck_FINAL
energy future holindings  Q408InvestorCallDeck_FINALenergy future holindings  Q408InvestorCallDeck_FINAL
energy future holindings Q408InvestorCallDeck_FINALfinance29
 
duke energy 2Q 07_RegG
duke energy 2Q 07_RegGduke energy 2Q 07_RegG
duke energy 2Q 07_RegGfinance21
 
fmc technologies 2004ar
fmc technologies 2004arfmc technologies 2004ar
fmc technologies 2004arfinance50
 
alltel 1q 07recons
alltel  1q 07reconsalltel  1q 07recons
alltel 1q 07reconsfinance27
 
Duke Energy 02/01/06_RegG
Duke Energy 02/01/06_RegGDuke Energy 02/01/06_RegG
Duke Energy 02/01/06_RegGfinance21
 
United Health Group Reconciliation of Non-GAAP Financial Measures
United Health Group Reconciliation of Non-GAAP Financial MeasuresUnited Health Group Reconciliation of Non-GAAP Financial Measures
United Health Group Reconciliation of Non-GAAP Financial Measuresfinance3
 
EP1Q2007Earnings_FINAL(Web)
EP1Q2007Earnings_FINAL(Web)EP1Q2007Earnings_FINAL(Web)
EP1Q2007Earnings_FINAL(Web)finance49
 

Was ist angesagt? (18)

coca cola Reconciliation of Q2 and YTD 2008 Non-GAAP Financial Measures
coca cola  	Reconciliation of Q2 and YTD 2008 Non-GAAP Financial Measurescoca cola  	Reconciliation of Q2 and YTD 2008 Non-GAAP Financial Measures
coca cola Reconciliation of Q2 and YTD 2008 Non-GAAP Financial Measures
 
coca cola Reconciliation of Q3 and YTD 2007 Non-GAAP Financial Measures
coca cola Reconciliation of Q3 and YTD 2007 Non-GAAP Financial Measurescoca cola Reconciliation of Q3 and YTD 2007 Non-GAAP Financial Measures
coca cola Reconciliation of Q3 and YTD 2007 Non-GAAP Financial Measures
 
coca cola Reconciliation of Q2 2003 Non-GAAP Financial Measures
coca cola Reconciliation of Q2 2003 Non-GAAP Financial Measurescoca cola Reconciliation of Q2 2003 Non-GAAP Financial Measures
coca cola Reconciliation of Q2 2003 Non-GAAP Financial Measures
 
coca cola Apr 21, 2004 Reconciliation of Q1 2004 Non-GAAP Financial Measures
coca cola Apr 21, 2004	Reconciliation of Q1 2004 Non-GAAP Financial Measurescoca cola Apr 21, 2004	Reconciliation of Q1 2004 Non-GAAP Financial Measures
coca cola Apr 21, 2004 Reconciliation of Q1 2004 Non-GAAP Financial Measures
 
delta air line 2007 4th
 delta air line 2007 4th delta air line 2007 4th
delta air line 2007 4th
 
coca cola Reconciliation of Q1 2003 Non-GAAP Financial Measures
coca cola Reconciliation of Q1 2003 Non-GAAP Financial Measurescoca cola Reconciliation of Q1 2003 Non-GAAP Financial Measures
coca cola Reconciliation of Q1 2003 Non-GAAP Financial Measures
 
United Health GroupReconciliation of Non-GAAP Financial Measures
United Health GroupReconciliation of Non-GAAP Financial MeasuresUnited Health GroupReconciliation of Non-GAAP Financial Measures
United Health GroupReconciliation of Non-GAAP Financial Measures
 
bnsf 1Q_2005_Investors_Report
bnsf 1Q_2005_Investors_Reportbnsf 1Q_2005_Investors_Report
bnsf 1Q_2005_Investors_Report
 
coca cola Reconciliation of Q2 and YTD 2004 Non-GAAP Financial Measures
coca cola Reconciliation of Q2 and YTD 2004 Non-GAAP Financial Measurescoca cola Reconciliation of Q2 and YTD 2004 Non-GAAP Financial Measures
coca cola Reconciliation of Q2 and YTD 2004 Non-GAAP Financial Measures
 
duke energy 1Q 07_RegG
duke energy 1Q 07_RegGduke energy 1Q 07_RegG
duke energy 1Q 07_RegG
 
coca cola Reconciliation of Q3 & YTD 2004 Segment Operating Income
coca cola Reconciliation of Q3 & YTD 2004 Segment Operating Incomecoca cola Reconciliation of Q3 & YTD 2004 Segment Operating Income
coca cola Reconciliation of Q3 & YTD 2004 Segment Operating Income
 
energy future holindings Q408InvestorCallDeck_FINAL
energy future holindings  Q408InvestorCallDeck_FINALenergy future holindings  Q408InvestorCallDeck_FINAL
energy future holindings Q408InvestorCallDeck_FINAL
 
duke energy 2Q 07_RegG
duke energy 2Q 07_RegGduke energy 2Q 07_RegG
duke energy 2Q 07_RegG
 
fmc technologies 2004ar
fmc technologies 2004arfmc technologies 2004ar
fmc technologies 2004ar
 
alltel 1q 07recons
alltel  1q 07reconsalltel  1q 07recons
alltel 1q 07recons
 
Duke Energy 02/01/06_RegG
Duke Energy 02/01/06_RegGDuke Energy 02/01/06_RegG
Duke Energy 02/01/06_RegG
 
United Health Group Reconciliation of Non-GAAP Financial Measures
United Health Group Reconciliation of Non-GAAP Financial MeasuresUnited Health Group Reconciliation of Non-GAAP Financial Measures
United Health Group Reconciliation of Non-GAAP Financial Measures
 
EP1Q2007Earnings_FINAL(Web)
EP1Q2007Earnings_FINAL(Web)EP1Q2007Earnings_FINAL(Web)
EP1Q2007Earnings_FINAL(Web)
 

Andere mochten auch

시알리스 구입방법 카톡:DDF11 & DDF11.KR 정품구입,시알리스 정품파는곳,시알리스 정품구입처,시알리스 정품판매처,시알리스 정품구입방법,
시알리스 구입방법 카톡:DDF11 & DDF11.KR 정품구입,시알리스 정품파는곳,시알리스 정품구입처,시알리스 정품판매처,시알리스 정품구입방법,시알리스 구입방법 카톡:DDF11 & DDF11.KR 정품구입,시알리스 정품파는곳,시알리스 정품구입처,시알리스 정품판매처,시알리스 정품구입방법,
시알리스 구입방법 카톡:DDF11 & DDF11.KR 정품구입,시알리스 정품파는곳,시알리스 정품구입처,시알리스 정품판매처,시알리스 정품구입방법,bark man
 
MBA - Executive Interaction XVII - OSU
MBA - Executive Interaction XVII - OSUMBA - Executive Interaction XVII - OSU
MBA - Executive Interaction XVII - OSUHasib Rahman, MBA
 
Kristen oneil rayne gcc 2016
Kristen oneil rayne gcc 2016Kristen oneil rayne gcc 2016
Kristen oneil rayne gcc 2016GWT
 
The Big Picture for Local News
The Big Picture for Local NewsThe Big Picture for Local News
The Big Picture for Local NewsJesse Holcomb
 
CAN FORM FOR GET COMMUNITY CERTIFICATE
CAN FORM FOR GET COMMUNITY CERTIFICATECAN FORM FOR GET COMMUNITY CERTIFICATE
CAN FORM FOR GET COMMUNITY CERTIFICATEabubakkar_a
 
Juanita allen gcc 2016
Juanita allen gcc 2016Juanita allen gcc 2016
Juanita allen gcc 2016GWT
 
Who's Who Among Students
Who's Who Among StudentsWho's Who Among Students
Who's Who Among StudentsTony Bujana
 

Andere mochten auch (9)

시알리스 구입방법 카톡:DDF11 & DDF11.KR 정품구입,시알리스 정품파는곳,시알리스 정품구입처,시알리스 정품판매처,시알리스 정품구입방법,
시알리스 구입방법 카톡:DDF11 & DDF11.KR 정품구입,시알리스 정품파는곳,시알리스 정품구입처,시알리스 정품판매처,시알리스 정품구입방법,시알리스 구입방법 카톡:DDF11 & DDF11.KR 정품구입,시알리스 정품파는곳,시알리스 정품구입처,시알리스 정품판매처,시알리스 정품구입방법,
시알리스 구입방법 카톡:DDF11 & DDF11.KR 정품구입,시알리스 정품파는곳,시알리스 정품구입처,시알리스 정품판매처,시알리스 정품구입방법,
 
MBA - Executive Interaction XVII - OSU
MBA - Executive Interaction XVII - OSUMBA - Executive Interaction XVII - OSU
MBA - Executive Interaction XVII - OSU
 
Invert_Poster
Invert_PosterInvert_Poster
Invert_Poster
 
SALAM CV
SALAM  CVSALAM  CV
SALAM CV
 
Kristen oneil rayne gcc 2016
Kristen oneil rayne gcc 2016Kristen oneil rayne gcc 2016
Kristen oneil rayne gcc 2016
 
The Big Picture for Local News
The Big Picture for Local NewsThe Big Picture for Local News
The Big Picture for Local News
 
CAN FORM FOR GET COMMUNITY CERTIFICATE
CAN FORM FOR GET COMMUNITY CERTIFICATECAN FORM FOR GET COMMUNITY CERTIFICATE
CAN FORM FOR GET COMMUNITY CERTIFICATE
 
Juanita allen gcc 2016
Juanita allen gcc 2016Juanita allen gcc 2016
Juanita allen gcc 2016
 
Who's Who Among Students
Who's Who Among StudentsWho's Who Among Students
Who's Who Among Students
 

Ähnlich wie Coca-Cola Reports Non-GAAP Financial Results

coca cola Reconciliation of Q3 & YTD 2004 Non-GAAP Financial Measures
coca cola Reconciliation of Q3 & YTD 2004 Non-GAAP Financial Measurescoca cola Reconciliation of Q3 & YTD 2004 Non-GAAP Financial Measures
coca cola Reconciliation of Q3 & YTD 2004 Non-GAAP Financial Measuresfinance9
 
coca cola Reconciliation of YTD 2003 Non-GAAP Financial Measure
coca cola  	Reconciliation of YTD 2003 Non-GAAP Financial Measurecoca cola  	Reconciliation of YTD 2003 Non-GAAP Financial Measure
coca cola Reconciliation of YTD 2003 Non-GAAP Financial Measurefinance9
 
coca cola Reconciliation of Q3 and YTD 2005 Non-GAAP Financial Measures
coca cola Reconciliation of Q3 and YTD 2005 Non-GAAP Financial Measurescoca cola Reconciliation of Q3 and YTD 2005 Non-GAAP Financial Measures
coca cola Reconciliation of Q3 and YTD 2005 Non-GAAP Financial Measuresfinance9
 
coca cola Reconciliation of Q3 2003 Non-GAAP Financial Measures
coca cola Reconciliation of Q3 2003 Non-GAAP Financial Measurescoca cola Reconciliation of Q3 2003 Non-GAAP Financial Measures
coca cola Reconciliation of Q3 2003 Non-GAAP Financial Measuresfinance9
 
coca cola Reconciliation of Q1 2005 Non-GAAP Financial Measures
coca cola Reconciliation of Q1 2005 Non-GAAP Financial Measures coca cola Reconciliation of Q1 2005 Non-GAAP Financial Measures
coca cola Reconciliation of Q1 2005 Non-GAAP Financial Measures finance9
 
2011 Annual Sharholders’Meeting
2011 Annual Sharholders’Meeting2011 Annual Sharholders’Meeting
2011 Annual Sharholders’Meetingve-finance
 
unum group _10/17/05
unum group _10/17/05unum group _10/17/05
unum group _10/17/05finance26
 
unum group _10/17/05
unum group _10/17/05unum group _10/17/05
unum group _10/17/05finance26
 
coca cola Reconciliation of Q2 and YTD 2005 Non-GAAP Financial Measures
coca cola 	Reconciliation of Q2 and YTD 2005 Non-GAAP Financial Measures coca cola 	Reconciliation of Q2 and YTD 2005 Non-GAAP Financial Measures
coca cola Reconciliation of Q2 and YTD 2005 Non-GAAP Financial Measures finance9
 
fy04_q3_henkel
fy04_q3_henkelfy04_q3_henkel
fy04_q3_henkelfinance48
 
monsanto 11-10-05
monsanto 11-10-05monsanto 11-10-05
monsanto 11-10-05finance28
 
energy future holindings C5FAEDA1-AFD1-4F8B-8760-B53021EDDA04_Q408_Investor_C...
energy future holindings C5FAEDA1-AFD1-4F8B-8760-B53021EDDA04_Q408_Investor_C...energy future holindings C5FAEDA1-AFD1-4F8B-8760-B53021EDDA04_Q408_Investor_C...
energy future holindings C5FAEDA1-AFD1-4F8B-8760-B53021EDDA04_Q408_Investor_C...finance29
 
energy future holindings Q408InvestorCallDeck_FINAL
energy future holindings  Q408InvestorCallDeck_FINALenergy future holindings  Q408InvestorCallDeck_FINAL
energy future holindings Q408InvestorCallDeck_FINALfinance29
 
coca cola Reconciliation of Non-GAAP Financial Measures
coca cola Reconciliation of Non-GAAP Financial Measurescoca cola Reconciliation of Non-GAAP Financial Measures
coca cola Reconciliation of Non-GAAP Financial Measuresfinance9
 
unum group StatSupp_Q405
unum group StatSupp_Q405unum group StatSupp_Q405
unum group StatSupp_Q405finance26
 
autozone AZO_03AR
autozone  AZO_03ARautozone  AZO_03AR
autozone AZO_03ARfinance46
 

Ähnlich wie Coca-Cola Reports Non-GAAP Financial Results (18)

coca cola Reconciliation of Q3 & YTD 2004 Non-GAAP Financial Measures
coca cola Reconciliation of Q3 & YTD 2004 Non-GAAP Financial Measurescoca cola Reconciliation of Q3 & YTD 2004 Non-GAAP Financial Measures
coca cola Reconciliation of Q3 & YTD 2004 Non-GAAP Financial Measures
 
coca cola Reconciliation of YTD 2003 Non-GAAP Financial Measure
coca cola  	Reconciliation of YTD 2003 Non-GAAP Financial Measurecoca cola  	Reconciliation of YTD 2003 Non-GAAP Financial Measure
coca cola Reconciliation of YTD 2003 Non-GAAP Financial Measure
 
coca cola Reconciliation of Q3 and YTD 2005 Non-GAAP Financial Measures
coca cola Reconciliation of Q3 and YTD 2005 Non-GAAP Financial Measurescoca cola Reconciliation of Q3 and YTD 2005 Non-GAAP Financial Measures
coca cola Reconciliation of Q3 and YTD 2005 Non-GAAP Financial Measures
 
coca cola Reconciliation of Q3 2003 Non-GAAP Financial Measures
coca cola Reconciliation of Q3 2003 Non-GAAP Financial Measurescoca cola Reconciliation of Q3 2003 Non-GAAP Financial Measures
coca cola Reconciliation of Q3 2003 Non-GAAP Financial Measures
 
coca cola Reconciliation of Q1 2005 Non-GAAP Financial Measures
coca cola Reconciliation of Q1 2005 Non-GAAP Financial Measures coca cola Reconciliation of Q1 2005 Non-GAAP Financial Measures
coca cola Reconciliation of Q1 2005 Non-GAAP Financial Measures
 
2011 Annual Sharholders’Meeting
2011 Annual Sharholders’Meeting2011 Annual Sharholders’Meeting
2011 Annual Sharholders’Meeting
 
unum group _10/17/05
unum group _10/17/05unum group _10/17/05
unum group _10/17/05
 
unum group _10/17/05
unum group _10/17/05unum group _10/17/05
unum group _10/17/05
 
3Q 05_RegG
3Q 05_RegG3Q 05_RegG
3Q 05_RegG
 
coca cola Reconciliation of Q2 and YTD 2005 Non-GAAP Financial Measures
coca cola 	Reconciliation of Q2 and YTD 2005 Non-GAAP Financial Measures coca cola 	Reconciliation of Q2 and YTD 2005 Non-GAAP Financial Measures
coca cola Reconciliation of Q2 and YTD 2005 Non-GAAP Financial Measures
 
fy04_q3_henkel
fy04_q3_henkelfy04_q3_henkel
fy04_q3_henkel
 
monsanto 11-10-05
monsanto 11-10-05monsanto 11-10-05
monsanto 11-10-05
 
energy future holindings C5FAEDA1-AFD1-4F8B-8760-B53021EDDA04_Q408_Investor_C...
energy future holindings C5FAEDA1-AFD1-4F8B-8760-B53021EDDA04_Q408_Investor_C...energy future holindings C5FAEDA1-AFD1-4F8B-8760-B53021EDDA04_Q408_Investor_C...
energy future holindings C5FAEDA1-AFD1-4F8B-8760-B53021EDDA04_Q408_Investor_C...
 
energy future holindings C5FAEDA1-AFD1-4F8B-8760-B53021EDDA04_Q408_Investor_C...
energy future holindings C5FAEDA1-AFD1-4F8B-8760-B53021EDDA04_Q408_Investor_C...energy future holindings C5FAEDA1-AFD1-4F8B-8760-B53021EDDA04_Q408_Investor_C...
energy future holindings C5FAEDA1-AFD1-4F8B-8760-B53021EDDA04_Q408_Investor_C...
 
energy future holindings Q408InvestorCallDeck_FINAL
energy future holindings  Q408InvestorCallDeck_FINALenergy future holindings  Q408InvestorCallDeck_FINAL
energy future holindings Q408InvestorCallDeck_FINAL
 
coca cola Reconciliation of Non-GAAP Financial Measures
coca cola Reconciliation of Non-GAAP Financial Measurescoca cola Reconciliation of Non-GAAP Financial Measures
coca cola Reconciliation of Non-GAAP Financial Measures
 
unum group StatSupp_Q405
unum group StatSupp_Q405unum group StatSupp_Q405
unum group StatSupp_Q405
 
autozone AZO_03AR
autozone  AZO_03ARautozone  AZO_03AR
autozone AZO_03AR
 

Mehr von finance9

enterprise gp holdings Organizational and Ownership Structure Chart
enterprise gp holdings  Organizational and Ownership Structure Chart enterprise gp holdings  Organizational and Ownership Structure Chart
enterprise gp holdings Organizational and Ownership Structure Chart finance9
 
enterprise gp holdings Standards of Business Conduct
enterprise gp holdings Standards of Business Conductenterprise gp holdings Standards of Business Conduct
enterprise gp holdings Standards of Business Conductfinance9
 
enterprise gp holdings Governance Guidelines
enterprise gp holdings Governance Guidelinesenterprise gp holdings Governance Guidelines
enterprise gp holdings Governance Guidelinesfinance9
 
enterprise gp holdings Audit, Conflicts & Governance Committee
enterprise gp holdings Audit, Conflicts & Governance Committeeenterprise gp holdings Audit, Conflicts & Governance Committee
enterprise gp holdings Audit, Conflicts & Governance Committeefinance9
 
enterprise gp holdings Code of Conduct & Related Policies
enterprise gp holdings Code of Conduct & Related Policiesenterprise gp holdings Code of Conduct & Related Policies
enterprise gp holdings Code of Conduct & Related Policiesfinance9
 
02/11/09 HCA Announces Offering of $300 Million Senior Secured Second Lien Notes
02/11/09 HCA Announces Offering of $300 Million Senior Secured Second Lien Notes02/11/09 HCA Announces Offering of $300 Million Senior Secured Second Lien Notes
02/11/09 HCA Announces Offering of $300 Million Senior Secured Second Lien Notesfinance9
 
hca annual reports2000
hca annual reports2000hca annual reports2000
hca annual reports2000finance9
 
hca annual reports2001
hca annual reports2001hca annual reports2001
hca annual reports2001finance9
 
hca annual reports2002
hca annual reports2002hca annual reports2002
hca annual reports2002finance9
 
hca annual reports2003
hca annual reports2003hca annual reports2003
hca annual reports2003finance9
 
hca annual reports2004
hca annual reports2004hca annual reports2004
hca annual reports2004finance9
 
hca annual reports2005
hca annual reports2005hca annual reports2005
hca annual reports2005finance9
 
JP Morgan Presentation 15-Feb-2008
JP Morgan Presentation 15-Feb-2008JP Morgan Presentation 15-Feb-2008
JP Morgan Presentation 15-Feb-2008finance9
 
HCA Presents at Bank of America 2008 Credit Conference 20-Nov-2008
HCA Presents at Bank of America 2008 Credit Conference 20-Nov-2008HCA Presents at Bank of America 2008 Credit Conference 20-Nov-2008
HCA Presents at Bank of America 2008 Credit Conference 20-Nov-2008finance9
 
tyson foods 2007 Sustainability Report
tyson foods  2007 Sustainability Report tyson foods  2007 Sustainability Report
tyson foods 2007 Sustainability Report finance9
 
tyson foods Investor Fact Book
tyson foods Investor Fact Book tyson foods Investor Fact Book
tyson foods Investor Fact Book finance9
 
tyson foods 2008 Annual Report
tyson foods  2008 Annual Report tyson foods  2008 Annual Report
tyson foods 2008 Annual Report finance9
 
general dynamics 2008 Proxy Statement
general dynamics 2008 Proxy Statement	 general dynamics 2008 Proxy Statement
general dynamics 2008 Proxy Statement finance9
 
general dynamics 2007 Annual Report
general dynamics 2007 Annual Report	general dynamics 2007 Annual Report
general dynamics 2007 Annual Report finance9
 
general dynamics Restated Certificate of Incorporation
general dynamics Restated Certificate of Incorporation general dynamics Restated Certificate of Incorporation
general dynamics Restated Certificate of Incorporation finance9
 

Mehr von finance9 (20)

enterprise gp holdings Organizational and Ownership Structure Chart
enterprise gp holdings  Organizational and Ownership Structure Chart enterprise gp holdings  Organizational and Ownership Structure Chart
enterprise gp holdings Organizational and Ownership Structure Chart
 
enterprise gp holdings Standards of Business Conduct
enterprise gp holdings Standards of Business Conductenterprise gp holdings Standards of Business Conduct
enterprise gp holdings Standards of Business Conduct
 
enterprise gp holdings Governance Guidelines
enterprise gp holdings Governance Guidelinesenterprise gp holdings Governance Guidelines
enterprise gp holdings Governance Guidelines
 
enterprise gp holdings Audit, Conflicts & Governance Committee
enterprise gp holdings Audit, Conflicts & Governance Committeeenterprise gp holdings Audit, Conflicts & Governance Committee
enterprise gp holdings Audit, Conflicts & Governance Committee
 
enterprise gp holdings Code of Conduct & Related Policies
enterprise gp holdings Code of Conduct & Related Policiesenterprise gp holdings Code of Conduct & Related Policies
enterprise gp holdings Code of Conduct & Related Policies
 
02/11/09 HCA Announces Offering of $300 Million Senior Secured Second Lien Notes
02/11/09 HCA Announces Offering of $300 Million Senior Secured Second Lien Notes02/11/09 HCA Announces Offering of $300 Million Senior Secured Second Lien Notes
02/11/09 HCA Announces Offering of $300 Million Senior Secured Second Lien Notes
 
hca annual reports2000
hca annual reports2000hca annual reports2000
hca annual reports2000
 
hca annual reports2001
hca annual reports2001hca annual reports2001
hca annual reports2001
 
hca annual reports2002
hca annual reports2002hca annual reports2002
hca annual reports2002
 
hca annual reports2003
hca annual reports2003hca annual reports2003
hca annual reports2003
 
hca annual reports2004
hca annual reports2004hca annual reports2004
hca annual reports2004
 
hca annual reports2005
hca annual reports2005hca annual reports2005
hca annual reports2005
 
JP Morgan Presentation 15-Feb-2008
JP Morgan Presentation 15-Feb-2008JP Morgan Presentation 15-Feb-2008
JP Morgan Presentation 15-Feb-2008
 
HCA Presents at Bank of America 2008 Credit Conference 20-Nov-2008
HCA Presents at Bank of America 2008 Credit Conference 20-Nov-2008HCA Presents at Bank of America 2008 Credit Conference 20-Nov-2008
HCA Presents at Bank of America 2008 Credit Conference 20-Nov-2008
 
tyson foods 2007 Sustainability Report
tyson foods  2007 Sustainability Report tyson foods  2007 Sustainability Report
tyson foods 2007 Sustainability Report
 
tyson foods Investor Fact Book
tyson foods Investor Fact Book tyson foods Investor Fact Book
tyson foods Investor Fact Book
 
tyson foods 2008 Annual Report
tyson foods  2008 Annual Report tyson foods  2008 Annual Report
tyson foods 2008 Annual Report
 
general dynamics 2008 Proxy Statement
general dynamics 2008 Proxy Statement	 general dynamics 2008 Proxy Statement
general dynamics 2008 Proxy Statement
 
general dynamics 2007 Annual Report
general dynamics 2007 Annual Report	general dynamics 2007 Annual Report
general dynamics 2007 Annual Report
 
general dynamics Restated Certificate of Incorporation
general dynamics Restated Certificate of Incorporation general dynamics Restated Certificate of Incorporation
general dynamics Restated Certificate of Incorporation
 

Kürzlich hochgeladen

Money Forward Integrated Report “Forward Map” 2024
Money Forward Integrated Report “Forward Map” 2024Money Forward Integrated Report “Forward Map” 2024
Money Forward Integrated Report “Forward Map” 2024Money Forward
 
Uae-NO1 Black Magic Specialist In Lahore Black magic In Pakistan Kala Ilam Ex...
Uae-NO1 Black Magic Specialist In Lahore Black magic In Pakistan Kala Ilam Ex...Uae-NO1 Black Magic Specialist In Lahore Black magic In Pakistan Kala Ilam Ex...
Uae-NO1 Black Magic Specialist In Lahore Black magic In Pakistan Kala Ilam Ex...Amil baba
 
Uae-NO1 Pakistani Amil Baba Real Amil baba In Pakistan Najoomi Baba in Pakist...
Uae-NO1 Pakistani Amil Baba Real Amil baba In Pakistan Najoomi Baba in Pakist...Uae-NO1 Pakistani Amil Baba Real Amil baba In Pakistan Najoomi Baba in Pakist...
Uae-NO1 Pakistani Amil Baba Real Amil baba In Pakistan Najoomi Baba in Pakist...Amil baba
 
Unit 4.1 financial markets operations .pdf
Unit 4.1 financial markets operations .pdfUnit 4.1 financial markets operations .pdf
Unit 4.1 financial markets operations .pdfSatyamSinghParihar2
 
NO1 Certified Amil Baba In Lahore Kala Jadu In Lahore Best Amil In Lahore Ami...
NO1 Certified Amil Baba In Lahore Kala Jadu In Lahore Best Amil In Lahore Ami...NO1 Certified Amil Baba In Lahore Kala Jadu In Lahore Best Amil In Lahore Ami...
NO1 Certified Amil Baba In Lahore Kala Jadu In Lahore Best Amil In Lahore Ami...Amil baba
 
PMFBY , Pradhan Mantri Fasal bima yojna
PMFBY , Pradhan Mantri  Fasal bima yojnaPMFBY , Pradhan Mantri  Fasal bima yojna
PMFBY , Pradhan Mantri Fasal bima yojnaDharmendra Kumar
 
Introduction to Health Economics Dr. R. Kurinji Malar.pptx
Introduction to Health Economics Dr. R. Kurinji Malar.pptxIntroduction to Health Economics Dr. R. Kurinji Malar.pptx
Introduction to Health Economics Dr. R. Kurinji Malar.pptxDrRkurinjiMalarkurin
 
Economic Risk Factor Update: April 2024 [SlideShare]
Economic Risk Factor Update: April 2024 [SlideShare]Economic Risk Factor Update: April 2024 [SlideShare]
Economic Risk Factor Update: April 2024 [SlideShare]Commonwealth
 
The AES Investment Code - the go-to counsel for the most well-informed, wise...
The AES Investment Code -  the go-to counsel for the most well-informed, wise...The AES Investment Code -  the go-to counsel for the most well-informed, wise...
The AES Investment Code - the go-to counsel for the most well-informed, wise...AES International
 
Uae-NO1 Kala Jadu specialist Expert in Pakistan kala ilam specialist Expert i...
Uae-NO1 Kala Jadu specialist Expert in Pakistan kala ilam specialist Expert i...Uae-NO1 Kala Jadu specialist Expert in Pakistan kala ilam specialist Expert i...
Uae-NO1 Kala Jadu specialist Expert in Pakistan kala ilam specialist Expert i...Amil baba
 
Liquidity Decisions in Financial management
Liquidity Decisions in Financial managementLiquidity Decisions in Financial management
Liquidity Decisions in Financial managementshrutisingh143670
 
INTERNATIONAL TRADE INSTITUTIONS[6].pptx
INTERNATIONAL TRADE INSTITUTIONS[6].pptxINTERNATIONAL TRADE INSTITUTIONS[6].pptx
INTERNATIONAL TRADE INSTITUTIONS[6].pptxaymenkhalfallah23
 
Unveiling Business Expansion Trends in 2024
Unveiling Business Expansion Trends in 2024Unveiling Business Expansion Trends in 2024
Unveiling Business Expansion Trends in 2024Champak Jhagmag
 
Stock Market Brief Deck FOR 4/17 video.pdf
Stock Market Brief Deck FOR 4/17 video.pdfStock Market Brief Deck FOR 4/17 video.pdf
Stock Market Brief Deck FOR 4/17 video.pdfMichael Silva
 
Uae-NO1 Rohani Amil In Islamabad Amil Baba in Rawalpindi Kala Jadu Amil In Ra...
Uae-NO1 Rohani Amil In Islamabad Amil Baba in Rawalpindi Kala Jadu Amil In Ra...Uae-NO1 Rohani Amil In Islamabad Amil Baba in Rawalpindi Kala Jadu Amil In Ra...
Uae-NO1 Rohani Amil In Islamabad Amil Baba in Rawalpindi Kala Jadu Amil In Ra...Amil baba
 
Overview of Inkel Unlisted Shares Price.
Overview of Inkel Unlisted Shares Price.Overview of Inkel Unlisted Shares Price.
Overview of Inkel Unlisted Shares Price.Precize Formely Leadoff
 
Amil Baba In Pakistan amil baba in Lahore amil baba in Islamabad amil baba in...
Amil Baba In Pakistan amil baba in Lahore amil baba in Islamabad amil baba in...Amil Baba In Pakistan amil baba in Lahore amil baba in Islamabad amil baba in...
Amil Baba In Pakistan amil baba in Lahore amil baba in Islamabad amil baba in...amilabibi1
 
2024 Q1 Crypto Industry Report | CoinGecko
2024 Q1 Crypto Industry Report | CoinGecko2024 Q1 Crypto Industry Report | CoinGecko
2024 Q1 Crypto Industry Report | CoinGeckoCoinGecko
 
NO1 Certified Black Magic Removal in Uk kala jadu Specialist kala jadu for Lo...
NO1 Certified Black Magic Removal in Uk kala jadu Specialist kala jadu for Lo...NO1 Certified Black Magic Removal in Uk kala jadu Specialist kala jadu for Lo...
NO1 Certified Black Magic Removal in Uk kala jadu Specialist kala jadu for Lo...Amil baba
 
NO1 Certified Black Magic Specialist Expert In Bahawalpur, Sargodha, Sialkot,...
NO1 Certified Black Magic Specialist Expert In Bahawalpur, Sargodha, Sialkot,...NO1 Certified Black Magic Specialist Expert In Bahawalpur, Sargodha, Sialkot,...
NO1 Certified Black Magic Specialist Expert In Bahawalpur, Sargodha, Sialkot,...Amil baba
 

Kürzlich hochgeladen (20)

Money Forward Integrated Report “Forward Map” 2024
Money Forward Integrated Report “Forward Map” 2024Money Forward Integrated Report “Forward Map” 2024
Money Forward Integrated Report “Forward Map” 2024
 
Uae-NO1 Black Magic Specialist In Lahore Black magic In Pakistan Kala Ilam Ex...
Uae-NO1 Black Magic Specialist In Lahore Black magic In Pakistan Kala Ilam Ex...Uae-NO1 Black Magic Specialist In Lahore Black magic In Pakistan Kala Ilam Ex...
Uae-NO1 Black Magic Specialist In Lahore Black magic In Pakistan Kala Ilam Ex...
 
Uae-NO1 Pakistani Amil Baba Real Amil baba In Pakistan Najoomi Baba in Pakist...
Uae-NO1 Pakistani Amil Baba Real Amil baba In Pakistan Najoomi Baba in Pakist...Uae-NO1 Pakistani Amil Baba Real Amil baba In Pakistan Najoomi Baba in Pakist...
Uae-NO1 Pakistani Amil Baba Real Amil baba In Pakistan Najoomi Baba in Pakist...
 
Unit 4.1 financial markets operations .pdf
Unit 4.1 financial markets operations .pdfUnit 4.1 financial markets operations .pdf
Unit 4.1 financial markets operations .pdf
 
NO1 Certified Amil Baba In Lahore Kala Jadu In Lahore Best Amil In Lahore Ami...
NO1 Certified Amil Baba In Lahore Kala Jadu In Lahore Best Amil In Lahore Ami...NO1 Certified Amil Baba In Lahore Kala Jadu In Lahore Best Amil In Lahore Ami...
NO1 Certified Amil Baba In Lahore Kala Jadu In Lahore Best Amil In Lahore Ami...
 
PMFBY , Pradhan Mantri Fasal bima yojna
PMFBY , Pradhan Mantri  Fasal bima yojnaPMFBY , Pradhan Mantri  Fasal bima yojna
PMFBY , Pradhan Mantri Fasal bima yojna
 
Introduction to Health Economics Dr. R. Kurinji Malar.pptx
Introduction to Health Economics Dr. R. Kurinji Malar.pptxIntroduction to Health Economics Dr. R. Kurinji Malar.pptx
Introduction to Health Economics Dr. R. Kurinji Malar.pptx
 
Economic Risk Factor Update: April 2024 [SlideShare]
Economic Risk Factor Update: April 2024 [SlideShare]Economic Risk Factor Update: April 2024 [SlideShare]
Economic Risk Factor Update: April 2024 [SlideShare]
 
The AES Investment Code - the go-to counsel for the most well-informed, wise...
The AES Investment Code -  the go-to counsel for the most well-informed, wise...The AES Investment Code -  the go-to counsel for the most well-informed, wise...
The AES Investment Code - the go-to counsel for the most well-informed, wise...
 
Uae-NO1 Kala Jadu specialist Expert in Pakistan kala ilam specialist Expert i...
Uae-NO1 Kala Jadu specialist Expert in Pakistan kala ilam specialist Expert i...Uae-NO1 Kala Jadu specialist Expert in Pakistan kala ilam specialist Expert i...
Uae-NO1 Kala Jadu specialist Expert in Pakistan kala ilam specialist Expert i...
 
Liquidity Decisions in Financial management
Liquidity Decisions in Financial managementLiquidity Decisions in Financial management
Liquidity Decisions in Financial management
 
INTERNATIONAL TRADE INSTITUTIONS[6].pptx
INTERNATIONAL TRADE INSTITUTIONS[6].pptxINTERNATIONAL TRADE INSTITUTIONS[6].pptx
INTERNATIONAL TRADE INSTITUTIONS[6].pptx
 
Unveiling Business Expansion Trends in 2024
Unveiling Business Expansion Trends in 2024Unveiling Business Expansion Trends in 2024
Unveiling Business Expansion Trends in 2024
 
Stock Market Brief Deck FOR 4/17 video.pdf
Stock Market Brief Deck FOR 4/17 video.pdfStock Market Brief Deck FOR 4/17 video.pdf
Stock Market Brief Deck FOR 4/17 video.pdf
 
Uae-NO1 Rohani Amil In Islamabad Amil Baba in Rawalpindi Kala Jadu Amil In Ra...
Uae-NO1 Rohani Amil In Islamabad Amil Baba in Rawalpindi Kala Jadu Amil In Ra...Uae-NO1 Rohani Amil In Islamabad Amil Baba in Rawalpindi Kala Jadu Amil In Ra...
Uae-NO1 Rohani Amil In Islamabad Amil Baba in Rawalpindi Kala Jadu Amil In Ra...
 
Overview of Inkel Unlisted Shares Price.
Overview of Inkel Unlisted Shares Price.Overview of Inkel Unlisted Shares Price.
Overview of Inkel Unlisted Shares Price.
 
Amil Baba In Pakistan amil baba in Lahore amil baba in Islamabad amil baba in...
Amil Baba In Pakistan amil baba in Lahore amil baba in Islamabad amil baba in...Amil Baba In Pakistan amil baba in Lahore amil baba in Islamabad amil baba in...
Amil Baba In Pakistan amil baba in Lahore amil baba in Islamabad amil baba in...
 
2024 Q1 Crypto Industry Report | CoinGecko
2024 Q1 Crypto Industry Report | CoinGecko2024 Q1 Crypto Industry Report | CoinGecko
2024 Q1 Crypto Industry Report | CoinGecko
 
NO1 Certified Black Magic Removal in Uk kala jadu Specialist kala jadu for Lo...
NO1 Certified Black Magic Removal in Uk kala jadu Specialist kala jadu for Lo...NO1 Certified Black Magic Removal in Uk kala jadu Specialist kala jadu for Lo...
NO1 Certified Black Magic Removal in Uk kala jadu Specialist kala jadu for Lo...
 
NO1 Certified Black Magic Specialist Expert In Bahawalpur, Sargodha, Sialkot,...
NO1 Certified Black Magic Specialist Expert In Bahawalpur, Sargodha, Sialkot,...NO1 Certified Black Magic Specialist Expert In Bahawalpur, Sargodha, Sialkot,...
NO1 Certified Black Magic Specialist Expert In Bahawalpur, Sargodha, Sialkot,...
 

Coca-Cola Reports Non-GAAP Financial Results

  • 1. The Company reports its financial results in accordance with generally accepted accounting principles (GAAP). However, management believes that certain non-GAAP financial measures used in managing the business may provide users of this financial information additional meaningful comparisons between current results and results in prior operating periods. Management believes that these non-GAAP financial measures can provide additional meaningful reflection of underlying trends of the business because they provide a comparison of historical information that excludes certain items that impact the overall comparability. Management also uses these non-GAAP financial measures in making financial, operating and planning decisions and in evaluating the Company's performance. See the Table below for supplemental financial data and corresponding reconciliations to GAAP financial measures for the three months ended December 31, 2005 and December 31, 2004. Non-GAAP financial measures should be viewed in addition to, and not as an alternative for, the Company’s reported results prepared in accordance with GAAP. THE COCA-COLA COMPANY AND SUBSIDIARIES Reconciliation of GAAP to Non-GAAP Financial Measures (UNAUDITED) (In millions except per share data and percentages) Three Months Ended December 31, 2005 Three Months Ended December 31, 2004 Items Impacting Comparability Items Impacting Comparability % Change - After After After Repatriation of Issuances of Donation to % Change - Considering Considering Considering HFCS Resolution of Foreign Equity Stock by Equity Resolution of Insurance Coca-Cola New Tax Reported Items Reported Items Reported Items Settlement Tax Matters Earnings Investee Investees Tax Matters Settlement Foundation Legislation (GAAP) (Non-GAAP) (GAAP) (Non-GAAP) (GAAP) (Non-GAAP) Net Operating Revenues $5,551 $5,551 $5,204 $5,204 7 7 Cost of goods sold 1,996 $5 2,001 1,813 1,813 10 10 Gross Profit 3,555 (5) 3,550 3,391 3,391 5 5 Selling, general and administrative expenses 2,293 2,293 2,044 $75 ($75) 2,044 12 12 Operating Income 1,262 (5) 1,257 1,347 (75) 75 1,347 (6) (7) Interest income 72 72 51 51 41 41 Interest expense 61 61 58 58 5 5 Equity income - net 127 $49 176 125 125 2 41 Other loss - net (27) (27) (18) (18) -- -- Issuances of stock by equity investees - - (25) $25 - -- -- Income Before Income Taxes 1,373 (5) 49 1,417 1,422 25 (75) 75 1,447 (3) (2) Income taxes 509 (2) $10 ($188) 4 333 221 10 $48 (29) 29 $50 329 130 1 Net Income $864 ($3) ($10) $188 $45 $1,084 $1,201 $15 ($48) ($46) $46 ($50) $1,118 (28) (3) Diluted Net Income Per Share $0.36 $0.00 $0.00 $0.08 $0.02 $0.46 $0.50 $0.01 ($0.02) ($0.02) $0.02 ($0.02) $0.46 * (28) 0 Average Shares Outstanding - Diluted 2,375 2,375 2,375 2,375 2,375 2,375 2,415 2,415 2,415 2,415 2,415 2,415 2,415 (2) (2) Gross Margin 64.0% 64.0% 65.2% 65.2% Operating Margin 22.7% 22.6% 25.9% 25.9% Effective Tax Rate 37.1% 23.5% 15.5% 22.7% Note: Items to consider for comparability include primarily charges, gains, and accounting changes. Charges and accounting changes negatively impacting net income are reflected as increases to reported net income. Gains positively impacting net income are reflected as deductions to reported net income. *Per share amounts do not add across due to rounding. - more -
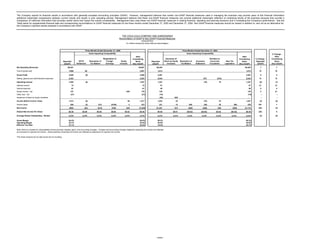
  • 2. The Company reports its financial results in accordance with generally accepted accounting principles (GAAP). However, management believes that certain non-GAAP financial measures used in managing the business may provide users of this financial information additional meaningful comparisons between current results and results in prior operating periods. Management believes that these non-GAAP financial measures can provide additional meaningful reflection of underlying trends of the business because they provide a comparison of historical information that excludes certain items that impact the overall comparability. Management also uses these non-GAAP financial measures in making financial, operating and planning decisions and in evaluating the Company's performance. See the Table below for supplemental financial data and corresponding reconciliations to GAAP financial measures for the year ended December 31, 2005. Non-GAAP financial measures should be viewed in addition to, and not as an alternative for, the Company’s reported results prepared in accordance with GAAP. THE COCA-COLA COMPANY AND SUBSIDIARIES Reconciliation of GAAP to Non-GAAP Financial Measures (UNAUDITED) (In millions except per share data and percentages) Year Ended December 31, 2005 Items Impacting Comparability % Change - Issuances of Accelerated After After Repatriation Stock by Amortization of % Change - Considering Considering HFCS Resolution of of Foreign Equity Stock-Based Equity Asset Write- Reported Items Reported Items Settlement Tax Matters Earnings Investees Compensation Investee downs (GAAP) (Non-GAAP) (GAAP) (Non-GAAP) Net Operating Revenues $23,104 $23,104 6 6 Cost of goods sold 8,195 $47 8,242 7 7 Gross Profit 14,909 (47) 14,862 6 6 Selling, general and administrative expenses 8,739 ($50) 8,689 11 10 Other operating charges 85 ($85) - -- -- Operating Income* 6,085 (47) 50 85 6,173 7 (0) Interest income 235 235 50 50 Interest expense 240 240 22 22 Equity income - net 680 $33 4 717 10 23 Other loss - net (93) (93) -- -- Gains on issuances of stock by equity investees 23 ($23) - (4) -- Income Before Income Taxes 6,690 (47) (23) 50 33 89 6,792 8 2 Income taxes 1,818 (18) $101 ($315) ($8) 12 2 4 1,596 32 (2) Net Income $4,872 ($29) ($101) $315 ($15) $38 $31 $85 $5,196 1 4 Diluted Net Income Per Share $2.04 ($0.01) ($0.04) $0.13 ($0.01) $0.02 $0.01 $0.04 $2.17 ** 2 5 Average Shares Outstanding - Diluted 2,393 2,393 2,393 2,393 2,393 2,393 2,393 2,393 2,393 (1) (1) Gross Margin 64.5% 64.3% Operating Margin 26.3% 26.7% Effective Tax Rate 27.2% 23.5% Note: Items to consider for comparability include primarily charges, gains, and accounting changes. Charges and accounting changes negatively impacting net income are reflected as increases to reported net income. Gains positively impacting net income are reflected as deductions to reported net income. *2005 reported operating income includes a currency benefit of approximately 4%. After items impacting comparability, the currency benefit is approximately 3%. **Per share amounts may not add due to rounding. - more -
  • 3. The Company reports its financial results in accordance with generally accepted accounting principles (GAAP). However, management believes that certain non-GAAP financial measures used in managing the business may provide users of this financial information additional meaningful comparisons between current results and results in prior operating periods. Management believes that these non-GAAP financial measures can provide additional meaningful reflection of underlying trends of the business because they provide a comparison of historical information that excludes certain items that impact the overall comparability. Management also uses these non-GAAP financial measures in making financial, operating and planning decisions and in evaluating the Company's performance. See the Table below for supplemental financial data and corresponding reconciliations to GAAP financial measures for the year ended December 31, 2004. Non-GAAP financial measures should be viewed in addition to, and not as an alternative for, the Company’s reported results prepared in accordance with GAAP. THE COCA-COLA COMPANY AND SUBSIDIARIES Reconciliation of GAAP to Non-GAAP Financial Measures (UNAUDITED) (In millions except per share data and percentages) Year Ended December 31, 2004 Items Impacting Comparability Gain on After Tax Settlement Issuance of German Donation to Considering at Coca-Cola Stock by Equity Asset Write- Resolution of Deferred Tax Insurance Coca-Cola New Tax Reported Items FEMSA Investee downs Tax Matters Asset Settlement Foundation Legislation (GAAP) (Non-GAAP) Net Operating Revenues $21,742 $21,742 Cost of goods sold 7,674 7,674 Gross Profit 14,068 14,068 Selling, general and administrative expenses 7,890 $75 ($75) 7,890 Other operating charges 480 ($480) - Operating Income 5,698 480 (75) 75 6,178 Interest income 157 157 Interest expense 196 196 Equity income - net 621 ($37) 584 Other loss - net (82) (82) Gains on issuances of stock by equity investees 24 ($24) - Income Before Income Taxes 6,222 (37) (24) 480 (75) 75 6,641 Income taxes 1,375 (13) (9) 171 $128 ($75) (29) 29 50 1,627 Net Income $4,847 ($24) ($15) $309 ($128) $75 ($46) $46 ($50) $5,014 Diluted Net Income Per Share $2.00 ($0.01) ($0.01) $0.13 ($0.05) $0.03 ($0.02) $0.02 ($0.02) $2.06 * Average Shares Outstanding - Diluted 2,429 2,429 2,429 2,429 2,429 2,429 2,429 2,429 2,429 2,429 Gross Margin 64.7% 64.7% Operating Margin 26.2% 28.4% Effective Tax Rate 22.1% 24.5% Note: Items to consider for comparability include primarily charges, gains, and accounting changes. Charges and accounting changes negatively impacting net income are reflected as increases to reported net income. Gains positively impacting net income are reflected as deductions to reported net income. *Per share amounts may not add due to rounding. - more -
  • 4. The Company reports its financial results in accordance with generally accepted accounting principles (GAAP). However, management believes that certain non-GAAP financial measures used in managing the business may provide users of this financial information additional meaningful comparisons between current results and results in prior operating periods. Management believes that these non-GAAP financial measures can provide additional meaningful reflection of underlying trends of the business because they provide a comparison of historical information that excludes certain items that impact the overall comparability. Management also uses these non-GAAP financial measures in making financial, operating and planning decisions and in evaluating the Company's performance. See the Table below for supplemental financial data and corresponding reconciliations to GAAP financial measures for the three months ended December 31, 2005 and December 31, 2004. Non-GAAP financial measures should be viewed in addition to, and not as an alternative for, the Company’s reported results prepared in accordance with GAAP. THE COCA-COLA COMPANY AND SUBSIDIARIES Reconciliation of GAAP to Non-GAAP Financial Measures Operating Income (Loss), by Segment (UNAUDITED) (In millions except per share data and percentages) Three Months Ended December 31, 2005 Three Months Ended December 31, 2004 Items Impacting Items Impacting Comparability Comparability % Favorable (Unfavorable) - % Favorable After After After Donation to (Unfavorable) - Considering Considering Considering HFCS Insurance Coca-Cola Reported Items Reported Items Reported Items Settlement Settletment Foundation (GAAP) (Non-GAAP) (GAAP) (Non-GAAP) (GAAP) (Non-GAAP) North America $366 $366 $380 $380 (4) (4) Africa 135 135 102 102 32 32 East, South Asia and Pacific Rim 35 35 45 45 (22) (22) European Union 455 455 475 475 (4) (4) Latin America 321 321 288 288 11 11 North Asia, Eurasia and Middle East 407 407 346 346 18 18 Corporate (457) ($5) (462) (289) ($75) $75 (289) (58) (60) Consolidated $1,262 ($5) $1,257 $1,347 ($75) $75 $1,347 (6) (7) - more -
  • 5. The Company reports its financial results in accordance with generally accepted accounting principles (GAAP). However, management believes that certain non-GAAP financial measures used in managing the business may provide users of this financial information additional meaningful comparisons between current results and results in prior operating periods. Management believes that these non-GAAP financial measures can provide additional meaningful reflection of underlying trends of the business because they provide a comparison of historical information that excludes certain items that impact the overall comparability. Management also uses these non-GAAP financial measures in making financial, operating and planning decisions and in evaluating the Company's performance. See the Table below for supplemental financial data and corresponding reconciliations to GAAP financial measures for the year ended December 31, 2005 and December 31, 2004. Non-GAAP financial measures should be viewed in addition to, and not as an alternative for, the Company’s reported results prepared in accordance with GAAP. THE COCA-COLA COMPANY AND SUBSIDIARIES Reconciliation of GAAP to Non-GAAP Financial Measures Operating Income (Loss), by Segment (UNAUDITED) (In millions, except per share data and percentages ) Year Ended December 31, 2005 Year Ended December 31, 2004 Items Impacting Comparability Items Impacting Comparability % Favorable (Unfavorable) - Accelerated % Favorable After After After Amortization of Donation to (Unfavorable) - Considering Considering Considering HFCS Stock-Based Asset Asset Insurance Coca-Cola Reported Items Reported Items Reported Items Settlement Compensation Write-downs Write-downs Settlement Foundation (GAAP) (Non-GAAP) (GAAP) (Non-GAAP) (GAAP) (Non-GAAP) North America $1,554 $12 $1,566 $1,606 $18 $1,624 (3) (4) Africa 415 3 418 340 340 22 23 East, South Asia and Pacific Rim 201 3 $85 289 344 15 359 (42) (19) European Union 2,247 3 2,250 1,812 368 2,180 24 3 Latin America 1,207 4 1,211 1,069 6 1,075 13 13 North Asia, Eurasia and Middle East 1,709 3 1,712 1,629 9 1,638 5 5 Corporate (1,248) ($47) 22 (1,273) (1,102) 64 ($75) $75 (1,038) (13) (23) Consolidated $6,085 ($47) $50 $85 $6,173 $5,698 $480 ($75) $75 $6,178 7 (0)