Weitere ähnliche Inhalte
Ähnlich wie Regional Operating Income Bridge 2004 (20)
Kürzlich hochgeladen (20)
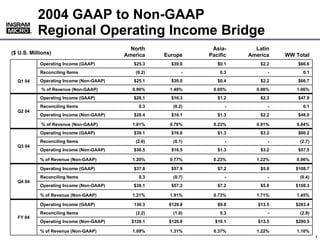
Regional Operating Income Bridge 2004
- 1. 2004 GAAP to Non-GAAP
Regional Operating Income Bridge
®
®
North Asia- Latin
($ U.S. Millions) America Europe Pacific America WW Total
Operating Income (GAAP) $25.3 $39.0 $0.1 $2.2 $66.6
Reconciling Items (0.2) - 0.3 - 0.1
Operating Income (Non-GAAP) $25.1 $39.0 $0.4 $2.2 $66.7
Q1 04
% of Revenue (Non-GAAP) 0.90% 1.49% 0.05% 0.88% 1.06%
Operating Income (GAAP) $28.1 $16.3 $1.2 $2.3 $47.9
Reconciling Items 0.3 (0.2) - - 0.1
Q2 04
Operating Income (Non-GAAP) $28.4 $16.1 $1.3 $2.2 $48.0
% of Revenue (Non-GAAP) 1.01% 0.76% 0.23% 0.91% 0.84%
Operating Income (GAAP) $39.1 $16.6 $1.3 $3.2 $60.2
Reconciling Items (2.6) (0.1) - - (2.7)
Q3 04
Operating Income (Non-GAAP) $36.5 $16.5 $1.3 $3.2 $57.5
% of Revenue (Non-GAAP) 1.20% 0.77% 0.23% 1.22% 0.96%
Operating Income (GAAP) $37.8 $57.9 $7.2 $5.8 $108.7
Reconciling Items 0.3 (0.7) - - (0.4)
Q4 04
Operating Income (Non-GAAP) $38.1 $57.2 $7.2 $5.8 $108.3
% of Revenue (Non-GAAP) 1.21% 1.91% 0.73% 1.71% 1.45%
Operating Income (GAAP) 130.3 $129.8 $9.8 $13.5 $283.4
Reconciling Items (2.2) (1.0) 0.3 - (2.9)
FY 04
Operating Income (Non-GAAP) $128.1 $128.8 $10.1 $13.5 $280.5
% of Revenue (Non-GAAP) 1.09% 1.31% 0.37% 1.22% 1.10%
000000_1
1