Weitere ähnliche Inhalte
Ähnlich wie Regional Operating Income Bridge 2001
Ähnlich wie Regional Operating Income Bridge 2001 (20)
Kürzlich hochgeladen (20)
Regional Operating Income Bridge 2001
- 1. 2001 GAAP to Non-GAAP
Regional Operating Income Bridge
®
®
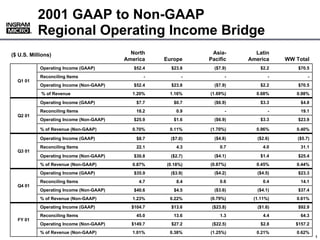
North Asia- Latin
($ U.S. Millions)
America Europe Pacific America WW Total
($7.9) $2.2
Operating Income (GAAP) $52.4 $23.8 $70.5
- -
Reconciling Items - - -
Q1 01
($7.9) $2.2
Operating Income (Non-GAAP) $52.4 $23.8 $70.5
(1.69%) 0.68%
% of Revenue 1.20% 1.16% 0.98%
($6.9) $3.3
Operating Income (GAAP) $7.7 $0.7 $4.8
- -
Reconciling Items 18.2 0.9 19.1
Q2 01
($6.9) $3.3
Operating Income (Non-GAAP) $25.9 $1.6 $23.9
(1.70%) 0.96%
% of Revenue (Non-GAAP) 0.70% 0.11% 0.40%
($4.8) ($2.6)
Operating Income (GAAP) ($5.7)
$8.7 ($7.0)
0.7 4.0
Reconciling Items 31.1
22.1 4.3
Q3 01
($4.1) $1.4
Operating Income (Non-GAAP) $25.4
$30.8 ($2.7)
(0.87%) 0.45%
% of Revenue (Non-GAAP) 0.44%
0.87% (0.18%)
($4.2) ($4.5)
Operating Income (GAAP) $23.3
$35.9 ($3.9)
0.6 0.4
Reconciling Items 14.1
4.7 8.4
Q4 01
($3.6) ($4.1)
Operating Income (Non-GAAP) $37.4
$40.6 $4.5
(0.79%) (1.11%)
% of Revenue (Non-GAAP) 0.61%
1.23% 0.22%
Operating Income (GAAP) $104.7 $13.6 ($23.8) ($1.6) $92.9
Reconciling Items 45.0 13.6 1.3 4.4 64.3
FY 01
Operating Income (Non-GAAP) $149.7 $27.2 ($22.5) $2.8 $157.2
% of Revenue (Non-GAAP) 1.01% 0.38% (1.25%) 0.21% 0.62%
000000_1
1