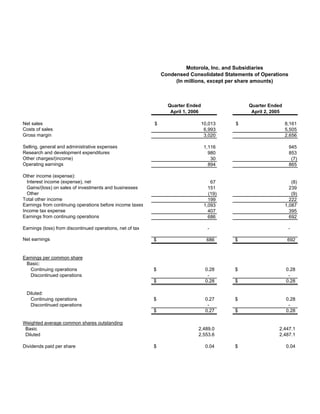
1. Motorola, Inc. and Subsidiaries
Condensed Consolidated Statements of Operations
(In millions, except per share amounts)
Quarter Ended Quarter Ended
April 1, 2006 April 2, 2005
Net sales $ 10,013 $ 8,161
Costs of sales 6,993 5,505
Gross margin 3,020 2,656
Selling, general and administrative expenses 1,116 945
Research and development expenditures 980 853
Other charges/(income) 30 (7)
Operating earnings 894 865
Other income (expense):
Interest income (expense), net 67 (8)
Gains/(loss) on sales of investments and businesses 151 239
Other (19) (9)
Total other income 199 222
Earnings from continuing operations before income taxes 1,093 1,087
Income tax expense 407 395
Earnings from continuing operations 686 692
Earnings (loss) from discontinued operations, net of tax - -
Net earnings $ 686 $ 692
Earnings per common share
Basic:
Continuing operations $ 0.28 $ 0.28
Discontinued operations - -
$ 0.28 $ 0.28
Diluted:
Continuing operations $ 0.27 $ 0.28
Discontinued operations - -
$ 0.27 $ 0.28
Weighted average common shares outstanding
Basic 2,489.0 2,447.1
Diluted 2,553.6 2,487.1
Dividends paid per share $ 0.04 $ 0.04
2. Motorola, Inc. and Subsidiaries
Condensed Consolidated Balance Sheets
(In millions)
ASSETS April 1, December 31,
2006 2005
Cash & cash equivalents $ 4,200 $ 3,774
Sigma funds 10,261 10,867
Short-term investments 185 144
Accounts receivable, net 5,858 5,779
Inventories, net 2,764 2,522
Deferred income taxes 2,351 2,390
Other current assets 2,495 2,393
Total current assets 28,114 27,869
Property, plant and equipment, net 2,248 2,271
Investments 1,556 1,654
Deferred income taxes 1,080 1,245
Other assets 2,711 2,610
Total assets $ 35,709 $ 35,649
LIABILITIES AND STOCKHOLDERS' EQUITY
Notes payable and current portion of
long-term debt $ 470 $ 448
Accounts payable 4,430 4,406
Accrued liabilities 7,548 7,585
Total current liabilities 12,448 12,439
Long-term debt 3,774 3,806
Other liabilities 2,907 2,731
Stockholders' equity 16,580 16,673
Total liabilities and stockholders' equity $ 35,709 $ 35,649
3. Motorola, Inc. and Subsidiaries
Segment Information
(In millions)
Summarized below are the Company's net sales and operating earnings (loss) by reportable segment for the
quarters ended April 1, 2006 and April 2, 2005.
Segment Net Sales
Quarter Ended Quarter Ended % Change
April 1, 2006 April 2, 2005 from 2005
Mobile Devices $ 6,400 $ 4,414 45%
Government & Enterprise Mobility Solutions 1,539 1,503 2%
Networks 1,431 1,657 -14%
Connected Home Solutions 710 662 7%
Other/Eliminations (67) (75) 11%
Segment Totals $ 10,013 $ 8,161 23%
Operating Earnings (Loss)
GAAP Results
Quarter Ended Quarter Ended
April 1, 2006 April 2, 2005
Mobile Devices $ 702 $ 440
Government & Enterprise Mobility Solutions 171 167
Networks 132 234
Connected Home Solutions 15 19
Other/Eliminations (126) 5
Segment Totals $ 894 $ 865