project management information system lecture notes
best buy Second Quarter 2009
1. For Immediate Release
Media Contacts: Investor Contacts:
Susan Busch, Director of Corporate PR Jennifer Driscoll, Vice President of Investor Relations
(612) 291-6114 or susan.busch@bestbuy.com (612) 291-6110 or jennifer.driscoll@bestbuy.com
Kelly Groehler, Senior Manager of Corporate PR Wade Bronson, Director of Investor Relations
(612) 291-6115 or kelly.groehler@bestbuy.com (612) 291-5693 or wade.bronson@bestbuy.com
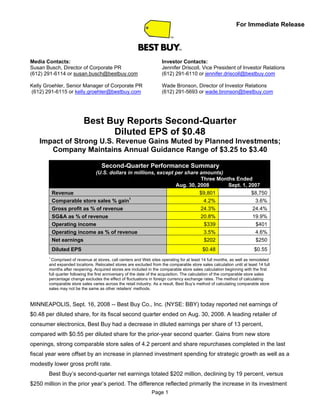
Best Buy Reports Second-Quarter
Diluted EPS of $0.48
Impact of Strong U.S. Revenue Gains Muted by Planned Investments;
Company Maintains Annual Guidance Range of $3.25 to $3.40
Second-Quarter Performance Summary
(U.S. dollars in millions, except per share amounts)
Three Months Ended
Aug. 30, 2008 Sept. 1, 2007
$9,801 $8,750
Revenue
Comparable store sales % gain1 4.2% 3.6%
24.3% 24.4%
Gross profit as % of revenue
20.8% 19.9%
SG&A as % of revenue
$339 $401
Operating income
3.5% 4.6%
Operating income as % of revenue
$202 $250
Net earnings
$0.48 $0.55
Diluted EPS
1
Comprised of revenue at stores, call centers and Web sites operating for at least 14 full months, as well as remodeled
and expanded locations. Relocated stores are excluded from the comparable store sales calculation until at least 14 full
months after reopening. Acquired stores are included in the comparable store sales calculation beginning with the first
full quarter following the first anniversary of the date of the acquisition. The calculation of the comparable store sales
percentage change excludes the effect of fluctuations in foreign currency exchange rates. The method of calculating
comparable store sales varies across the retail industry. As a result, Best Buy’s method of calculating comparable store
sales may not be the same as other retailers’ methods.
MINNEAPOLIS, Sept. 16, 2008 -- Best Buy Co., Inc. (NYSE: BBY) today reported net earnings of
$0.48 per diluted share, for its fiscal second quarter ended on Aug. 30, 2008. A leading retailer of
consumer electronics, Best Buy had a decrease in diluted earnings per share of 13 percent,
compared with $0.55 per diluted share for the prior-year second quarter. Gains from new store
openings, strong comparable store sales of 4.2 percent and share repurchases completed in the last
fiscal year were offset by an increase in planned investment spending for strategic growth as well as a
modestly lower gross profit rate.
Best Buy’s second-quarter net earnings totaled $202 million, declining by 19 percent, versus
$250 million in the prior year’s period. The difference reflected primarily the increase in its investment
Page 1
2. Best Buy 1Q09 Earnings/ 2 2 2
spending for enhancements to U.S. stores, such as the rollout of Best Buy Mobile to the remainder of
its stores, the reset of the GPS selling space, and additional investments in store labor. In addition,
the company continued its international expansion, investing in both people and technology to expand
its presence in China and prepare for its first stores in Mexico and Turkey. Other factors in the net
earnings decline were a slight decrease in the gross profit rate as well as lower investment income,
offset in part by the favorable impact of a 12-percent revenue increase.
Second-Quarter Highlights
• Total quarterly revenue increased 12 percent to $9.8 billion, driven by gains from new store
openings and a comparable store sales increase of 4.2 percent. Domestic revenue grew 12
percent, reflecting the net addition of 124 new stores in the past 12 months and a comparable
store sales gain of 5.3 percent. International revenue increased 10 percent, benefiting from
the net addition of 32 new stores in the past 12 months and the positive impact of foreign
currency exchange rate fluctuations, which were partially offset by a comparable store sales
decline of 1 percent.
• The company’s online business continued to grow at a rapid pace. Its domestic online revenue
increased by 32 percent, reflecting continued consumer interest in this shopping channel.
• The company estimated that its domestic market share increased by approximately 1.6
percentage points compared with the prior year’s period. Best Buy Reward Zone membership
increased by 27 percent over the prior year period, to 31 million memberships in the United
States.
• Customer satisfaction scores reached an all-time high, and employee turnover decreased 19
percentage points on a year-over-year basis, to 49 percent.
• As planned, the company completed its deployment of the Best Buy Mobile experience to all
973 existing U.S. Best Buy stores. In Canada, it launched its first two Best Buy Mobile stand-
alone stores and five store-within-a-store locations. Best Buy Mobile dramatically improves the
customer experience for wireless products in Best Buy stores, and drove a strong double-digit
gain in U.S. wireless connections for the fiscal second quarter (including prepaid and postpaid
wireless connections as well as air cards). The company also experienced a nearly triple-digit
gain in comparable store sales of mobile phones and accessories.
• During the quarter, the company closed on its acquisition of a 50-percent interest in the retail
and distribution business of The Carphone Warehouse Group PLC, a retailer of mobile phones
and related products and services with 2,400 stores in nine European countries. This new
venture is referred to by Best Buy as “Best Buy Europe.”
3. Best Buy 1Q09 Earnings/ 3 3 3
“We believe our strategic indicators remain strong,” said Brad Anderson, vice chairman and CEO
of Best Buy. “Customers are noticing and appreciating the changes we’ve made in our shopping
experience. Yet we have some work to do in terms of managing our expenses amid a challenging
macro economic environment. We plan to continue our growth investments and reduce our lower-
priority spending in order to continue our customer support in the second half.”
“In a challenging environment that finds many of our competitors retrenching, we are growing
and opening more new stores,” said Brian Dunn, president and chief operating officer of Best Buy.
“We believe it’s prudent for strong companies to distance themselves from their competitors during
tough times. We know that when the world’s most resilient economy rebounds, we’ll be well
positioned to benefit from it.”
Second-Quarter Results Include Strong Revenue Growth
For the fiscal 2009 second quarter, Best Buy’s revenue increased 12 percent to $9.8 billion,
compared with revenue of $8.8 billion for the second quarter of fiscal 2008. The revenue increase
reflected the net addition of 156 new stores in the past 12 months, a comparable store sales gain of 4.2
percent and the favorable impact of foreign currency fluctuations. The comparable store sales gain for
the quarter was driven by an increase in the average ticket as the company’s revenue mix continued to
shift to larger-ticket items, such as flat-panel TVs, notebook computers and mobile phones.
The gross profit rate for the fiscal second quarter was 24.3 percent of revenue, compared with
24.4 percent in the prior-year period. This modest decline was in line with the company’s expectations
and was driven by strong sales of lower-margin items (such as notebook computers and video game
consoles). The impact of these unfavorable changes in the revenue mix was largely offset by increased
sales of higher-margin mobile phones, supported by the Best Buy Mobile store conversions.
Best Buy’s selling, general and administrative expense rate increased to 20.8 percent of
revenue for the fiscal second quarter, compared with 19.9 percent of revenue for the prior year’s fiscal
second quarter. Increases in store labor to support the Best Buy Mobile operating model and planned
investments in customer-facing labor generated most of the SG&A rate increase. In addition, the
company reset the GPS areas of its domestic stores, incurred costs through the conversion of stores
to the Best Buy Mobile experience and added Apple store-within-a-store and musical instrument
locations within its U.S. Best Buy stores. Last, Best Buy invested in international capabilities and new
market entries. Specifically, the company accelerated its investment in both personnel and technology
platforms internationally and experienced an increase in operating costs for its locations in China. The
company also cited as drivers of higher costs increased spending on labor to support the back-to-
school shopping experience, and increased travel expenses.
The company reported investment income and other of $9 million, compared with $22 million
in the prior year’s fiscal second quarter. The expected reduction in investment income and other
4. Best Buy 1Q09 Earnings/ 4 4 4
reflected the impact of lower average cash and investment balances and financing costs related to
debt incurred in connection with Best Buy Europe.
“We’ve already identified cost savings in the back half of the year, but we will not stop
investing in selected growth projects, nor will we make any moves that erode the customer
experience,” said Dunn. “Our employees are connecting with our customers, growing our business
locally, and we want to thank them for their outstanding efforts. In the teeth of a tough market, they
continue to create better and better experiences for our customers, and our customers are responding
by choosing Best Buy over the competition at a convincing rate.”
Company Maintains Annual EPS of $3.25 to $3.40 for Fiscal 2009
Jim Muehlbauer, Best Buy’s executive vice president of finance and CFO, provided updated
guidance for the company’s base business, which includes its operations in the United States,
Canada and China; its expectations for Best Buy Europe; and its guidance for the total company.
Commenting on the base business, Muehlbauer said, “Our revenue growth for the fiscal
second quarter met our expectations. We were very pleased with our domestic comparable store
sales gains, especially in light of the macro economy and the discretionary nature of many of our
products. While our operating profit rate finished below our expectations for the quarter, we plan to
reduce our SG&A spending in the second half both to improve results and to focus on key growth
initiatives, recognizing that additional challenges lie ahead of us in this difficult consumer environment.
Based on our first-half results and confidence in the areas we control in the balance of the year, we
believe our base business will deliver earnings that are largely in line with our original expectations.”
The company now expects a comparable store sales gain for fiscal 2009 in the upper half of its
previously disclosed range of 1 percent to 3 percent. Best Buy estimates total revenue for the fiscal
year of approximately $44 billion for the base business, which excludes Best Buy Europe. Second-half
comparable store sales gains are expected to be lower than the first-half gain of 4.0%, primarily due
to macro-economic headwinds and the cessation of government fiscal stimulus checks. Additionally,
the expected phasing of second-half results will reflect one week of post-Thanksgiving shopping
shifting back into the company’s fiscal fourth quarter. This calendar shift is anticipated to negatively
impact its fiscal third-quarter comparable store sales by 2 percent to 3 percent.
The annual gross profit rate of the base business is now expected to decline approximately 10
basis points versus fiscal 2008, while the SG&A rate is expected to de-leverage approximately 30
basis points. As a result, the company now projects an annual operating profit rate of approximately 5
percent of revenue for its base business.
The company also provided updated guidance for Best Buy Europe. As previously reported,
the new venture with CPW closed on June 30. Operating results will be reported on a two-month lag
and therefore will be included in the company’s international segment, starting with the fiscal third
5. Best Buy 1Q09 Earnings/ 5 5 5
quarter. Best Buy Europe’s operations are expected to be accretive to the enterprise by 3 cents per
diluted share for fiscal 2009, inclusive of the costs of financing the $2.2 billion acquisition. Best Buy
now expects that Best Buy Europe will add approximately $3.2 billion in revenue to its second half.
The operating model for the new venture carries a higher gross profit rate, and a higher SG&A rate,
compared with the company’s base business. The expected operating income rate for Best Buy
Europe for the back half of this fiscal year is approximately 4 percent including the negative impact of
purchase accounting. The company also anticipates its European retail business to have a lower tax
rate, compared with the tax rate for the company’s base business.
As previously announced, the company suspended its share repurchase program in May in
order to fund this transaction; the dilutive EPS impact of that decision is 5 cents per share for the
fiscal year.
The combined effect of the acquisition and the share repurchase suspension is annual
earnings dilution of 2 cents per share. This estimate is below prior guidance as the company has now
completed the phasing of operating plans for Best Buy Europe and updated its estimates for the
purchase accounting of amortization of intangible assets. Additionally, the recent strength of the U.S.
dollar is expected to negatively impact the results of Best Buy Europe as incorporated in Best Buy’s
financials.
Including the base business projections, the expected accretion from Best Buy Europe and the
dilution from the share repurchase suspension, the company anticipates a diluted EPS of $3.25 to
$3.40 for fiscal 2009, a year-over-year increase of approximately 7 percent. This guidance assumes
revenue of approximately $47 billion, including the impact of new store openings as well as a
comparable store sales gain of 2 percent to 3 percent (Best Buy Europe will be excluded from
comparable store sales for 14 months). The company also projects capital expenditures of
approximately $1.2 billion and a tax rate of 37 percent to 37.5 percent.
The following table summarizes the annual guidance, separately showing the base business,
Best Buy Europe and the impact from suspended share repurchases.
6. Best Buy 1Q09 Earnings/ 6 6 6
Best Buy Enterprise Annual Guidance Summary
Base Business Best Buy Impact of Total
Europe1
(Excludes Best Suspended Enterprise
Buy Europe) Share Annual
Repurchas Guidance
es
$44 billion $3.2 billion n/a $47.0 billion
Revenue
2% to 3% n/a n/a 2% to 3%
Comparable store sales % gain
23.8% 35.0% n/a 24.6%
Gross profit as % of revenue
Flat to (10 bps) n/a n/a 70 to 80 bps
Gross profit % YoY change
18.8% 31.0% n/a 19.6%
SG&A % as of revenue
(30 bps) n/a n/a (110 to 120 bps)
SG&A % YoY change
~5.0% ~4.0% n/a ~5.0%
Operating income as % of revenue
(30 to 40 bps) n/a n/a (30 to 40 bps)
Operating income % YoY change
37.5% to 38.0% 25% n/a 37.0% to 37.5%
Effective tax rate
$3.25 to $3.40 $0.03 $(0.05) $3.25 to $3.40
Diluted EPS
1
The $0.03 of accretion is inclusive of the impact of minority interest earnings (as CPW is a 50% shareholder in Best Buy Europe) as well as
transaction financing costs.
While Best Buy Europe’s operating results will not be incorporated until the fiscal third quarter,
its assets and liabilities are included in the accompanying balance sheet as of Aug. 30, 2008. A
summary of that information is provided as a supplemental schedule.
Company’s U.S. Business Gains Share in Most Revenue Categories
Domestic Performance Summary
(U.S. dollars in millions)
Three Months Ended Six Months Ended
Aug. 30, 2008 Sept. 1, 2007 Aug. 30, 2008 Sept. 1, 2007
$8,133 $7,234 $15,586 $13,938
Revenue
Comparable store sales % gain1 5.3% 1.7% 4.4% 1.7%
24.9% 25.1% 24.7% 24.9%
Gross profit as % of revenue
21.0% 20.2% 20.9% 20.4%
SG&A as % of revenue
$315 $358 $592 $628
Operating income
3.9% 5.0% 3.8% 4.5%
Operating income as % of revenue
1
Comprised of revenue at stores, call centers and Web sites operating for at least 14 full months, as well as remodeled and expanded locations.
Relocated stores are excluded from the comparable store sales calculation until at least 14 full months after reopening. Acquired stores are
included in the comparable store sales calculation beginning with the first full quarter following the first anniversary of the date of the acquisition.
The method of calculating comparable store sales varies across the retail industry. As a result, Best Buy’s method of calculating comparable store
sales may not be the same as other retailers’ methods.
7. Best Buy 1Q09 Earnings/ 7 7 7
Best Buy’s domestic segment—comprised of U.S. Best Buy, Best Buy Mobile, U.S. Geek
Squad, Magnolia Audio Video, Pacific Sales and Speakeasy operations—reported second-quarter
operating income of $315 million, a decrease of $43 million, compared with the prior year’s fiscal
second quarter.
The domestic segment’s fiscal second-quarter revenue totaled $8.1 billion, an increase of 12
percent over the prior year’s second quarter. The revenue increase was driven by the net addition of
124 new stores in the past 12 months and a comparable store sales gain of 5.3 percent. The
comparable store sales gain reflected an increase in the average transaction amount, which was
offset in part by a decline in customer traffic. The company estimated that its U.S. market share rose
to a record high in the first calendar quarter of the year, led by gains in the computing and television
categories.
The decrease in the operating income rate reflected an 80-basis-point increase in the SG&A
rate and a 20-basis-point decrease in the gross profit rate. The increase in the SG&A rate was
primarily driven by planned investments, including the operation of more than 900 Best Buy Mobile
stores, and investments related to other store projects. The reduction in the gross profit rate reflected
a continued shift in the revenue mix to lower-margin notebook computers and video game hardware,
which was offset by the benefit of increases in mobile phones and accessories in the revenue mix.
Domestic Category Summary
Revenue Mix Summary Comparable Store Sales
Three Months Ended Three Months Ended
Revenue Category
Sept. 1, 2007 Sept. 1, 2007
Aug. 30, 2008 Aug. 30, 2008
Consumer Electronics 38% 39% 2.0% (3.3%)
Home Office 34% 31% 15.1% 7.8%
Entertainment Software 16% 17% 0.0% 7.0%
Appliances 5% 6% (9.8%) (7.4%)
Services 7% 7% 8.7% 3.2%
Other <1% <1% n/a n/a
Total 100% 100% 5.3% 1.7%
Domestic comparable store sales gains were driven by flat-panel TVs, notebook computers,
mobile phones and video gaming.
The home office revenue category led the domestic revenue growth for the fiscal second
quarter. The home office revenue category, which accounted for 34 percent of fiscal second-quarter
revenue, had a 15.1-percent comparable store sales gain. A double-digit comparable store sales
8. Best Buy 1Q09 Earnings/ 8 8 8
increase for notebook computers fueled the growth as customers continued to respond to Best Buy’s
industry-leading assortment and customer service. Mobile phones and accessories experienced a
nearly triple-digit increase comparable store sales and a strong double-digit gain in wireless
connections, led by the chain-wide expansion of Best Buy Mobile, which offers an improved
assortment and customer service along with independent advice. These gains were partially offset by
expected comparable store sales declines in printers and landline phones.
The services revenue category accounted for 7 percent of second-quarter revenue. On a
comparable store sales basis, the services category increased 8.7 percent. A double-digit gain in
home theater services, a high single-digit gain in computer services and mid single-digit increase in
warranty comparable store sales drove the improvement.
Consumer electronics, which represented 38 percent of fiscal second-quarter revenue, posted
a 2.0-percent comparable store sales gain. The company enjoyed double-digit comparable store sale
increases in flat-panel TVs and GPS products. The total television category posted a low double-digit
comparable store sales gain. Projection and tube televisions experienced a strong double-digit
comparable store sales decline as consumers continued to opt for flat-panel technology. MP3 players
showed a low single-digit comparable store sales decline, while digital imaging experienced a low
double-digit decline.
The entertainment software revenue category, which comprised 16 percent of second-quarter
revenue, was flat year-over-year on a comparable store sales basis. A double-digit gain in comparable
store sales of video gaming was supported by strong sales of consoles, which offered better in-stock
levels and attractive pricing. This gain was offset by continued comparable store sales declines for
CDs and DVDs, as expected.
The appliances revenue category, which totaled 5 percent of fiscal 2009 second-quarter
revenue, had a comparable store sales decline of 9.8 percent. This decrease was driven by a low
double-digit decline in comparable store sales of major appliances amid a challenging industry-wide
environment, partially offset by an increase in average selling prices versus the prior year. Despite
negative industry trends, Best Buy estimates that it increased its market share in appliances due to
increased customer interest in high-end appliances and a well-trained sales force.
9. Best Buy 1Q09 Earnings/ 9 9 9
International Segment Builds Capabilities, Prepares for Controlled Market Entries
International Performance Summary
(U.S. dollars in millions)
Three Months Ended Six Months Ended
Aug. 30, 2008 Sept. 1, 2007 Aug. 30, 2008 Sept. 1, 2007
$1,668 $1,516 $3,205 $2,739
Revenue
Comparable store sales % change1 (1.0)% 16.3% 1.7% 14.7%
21.3% 21.2% 20.8% 20.6%
Gross profit as % of revenue
19.9% 18.4% 20.1% 19.2%
SG&A as % of revenue
$24 $43 $24 $39
Operating income
1.4% 2.9% 0.7% 1.4%
Operating income as % of revenue
1
Comprised of revenue at stores and Web sites operating for at least 14 full months, as well as remodeled and expanded locations.
Relocated stores are excluded from the comparable store sales calculation until at least 14 full months after reopening. Acquired
stores are included in the comparable store sales calculation beginning with the first full quarter following the first anniversary of the
date of the acquisition. The calculation of the comparable store sales percentage change excludes the effect of fluctuations in foreign
currency exchange rates. The method of calculating comparable store sales varies across the retail industry. As a result, Best Buy’s
method of calculating comparable store sales may not be the same as other retailers’ methods.
The company’s international segment—comprised of Best Buy, Best Buy Mobile and Geek
Squad operations in Canada and China, Five Star operations in China, and Future Shop operations in
Canada—generated $24 million in operating income for the fiscal second quarter, a planned reduction
of $19 million versus the prior year period, as the company invested in international capabilities,
prepared for expansion of Best Buy China and readied for market entries in Mexico, Turkey and
Europe.
The international segment’s fiscal second-quarter revenue rose 10 percent to $1.7 billion. The
revenue increase was driven by the net addition of 32 new stores and fluctuations in foreign currency
exchange rates. Partially offsetting these gains was a 1.0-percent decline in comparable store sales
versus a 16.3-percent gain in the prior year. Revenue results for the period included modest gains in
Canada and soft results in China, where the earthquake and major stock market declines in the fiscal
second quarter reduced consumer activity throughout the country.
The 10-basis-point improvement in the international gross profit rate was driven largely by
improved promotional management coupled with optimization initiatives in China. These margin
benefits were partially offset by negative changes in the revenue mix in Canada, reflecting increased
sales of lower-margin notebook computers and video gaming hardware. The SG&A rate rose by 150
basis points due to continued planned investments in Best Buy China for future store expansion, new
store start-up expenses for Mexico and Turkey, investments in information technology and customer
analytics, as well as de-leverage of expenses associated with the comparable store sales decline and
higher operating costs in China.
10. Best Buy 1Q09 Earnings/ 10 10 10
The company opened its second Best Buy store in China since quarter end and received
government approval for four additional new stores, all four of which are expected to open within the
next six months.
“We’re extremely pleased to add Carphone’s 2,400 stores to our organization, and to
welcome its many talented employees to our company,” said Bob Willett, CEO – International and
CIO of Best Buy. “Their entrepreneurial spirit, marketing prowess and common vision for the future
will accelerate our ability to open new Best Buy stores in Europe and tap the unmet needs of
European customers.”
International Category Summary
Revenue Mix Summary Comparable Store Sales
Three Months Ended Three Months Ended
Revenue Category
Sept. 1, 2007 Sept. 1, 2007
Aug. 30, 2008 Aug. 30, 2008
Consumer Electronics 36% 35% 3.7% 10.3%
Home Office 30% 32% (2.6%) 21.1%
Entertainment Software 11% 10% 13.1% 30.9%
Appliances 18% 18% (13.2%) (3.8%)
Services 5% 5% (2.6%) 19.4%
Other <1% <1% n/a n/a
Total 100% 100% (1.0%) 16.3%
“Our Canadian business performed relatively well in a tough economic environment,” said
Willett. “In China, the earthquake and the major decline in the Chinese stock markets had a major
effect on the psyche of the country, leading to a dramatic impact on the economy and retail sales. Our
comparable store sales in China declined by the high single digits. We would expect conditions in
China to improve next quarter, due to pent-up consumer demand as the country’s people recover and
rebuild.”
Store Counts and Shareholder Return Information
During the second quarter of fiscal 2009, the company opened 24 U.S. Best Buy stores,
including five of its 45,000-square-foot stores, 18 of its 30,000-square-foot stores, and one of its
20,000-square-foot stores. At the end of the second quarter, the domestic segment included 973 Best
Buy stores, 21 Best Buy Mobile stand-alone stores, seven Geek Squad stand-alone stores, 13
Magnolia Audio Video stores and 22 Pacific Sales showrooms. The international segment included
161 Five Star stores and one Best Buy store in China, as well as 133 Future Shop stores, 52 Best Buy
11. Best Buy 1Q09 Earnings/ 11 11 11
stores and two Best Buy Mobile stand-alone stores in Canada. For the trailing 12 months, the
company opened 160 new stores and closed four stores. More details regarding historical store
counts and square footage are available on the company’s Web site under “For Our Investors.”
On July 29, 2008, the company paid a dividend of 13 cents per share, or $53 million in the
aggregate, which was a 30-percent increase compared with the dividend per share paid in the prior
year’s fiscal second quarter.
Best Buy is scheduled to conduct an earnings conference call at 10 a.m. Eastern Time on
Sept. 16, 2008. The call is expected to be available on its Web site both live and after the call at
www.BestBuy.com. The public may access the call by clicking on “For Our Investors.”
Forward-Looking and Cautionary Statements:
This news release contains forward-looking statements within the meaning of the Private Securities
Litigation Reform Act of 1995 as contained in Section 27A of the Securities Act of 1933 and Section 21E of the
Securities Exchange Act of 1934 that reflect management’s current views and estimates regarding future market
conditions, company performance and financial results, business prospects, new strategies, the competitive
environment and other events. You can identify these statements by the fact that they use words such as
“anticipate,” “believe,” “estimate,” “expect,” “intend,” “project,” “plan,” “outlook,” and other words and terms of similar
meaning. These statements involve a number of risks and uncertainties that could cause actual results to differ
materially from the potential results discussed in the forward-looking statements. Among the factors that could
cause actual results and outcomes to differ materially from those contained in such forward-looking statements
include the following: general economic conditions, acquisitions and development of new businesses, divestitures,
product availability, sales volumes, pricing actions and promotional activities of competitors, profit margins, weather,
changes in law or regulations, foreign currency fluctuation, availability of suitable real estate locations, the
company’s ability to react to a disaster recovery situation, the impact of labor markets and new product
introductions on overall profitability, failure to achieve anticipated benefits of announced transactions and integration
challenges relating to new ventures. A further list and description of these risks, uncertainties and other matters
can be found in the company’s annual report and other reports filed from time to time with the Securities and
Exchange Commission, including, but not limited to, Best Buy’s Annual Report on Form 10-K filed with the SEC on
April 30, 2008. Best Buy cautions that the foregoing list of important factors is not complete and assumes no
obligation to update any forward-looking statement that it may make.
About Best Buy Co., Inc.
With operations in the United States, Canada, Europe and China, Best Buy Co., Inc. (NYSE: BBY) is a
multinational retailer of technology and entertainment products and services with a commitment to growth and
innovation. The Best Buy Co., Inc. family of brands collectively generates more than $40 billion annual
revenue and includes brands such as Best Buy, Audiovisions, The Carphone Warehouse, Future Shop, Geek
Squad, Jiangsu Five Star, Magnolia Audio Video, Pacific Sales Kitchen and Bath Centers, The Phone House
and Speakeasy. Approximately 165,000 employees apply their talents to help bring the benefits of these brands
to life for customers through retail locations, multiple call centers and web sites, in-home solutions, product
delivery and in our communities. Community partnership is central to the way we do business at Best Buy. In
fiscal 2008, we donated a combined $31.8 million to improve the vitality of the communities where our
employees and customers live and work. For more information about Best Buy Co., Inc., visit www.bestbuy.com.
###
12. Best Buy 1Q09 Earnings/ 12 12 12
BEST BUY CO., INC.
CONDENSED CONSOLIDATED STATEMENTS OF EARNINGS
($ in millions, except per share amounts)
(Unaudited)
Three Months Ended Six Months Ended
Aug. 30, Sept. 1, Aug. 30, Sept. 1,
2008 2007 2008 2007
Revenue $ 9,801 $ 8,750 $ 18,791 $ 16,677
Cost of goods sold 7,420 6,611 14,277 12,646
Gross profit 2,381 2,139 4,514 4,031
Gross profit % 24.3% 24.4% 24.0% 24.2%
Selling, general and administrative expenses 2,042 1,738 3,898 3,364
SG&A % 20.8% 19.9% 20.7% 20.2%
Operating income 339 401 616 667
Other income (expense)
Investment income and other 9 22 30 66
Interest expense (21) (23) (34) (30)
Earnings before income taxes, minority
interest and equity in loss of affiliates 327 400 612 703
Income tax expense 122 144 228 257
Effective tax rate 37.3% 36.3% 37.2% 36.7%
Minority interest (3) (5) (2) (3)
Equity in loss of affiliates --- (1) (1) (1)
Net earnings $ 202 $ 250 $ 381 $ 442
Earnings per share
Basic $ 0.49 $ 0.56 $ 0.92 $ 0.96
Diluted(1) $ 0.48 $ 0.55 $ 0.91 $ 0.94
Dividends declared per common share $ 0.13 $ 0.10 $ 0.26 $ 0.20
Weighted average common shares
outstanding (in millions)
Basic 412.1 444.1 411.7 461.5
Diluted(1) 423.3 456.2 423.0 473.8
(1) The calculation of diluted earnings per share assumes the conversion of our convertible debentures due in
2022 into 8.8 million shares of common stock and adds back the related after-tax interest expense of $1.4
for both the three months ended Aug. 30, 2008 and Sept. 1, 2007, respectively, and $2.9 for both the six
months ended Aug. 30, 2008 and Sept. 1, 2007, respectively.
–Balance Sheets Follow –
13. Best Buy 1Q09 Earnings/ 13 13 13
BEST BUY CO., INC.
CONDENSED CONSOLIDATED BALANCE SHEETS
($ in millions)
(Unaudited)
Aug. 30, Sept. 1,
2008 (1) 2007
ASSETS
Current assets
Cash and cash equivalents $ 656 $ 1,390
Short-term investments 4 121
Receivables 1,785 554
Merchandise inventories 6,105 4,650
Other current assets 782 733
Total current assets 9,332 7,448
Net property & equipment 4,119 3,118
Goodwill 2,536 1,053
Tradenames 188 93
Equity and other investments 497 200
Other assets 850 325
TOTAL ASSETS $ 17,522 $ 12,237
LIABILITIES & SHAREHOLDERS' EQUITY
Current liabilities
Accounts payable $ 5,924 $ 4,312
Accrued liabilities 2,502 1,778
Short-term debt 1,515 1,357
Current portion of long-term debt 39 20
Total current liabilities 9,980 7,467
Long-term liabilities 929 751
Long-term debt 1,136 600
Minority interests 725 38
Shareholders' equity 4,752 3,381
TOTAL LIABILITIES &
SHAREHOLDERS' EQUITY $ 17,522 $ 12,237
###
(1) The condensed consolidated balance sheet at Aug. 30, 2008 includes the net assets of Best Buy
Europe, which consists of total assets of $4,722, total liabilities of $1,844 and minority interest of $682
for an aggregate purchase price of $2,196. See the supplemental schedule attached for the preliminary
purchase price allocation of the nets assets acquired.
14. Best Buy 1Q09 Earnings/ 14 14 14
BEST BUY EUROPE
PRELIMINARY PURCHASE PRICE ALLOCATION
($ in millions)
(Unaudited)
Cash and cash equivalents $ 219
Short-term investments 4
Receivables 1,186
Merchandise inventories 543
Other current assets 123
Property and equipment 555
Goodwill 1,491
Tradenames 94
Equity and other investments 14
Other assets (primarily customer relationships) 493
Total assets 4,722
Accounts payable 814
Accrued liabilities 694
Short-term debt 299
Long-term liabilities 37
Total liabilities 1,844
Minority interest 682
$ 2,196
Net assets acquired