Top Rated Pune Call Girls Shikrapur ⟟ 6297143586 ⟟ Call Me For Genuine Sex S...
allstate Quarterly Investor Information 2005 1st Earnings Press Release
1. For Immediate Release
Allstate Reports 22% Increase in 2005 First Quarter Net Income EPS,
16% Increase in First Quarter Operating Income EPS and
Record Property-Liability Underwriting Profitability
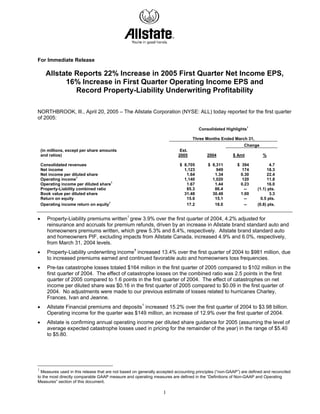
NORTHBROOK, Ill., April 20, 2005 – The Allstate Corporation (NYSE: ALL) today reported for the first quarter
of 2005:
1
Consolidated Highlights
Three Months Ended March 31,
Change
(in millions, except per share amounts Est.
and ratios) 2005 2004 $ Amt %
Consolidated revenues $ 8,705 $ 8,311 $ 394 4.7
Net income 1,123 949 174 18.3
Net income per diluted share 1.64 1.34 0.30 22.4
1
Operating income 1,140 1,020 120 11.8
1
Operating income per diluted share 1.67 1.44 0.23 16.0
Property-Liability combined ratio 85.3 86.4 -- (1.1) pts.
Book value per diluted share 31.48 30.48 1.00 3.3
Return on equity 15.6 15.1 -- 0.5 pts.
1
Operating income return on equity 17.2 18.0 -- (0.8) pts.
• Property-Liability premiums written1 grew 3.9% over the first quarter of 2004, 4.2% adjusted for
reinsurance and accruals for premium refunds, driven by an increase in Allstate brand standard auto and
homeowners premiums written, which grew 5.3% and 8.4%, respectively. Allstate brand standard auto
and homeowners PIF, excluding impacts from Allstate Canada, increased 4.9% and 6.0%, respectively,
from March 31, 2004 levels.
• Property-Liability underwriting income1 increased 13.4% over the first quarter of 2004 to $981 million, due
to increased premiums earned and continued favorable auto and homeowners loss frequencies.
• Pre-tax catastrophe losses totaled $164 million in the first quarter of 2005 compared to $102 million in the
first quarter of 2004. The effect of catastrophe losses on the combined ratio was 2.5 points in the first
quarter of 2005 compared to 1.6 points in the first quarter of 2004. The effect of catastrophes on net
income per diluted share was $0.16 in the first quarter of 2005 compared to $0.09 in the first quarter of
2004. No adjustments were made to our previous estimate of losses related to hurricanes Charley,
Frances, Ivan and Jeanne.
• Allstate Financial premiums and deposits1 increased 15.2% over the first quarter of 2004 to $3.98 billion.
Operating income for the quarter was $149 million, an increase of 12.9% over the first quarter of 2004.
• Allstate is confirming annual operating income per diluted share guidance for 2005 (assuming the level of
average expected catastrophe losses used in pricing for the remainder of the year) in the range of $5.40
to $5.80.
1
Measures used in this release that are not based on generally accepted accounting principles (“non-GAAP”) are defined and reconciled
to the most directly comparable GAAP measure and operating measures are defined in the “Definitions of Non-GAAP and Operating
Measures” section of this document.
1
2. “This is a strong start for Allstate in 2005, ” said Edward M. Liddy, Allstate chairman, president, and CEO. “
We generated solid net and operating income in this first quarter of 2005 on good revenue growth. Seeking
profitable growth is our objective and results this quarter provide more evidence that our focus continues to
benefit our shareholders.
“Allstate Protection generated almost $1 billion of underwriting income in the quarter, an increase of more
than 13 percent over the first quarter of 2004. Contributing to that record underwriting result was an
improvement in frequency trends for both Allstate brand standard auto and homeowners compared to the first
quarter of 2004. Premium written for Allstate Protection increased almost 4% over the first quarter of 2004
while premium written for Allstate brand standard auto and homeowners increased 5.3% and 8.4%,
respectively, compared to first quarter of 2004. Policies in force (PIF) for Allstate brand standard auto and
homeowners grew 4.9 percent and 6 percent, respectively, compared to the first quarter of 2004. Our
retention rate in the quarter remained strong and continued near historical highs.
“I remain very encouraged by these excellent results for Allstate Protection. As competition within our industry
increases, our Tiered Pricing efforts will continue to serve us well and the new business we bring on our
books should generate profitable growth.
“In the first quarter, we began our introduction in certain markets of the next iteration of Tiered Pricing for our
auto insurance line. We are also introducing new versions of Tiered Pricing for homeowners and our other
lines of business in the coming months. The changes we have made to Tiered Pricing will allow us to
segment risks with even more sophistication, which will help us achieve the profitable growth we seek.
Through our marketing and advertising, we are continuing to communicate the benefits and advantages
Allstate offers customers and are doing so with a more targeted approach. We are also introducing a new
auto insurance product that we believe will significantly increase customer choice and further enhance the
value proposition Allstate offers to consumers.
“Allstate Financial also turned in a solid performance for the quarter. Premium and deposits of almost $4
billion were 15.2% over the first quarter of 2004 with double digit growth rates experienced in our Allstate
agency, bank, broker-dealer and independent agency distribution systems. Operating income of $149 million
was 12.9% over the first quarter of 2004, driven by investment and benefit margin growth.
“In the quarter, we repurchased 13.4 million shares at $706 million, which is an excellent start to our
previously announced $4.0 billion share repurchase program to be completed in 2006. As previously
announced, we also increased our quarterly dividend to $0.32 per share, a 14.3% increase over prior year.
We will use capital to grow profitably and achieve our targeted returns. In addition, as history has shown, we
will return capital to shareholders when we are unable to effectively deploy all the capital we are generating in
our various businesses. Profitable business growth in addition to these capital management strategies will
continue to drive growth in EPS and book value per share in the future.
“Our operating income return on equity for the past four quarters was a very attractive 17.2%, after absorbing
the unusually high level of catastrophe losses in the third quarter of 2004. Overall, the first quarter was an
outstanding start to the year. We remain very optimistic about the remainder of 2005 and beyond.”
2
3. Consolidated Highlights
Three Months Ended Discussion of Results for the
March 31, Three Months Ended March 31, 2005
($ in millions, except per share Est.
and return amounts) 2005 2004
<
Consolidated revenues $8,705 $8,311 Growth of Property-Liability premiums earned, higher life and annuity
premiums and contract charges and higher net investment income, partially
offset by lower net realized capital gains due to anticipated disposition write-
downs.
<
Operating income 1,140 1,020 Increase in Property-Liability operating income of $107 and Allstate Financial
operating income of $17.
<
Realized capital gains and 80 120 See the Components of Realized Capital Gains and Losses (pretax) table.
losses, after-tax
<
DAC and DSI amortization (61) (10) Amortization related to certain realized capital gains.
relating to realized capital
gains and losses, after-tax
<
Non-recurring increase in (22) -- Increase in liability for future benefits for a discontinued benefit plan.
liability for future benefits,
after-tax
<
Cumulative effect of change in -- (175) Adoption of AICPA SOP 03-1, “Accounting and Reporting by Insurance
accounting principle, after-tax Enterprises for Certain Nontraditional Long-Duration Contracts and for
Separate Accounts” in the first quarter of 2004.
<
Net income 1,123 949 Increase in Property-Liability and Allstate Financial operating income.
<
Net income per share (diluted) 1.64 1.34 See discussion of Exposure to Potential Subsequent Event for Citizens
Property Insurance Corporation Assessment of up to $0.04 per diluted
share.
Operating income per share 1.67 1.44
(diluted)
<
Net shares outstanding 672.1 703.2 During the first quarter of 2005, Allstate purchased 13.4 million shares of its
stock for $706 million.
Weighted average shares 683.1 709.2
outstanding (diluted)
<
Return on equity 15.6 15.1 See the return on equity calculation in the Definitions of Non-GAAP and
Operating Measures section of this document.
<
Operating income return on 17.2 18.0 See the return on equity calculation in the Definitions of Non-GAAP and
equity Operating Measures section of this document.
<
Book value per diluted share 31.48 30.48 At March 31, 2005 and 2004, net unrealized gains on fixed income
securities, after-tax, totaling $1,385 and $2,611, respectively, represented
$2.05 and $3.69, respectively, of book value per diluted share.
• Book value per diluted share increased 3.3% compared to March 31, 2004. Book value per diluted share
excluding the net impact of unrealized net capital gains on fixed income securities1 was $29.44 at March
31, 2005, reflecting increases of 9.9% and 2.9% compared to March 31, 2004 and December 31, 2004,
respectively.
3
4. Property-Liability Highlights
Three Months Ended Discussion of Results for the
March 31, Three Months Ended March 31, 2005
($ in millions, except ratios) Est.
2005 2004
<
Property-Liability net $6,582 $6,333 See the Property-Liability Premiums Written by Market Segment table.
premiums written
<
Property-Liability revenues 7,233 6,986 Premiums earned increased $313 or 4.9%, partially offset by lower
realized net capital gains.
<
Underwriting income / (loss) 981 865 Higher premiums earned and continued favorable auto and
homeowners loss frequencies. See the Allstate Protection Market
Segment Analysis table.
<
Net investment income 436 424 Higher portfolio balances due to positive cash flows from operations,
partially offset by lower yields.
<
Operating income 1,019 912 Increase of $75 in underwriting results, after-tax and a reduction of
$27 of prior year tax liabilities.
<
Realized capital gains and 78 132 See the Components of Realized Capital Gains and Losses (pretax)
losses, after-tax table.
<
Net income 1,097 1,044 Higher operating income. See discussion of Exposure to Potential
Subsequent Event for Citizens Property Insurance Corporation
Assessment.
Catastrophe losses 164 102
Ratios:
Property-Liability combined ratio 85.3 86.4
Effect of Discontinued Lines and 0.1 0.1
Coverages
Allstate Protection combined ratio 85.2 86.3
Effect of catastrophe losses 2.5 1.6
• Allstate brand standard auto and homeowners PIF increased 4.9% and 6.0%, respectively, from March
31, 2004 levels, compared to increases of 5.5% and 6.4%, respectively in the fourth quarter of 2004 over
the fourth quarter of 2003. Both standard auto and homeowners experienced PIF growth in most states.
These results exclude impacts from Allstate Canada.
• Allstate brand standard auto and homeowners retention ratio, excluding the impacts of Allstate Canada,
increased to 90.7 and 88.5, respectively, from 90.4 and 87.8 in the prior year first quarter.
• Allstate brand standard auto and homeowners new business premiums declined 2.3% and 3.5%,
respectively, as compared to the first quarter of 2004, primarily due to declines in certain markets from
competitive pressures due to risk selection and pricing strategies. We are experiencing a decline of
standard auto new business due to new entrants in a major market. In homeowners, we are curtailing our
writings of new business in some markets due to catastrophe exposure management. We will continue
our disciplined risk and pricing approach, seeking profitable growth on a market-by-market basis. These
results exclude impacts from Allstate Canada.
4
5. Allstate Financial Highlights
Three Months Ended Discussion of Results for the
March 31, Three Months Ended March 31, 2005
($ in millions) Est.
2005 2004
<
Premiums and deposits $3,979 $3,455 See the Allstate Financial Premiums and Deposits table.
<
Allstate Financial 1,440 1,294 Higher investment income, life and annuity premiums and contract
revenues charges and realized net capital gains.
<
Operating income 149 132 Higher gross margins and lower income taxes due to a reduction of $14 of
prior years tax liabilities, partially offset by higher non-deferred expenses,
DAC and DSI unlocking of $7 and an increase in variable annuity reserves
of $9.
<
Realized capital gains and 1 (14) See the Components of Realized Capital Gains and Losses (pretax) table.
losses, after-tax
<
DAC and DSI amortization (61) (10) Amortization related to certain realized capital gains.
relating to realized capital
gains and losses, after-tax
<
Non-recurring increase in (22) -- Increase in liability for future benefits for a discontinued benefit plan.
liability for future benefits,
after-tax
<
Cumulative effect of change in -- (175) Adoption of AICPA SOP 03-1, “Accounting and Reporting by Insurance
accounting principle, after-tax Enterprises for Certain Nontraditional Long-Duration Contracts and for
Separate Accounts” in the first quarter of 2004.
<
Net income 53 (73) Cumulative effect of change in accounting principle, after-tax in 2004,
higher operating income, higher realized net capital gains, after-tax,
partially offset by DAC and DSI amortization related to these capital gains.
• Investments including Separate Account assets as of March 31, 2005 increased 10.0% over March 31,
2004 primarily due to strong sales of fixed annuities and funding agreements.
• As of March 31, 2005, 77% of our interest-sensitive life and fixed annuity contracts, excluding market
value adjusted annuities, have a guaranteed crediting rate of 3% or higher. Of these contracts, 76% have
crediting rates that are at the minimum as of March 31, 2005. For all interest-sensitive life and fixed
annuity contracts, excluding market value adjusted annuities, the approximate difference between the
weighted average crediting rate and the average guaranteed crediting rate is 51 basis points as of March
31, 2005 compared to 52 basis points as of December 31, 2004.
• In the first quarter of 2005, we performed our annual comprehensive evaluation of the assumptions used
in our valuation models for all investment products, including variable and fixed annuities and interest-
sensitive and variable life products. This evaluation resulted in a net reduction of operating income of $16
million pre-tax, primarily consisting of the following adjustments:
• Deferred acquisition costs (“DAC”) and deferred sales inducements (“DSI”) unlocking adjustment of
$7 million. The DAC and DSI unlocking includes amortization acceleration on fixed annuities of $62
million and $3 million on interest-sensitive and variable life products, partially offset by amortization
deceleration on variable annuities of $58 million. The amortization acceleration on fixed annuities
was primarily due to higher than expected lapses on market value adjusted annuities during the 30-45
day window in which there were no surrender charges or market value adjustments, and faster than
anticipated portfolio yield declines. The amortization deceleration on variable annuities was mostly
attributable to better than anticipated equity market performance and persistency.
• The reserves for guarantees related to variable contracts were increased $9 million due primarily to a
refined measurement of exposure, partially offset by better than anticipated equity market
performance.
• In the first quarter of 2004, the comparable DAC and DSI unlocking was a net acceleration of
amortization of $0.5 million, which included deceleration of amortization related to interest-sensitive
life and acceleration of amortization related to fixed annuities. There was no comparable adjustment
to reserves for variable contract guarantees, because the reserves were established in the first
quarter of 2004 as part of the cumulative effect of the change in accounting for such guarantees.
5
6. THE ALLSTATE CORPORATION
CONSOLIDATED STATEMENTS OF OPERATIONS
Three Months Ended
March 31,
Est. Percent
($ in millions, except per share data) 2005 2004 Change
Revenues
Property-liability insurance premiums $ 6,684 $ 6,371 4.9
Life and annuity premiums
and contract charges 521 496 5.0
Net investment income 1,384 1,274 8.6
Realized capital gains and losses 116 170 (31.8)
Total revenues 8,705 8,311 4.7
Costs and expenses
Property-liability insurance
claims and claims expense 4,063 3,986 1.9
Life and annuity contract benefits 411 395 4.1
Interest credited to contractholder funds 591 470 25.7
Amortization of deferred policy
acquisition costs 1,196 1,055 13.4
Operating costs and expenses 800 733 9.1
Restructuring and related charges 18 11 63.6
Interest expense 84 74 13.5
Total costs and expenses 7,163 6,724 6.5
Loss on disposition of operations (4) (3) (33.3)
Income from operations before income
tax expense and cumulative effect of change
in accounting principle, after-tax 1,538 1,584 (2.9)
Income tax expense 415 460 (9.8)
Income before cumulative effect of change
in accounting principle, after-tax 1,123 1,124 (0.1)
Cumulative effect of change in accounting
principle, after-tax - (175) 100.0
Net income $ 1,123 $ 949 18.3
Net income per share - Basic $ 1.66 $ 1.35
Weighted average shares - Basic 677.7 704.5
Net income per share - Diluted $ 1.64 $ 1.34
Weighted average shares - Diluted 683.1 709.2
6
7. THE ALLSTATE CORPORATION
CONTRIBUTION TO INCOME
Three Months Ended
March 31,
Est. Percent
($ in millions, except per share data) 2005 2004 Change
Contribution to income
Operating income before the impact of
restructuring and related charges $ 1,152 $ 1,027 12.2
Restructuring and related charges,
after-tax 12 7 71.4
Operating income 1,140 1,020 11.8
Realized capital gains and losses, after-tax 80 120 (33.3)
DAC and DSI amortization relating to realized capital
gains and losses, after-tax (61) (10) -
Non-recurring increase in liability for future benefits,
after-tax (1) (22) - -
Reclassification of periodic settlements
and accruals on non-hedge derivative
instruments, after-tax (12) (4) -
Loss on disposition of operations, after-tax (2) (2) -
Cumulative effect of change in accounting
principle, after-tax - (175) 100.0
Net income $ 1,123 $ 949 18.3
Income per share (Diluted)
Operating income before the impact of
restructuring and related charges $ 1.69 $ 1.45 16.6
Restructuring and related charges,
after-tax 0.02 0.01 100.0
Operating income 1.67 1.44 16.0
Realized capital gains and losses, after-tax 0.12 0.17 (29.4)
DAC and DSI amortization relating to realized capital
gains and losses, after-tax (0.09) (0.01) -
Non-recurring increase in liability for future benefits,
after-tax (1) (0.03) - -
Reclassification of periodic settlements
and accruals on non-hedge derivative
instruments, after-tax (0.02) (0.01) (100.0)
Loss on disposition of operations, after-tax (0.01) - -
Cumulative effect of change in accounting
principle, after-tax - (0.25) 100.0
Net income $ 1.64 $ 1.34 22.4
Book value per share - Diluted $ 31.48 $ 30.48 3.3
(1) The non-recurring increase in liability for future benefits is for a discontinued benefit plan.
7
8. THE ALLSTATE CORPORATION
COMPONENTS OF REALIZED CAPITAL GAINS AND LOSSES (PRETAX)
Three Months Ended March 31, 2005 (Est.)
($ in millions) Property- Allstate Corporate
Liability Financial and Other Total
Valuation of derivative instruments $ (13) $ (58) $ - $ (71)
Settlements of derivative instruments 10 26 - 36
Dispositions 196 70 2 268
Write-downs (10) (7) - (17)
Anticipated disposition write-downs (1) (70) (30) - (100)
Total $ 113 $ 1 $ 2 $ 116
Three Months Ended March 31, 2004
($ in millions) Property- Allstate Corporate
Liability Financial and Other Total
Valuation of derivative instruments $ (11) $ (16) $ (1) $ (28)
Settlements of derivative instruments (11) (8) (1) (20)
Dispositions 220 36 4 260
Write-downs (7) (35) - (42)
Total $ 191 $ (23) $ 2 $ 170
(1) Because of rising interest rates, continued asset-liability management strategies and on-going comprehensive
reviews of our portfolios, changes were made in the first quarter to our strategic asset allocations, and our
view of duration for our Property-Liability portfolio. We also pursued yield enhancement strategies for the
Allstate Financial portfolio. These changes primarily resulted in anticipated disposition write-downs of certain
securities with unrealized loss positions due to a change in intent to hold these securities until recovery.
8
9. THE ALLSTATE CORPORATION
SEGMENT RESULTS
Three Months Ended
March 31,
($ in millions) Est.
2005 2004
Property-Liability
Premiums written $ 6,582 $ 6,333
Premiums earned $ 6,684 $ 6,371
Claims and claims expense 4,063 3,986
Amortization of deferred policy acquisition costs 1,012 924
Operating costs and expenses 610 585
Restructuring and related charges 18 11
Underwriting income 981 865
Net investment income 436 424
Income tax expense on operations 398 377
Operating income 1,019 912
Realized capital gains and losses, after-tax 78 132
Net income $ 1,097 $ 1,044
Catastrophe losses $ 164 $ 102
Operating ratios
Claims and claims expense ratio 60.8 62.6
Expense ratio 24.5 23.8
Combined ratio 85.3 86.4
Effect of catastrophe losses on combined ratio 2.5 1.6
Effect of restructuring and related charges on combined ratio 0.3 0.2
Effect of Discontinued Lines and Coverages on combined ratio 0.1 0.1
Allstate Financial
Premiums and deposits $ 3,979 $ 3,455
Investments including Separate Accounts assets $ 88,105 $ 80,122
Premiums and contract charges $ 521 $ 496
Net investment income 918 821
Periodic settlements and accruals on non-hedge derivative instruments 19 6
Contract benefits 411 395
Interest credited to contractholder funds 566 469
Amortization of deferred policy acquisition costs 115 117
Operating costs and expenses 160 145
Income tax expense on operations 57 65
Operating income 149 132
Realized capital gains and losses, after-tax 1 (14)
DAC and DSI amortization relating to realized capital gains and losses, after-tax (61) (10)
Non-recurring increase in liability for future benefits, after-tax (1) (22) -
Reclassification of periodic settlements and accruals on non-hedge
derivative instruments, after-tax (12) (4)
Loss on disposition of operations, after-tax (2) (2)
Cumulative effect of change in accounting principle, after-tax - (175)
Net income (loss) $ 53 $ (73)
Corporate and Other
Net investment income $ 30 $ 29
Operating costs and expenses 86 77
Income tax benefit on operations (28) (24)
Operating loss (28) (24)
Realized capital gains and losses, after-tax 1 2
Net loss $ (27) $ (22)
Consolidated net income $ 1,123 $ 949
(1) The non-recurring increase in liability for future benefits is for a discontinued benefit plan.
9
10. THE ALLSTATE CORPORATION
UNDERWRITING RESULTS BY AREA OF BUSINESS
Three Months Ended
March 31,
Est. Percent
($ in millions) 2005 2004 Change
Consolidated Underwriting Summary
Allstate Protection $ 990 $ 870 13.8
Discontinued Lines and Coverages (9) (5) (80.0)
Underwriting income $ 981 $ 865 13.4
Allstate Protection Underwriting Summary
Premiums written $ 6,581 $ 6,332 3.9
Premiums earned $ 6,682 $ 6,370 4.9
Claims and claims expense 4,055 3,982 1.8
Amortization of deferred policy acquisition costs 1,012 924 9.5
Operating costs and expenses 607 583 4.1
Restructuring and related charges 18 11 63.6
Underwriting income $ 990 $ 870 13.8
Catastrophe losses $ 164 $ 102 60.8
Operating ratios
Claims and claims expense ratio 60.7 62.5
Expense ratio 24.5 23.8
Combined ratio 85.2 86.3
Effect of catastrophe losses
on combined ratio 2.5 1.6
Effect of restructuring and related
charges on combined ratio 0.3 0.2
Discontinued Lines and Coverages
Underwriting Summary
Premiums written $ 1 $ 1 -
Premiums earned $ 2 $ 1 100.0
Claims and claims expense 8 4 100.0
Operating costs and expenses 3 2 50.0
Underwriting loss $ (9) $ (5) (80.0)
Effect of Discontinued Lines and Coverages
on the Property-Liability combined ratio 0.1 0.1
10
11. THE ALLSTATE CORPORATION
PROPERTY-LIABILITY PREMIUMS WRITTEN BY MARKET SEGMENT
Three Months Ended
March 31,
Est. Percent
($ in millions) 2005 2004 Change
Allstate brand
Standard auto $ 3,798 $ 3,607 5.3
Non-standard auto 426 473 (9.9)
Auto 4,224 4,080 3.5
Involuntary auto 53 60 (11.7)
Commercial lines 233 229 1.7
Homeowners 1,258 1,161 8.4
Other personal lines 324 324 -
6,092 5,854 4.1
Encompass brand
Standard auto 282 280 0.7
Non-standard auto (Deerbrook) 32 43 (25.6)
Auto 314 323 (2.8)
Involuntary auto 12 12 -
Homeowners 135 119 13.4
Other personal lines 28 24 16.7
489 478 2.3
Allstate Protection (1) 6,581 6,332 3.9
Discontinued Lines
and Coverages 1 1 -
Property-Liability (1) $ 6,582 $ 6,333 3.9
Allstate Protection
Standard auto $ 4,080 $ 3,887 5.0
Non-standard auto 458 516 (11.2)
Auto 4,538 4,403 3.1
Involuntary auto 65 72 (9.7)
Commercial lines 233 229 1.7
Homeowners 1,393 1,280 8.8
Other personal lines 352 348 1.1
$ 6,581 $ 6,332 3.9
(1) In the first quarter of 2005, growth in premiums written was negatively impacted by
accruals for premium refunds and reinsurance transactions totaling 0.3%.
11
12. THE ALLSTATE CORPORATION
PROPERTY-LIABILITY NET RATE CHANGES APPROVED (1)
Three Months Ended
March 31, 2005 (Est.)
Annual Impact
of Rate Changes on
Number of Weighted Average State Specific
States Rate Change (%) (2) Premiums Written (%) (3)
Allstate brand
Standard auto 7 0.1 2.7
Non-standard auto 1 0.0 4.6
Homeowners 6 0.3 4.8
Encompass brand
Standard auto 10 0.1 0.3
Homeowners 6 0.4 4.0
(1) Rate increases that are indicated based on a loss trend analysis to achieve a targeted return, will continue
to be pursued in all locations and for all products.
(2) Represents the impact in the states where rate changes were approved during the first quarter of 2005 as
a percentage of total countrywide year-end premiums written.
(3) Represents the impact in the states where rate changes were approved during the first quarter of 2005 as
a percentage of total year-end premiums written in those states.
12
13. THE ALLSTATE CORPORATION
ALLSTATE PROTECTION MARKET SEGMENT ANALYSIS
Three Months Ended March 31,
($ in millions) Est. 2005 2004 Est. 2005 2004 Est. 2005 2004 Est. 2005 2004
Effect of
Catastrophe Losses
Premiums Earned Loss Ratio on the Loss Ratio Expense Ratio
Allstate brand
Standard auto $ 3,691 $ 3,486 64.8 66.8 0.7 (0.4) 24.3 23.6
Non-standard auto 425 474 62.6 62.4 0.5 0.2 20.9 19.7
Auto 4,116 3,960 64.5 66.3 0.6 (0.3) 24.0 23.1
Homeowners 1,425 1,300 49.8 48.6 7.9 7.2 22.9 22.6
Other (1) 629 604 58.7 63.1 2.1 2.2 25.9 26.8
Total Allstate brand 6,170 5,864 60.6 62.0 2.5 1.5 23.9 23.4
Encompass brand
Standard auto 301 300 63.8 68.7 0.3 - 32.5 29.3
Non-standard auto (Deerbrook) 34 43 76.5 79.1 - - 29.4 27.9
Auto 335 343 65.1 70.0 0.3 - 32.2 29.1
Homeowners 139 128 54.0 57.8 5.8 6.2 30.9 30.5
Other (1) 38 35 68.4 85.7 5.2 2.8 29.0 28.6
Total Encompass brand 512 506 62.3 68.0 2.1 1.8 31.6 29.4
Allstate Protection $ 6,682 $ 6,370 60.7 62.5 2.5 1.6 24.5 23.8
(1) Other includes involuntary auto, commercial lines and other personal lines.
13
14. THE ALLSTATE CORPORATION
PROPERTY-LIABILITY
EFFECT OF PRETAX PRIOR YEAR RESERVE REESTIMATES ON THE COMBINED RATIO
Three Months Ended March 31,
Effect of Pretax Reserve
Pretax Re-estimates on the
Reserve Re-estimates (1) Combined Ratio
Est. Est.
($ in millions) 2005 2004 2005 2004
Auto $ (93) $ (47) (1.4) (0.7)
Homeowners 11 (2) 0.2 -
Other (6) (3) (0.1) (0.1)
Allstate Protection (88) (52) (1.3) (0.8)
Discontinued Lines and Coverages 8 4 0.1 0.1
Property-Liability $ (80) $ (48) (1.2) (0.7)
Allstate brand $ (87) $ (52) (1.3) (0.8)
Encompass brand (1) - - -
Allstate Protection $ (88) $ (52) (1.3) (0.8)
(1) Favorable reserve reestimates are shown in parentheses.
14
15. THE ALLSTATE CORPORATION
ALLSTATE FINANCIAL PREMIUMS AND DEPOSITS
Three Months Ended
March 31,
Est. Percent
($ in millions) 2005 2004 Change
Life Products (1)
Interest-sensitive life $ 359 $ 362 (0.8)
Traditional 72 82 (12.2)
Other 103 81 27.2
534 525 1.7
Annuities
Fixed annuities - deferred 1,525 1,084 40.7
Fixed annuities - immediate 294 206 42.7
Variable annuities 404 451 (10.4)
2,223 1,741 27.7
Institutional Products
Indexed funding agreements - 1 (100.0)
Funding agreements backing medium-term notes 1,098 1,100 (0.2)
1,098 1,101 (0.3)
Bank Deposits 124 88 40.9
Total $ 3,979 $ 3,455 15.2
(1) To conform to current period presentations, certain prior period balances have been reclassified.
15
16. THE ALLSTATE CORPORATION
CONSOLIDATED STATEMENTS OF FINANCIAL POSITION
March 31, December 31,
($ in millions, except par value data) 2005 (Est.) 2004
Assets
Investments
Fixed income securities, at fair value
(amortized cost $93,024 and $90,657) $ 96,695 $ 95,715
Equity securities, at fair value (cost $4,618 and $4,566) 5,749 5,895
Mortgage loans 8,161 7,856
Short-term 4,427 4,133
Other 1,851 1,931
Total investments 116,883 115,530
Cash 339 414
Premium installment receivables, net 4,810 4,721
Deferred policy acquisition costs 5,375 4,968
Reinsurance recoverables, net 4,307 4,323
Accrued investment income 1,093 1,014
Property and equipment, net 1,013 1,018
Goodwill 825 825
Other assets 2,734 2,535
Separate Accounts 14,087 14,377
Total assets $ 151,466 $ 149,725
Liabilities
Reserve for property-liability insurance
claims and claims expense $ 18,958 $ 19,338
Reserve for life-contingent contract benefits 12,131 11,754
Contractholder funds 57,494 55,709
Unearned premiums 9,810 9,932
Claim payments outstanding 718 787
Other liabilities and accrued expenses 11,332 9,842
Deferred income taxes 256 829
Short-term debt 75 43
Long-term debt 5,280 5,291
Separate Accounts 14,087 14,377
Total liabilities 130,141 127,902
Shareholders' equity
Preferred stock, $1 par value, 25 million
shares authorized, none issued - -
Common stock, $.01 par value, 2.0 billion shares
authorized and 900 million issued, 672 million
and 683 million shares outstanding 9 9
Additional capital paid-in 2,763 2,685
Retained income 24,950 24,043
Deferred compensation expense (152) (157)
Treasury stock, at cost (228 million and 217 million shares) (7,980) (7,372)
Accumulated other comprehensive income:
Unrealized net capital gains and losses 2,111 2,988
Unrealized foreign currency translation adjustments 13 16
Minimum pension liability adjustment (389) (389)
Total accumulated other comprehensive income 1,735 2,615
Total shareholders' equity 21,325 21,823
Total liabilities and shareholders' equity $ 151,466 $ 149,725
16
17. Homeowners Catastrophe Management Strategy
Our overarching intent is to support the continued strong growth of our homeowners business in a profitable
and prudent fashion. While in many areas of the country we are currently achieving acceptable returns within
acceptable risk management tolerances, our aim is to find solutions that support continued presence in all
catastrophe prone markets. As part of our continued commitment to effective management of our capital,
returns and risk profile, Allstate is in the early stages of introducing integrated enterprise risk management
(“ERM”) capabilities. A principal ERM goal is to further increase our return on equity by reducing our
exposure to catastrophe losses, and thereby lessen our earnings volatility and our capital requirements. In
these early stages of introducing integrated ERM capabilities, we are considering and adopting new
performance measurements for managing our property business. These measurements include establishing
limits on exposure to hurricane and earthquake losses with a probability of one percent on an annual
aggregate basis, developing acceptable targeted rates of return by line and by state to determine acceptable
premium growth, and evaluating potential capital impairment measurements.
Potential actions resulting from further evaluation of these measurements may limit our catastrophe risk
and/or improve returns through increased purchases of reinsurance and changes in rates and deductibles;
limitations on new business writings; pursuit of alternative markets for placement of business in certain areas;
and/or non-renewal or withdrawal from certain markets. At the same time, we will continue to pursue public
policy solutions for catastrophes. We are currently actively engaged in activity in each of these areas. For
example, for 2005 we expect to increase our purchase of reinsurance to reduce the risk of catastrophe losses
in:
• Florida, where we expect to reinsure approximately $1.0 billion of capacity estimated in excess of
those losses covered by the Florida Hurricane Catastrophe Fund;
• New York, where we expect to reinsure $1 billion of capacity in excess of a retention of $750 million
of loss;
• New Jersey, Connecticut, Texas, North Carolina and South Carolina.
The annualized cost of the multi-year program, which is expected to be effective from June 1, is anticipated to
be approximately $190 million, some $100 million higher than the annualized cost of the 2004 reinsurance
program, with the largest portion of the increase attributable to Florida and New York.
While we believe our actions will, over time, achieve our objectives of supporting continued growth in the
homeowners business in a profitable, prudent manner, it is possible that they will impact near-term growth
and earnings.
17
18. Exposure to Potential Subsequent Event for Citizens Property Insurance Corporation Assessment
Allstate Floridian Insurance Company and its subsidiaries are subject to assessments from Citizens Property
Insurance Corporation (“Citizens”), which was created by the state of Florida to provide insurance to property
owners unable to obtain coverage in the private insurance market. Citizens, at the discretion and direction of
its Board of Directors (“Citizens Board”), can levy a regular assessment on participating companies for a
deficit in any calendar year up to the greater of 10% of the deficit or 10% of Florida property premiums
industry-wide for the prior year. An insurer may recoup a regular assessment through a surcharge to
policyholders. In order to recoup its Citizens regular assessment, an insurer must file for a policy surcharge
with the Florida Department of Insurance at least fifteen days prior to imposing the surcharge on policies. If a
deficit remains after the regular assessment, Citizens can also fund the remaining deficit by issuing bonds.
The costs of these bonds are then funded through emergency assessments in subsequent years. Companies
are required to collect the emergency assessments directly from residential property policyholders and remit
them to Citizens as they are collected. Participating companies are obligated to purchase any unsold bonds
issued by Citizens.
Citizens is designed so that the ultimate cost is borne by policyholders, however the exposure to
assessments and the availability of recoupments may not offset each other. Moreover, even if they do offset
each other, they may not offset each other in the same fiscal period’s financial statements. This would be
due to the ultimate timing of the assessments and recoupments, as well as the possibility of policies not being
renewed in subsequent years.
Citizens is expected to report higher losses from the hurricanes that struck Florida in the third quarter of 2004
and a deficit for the 2004 plan year. The Citizens Board met on March 30; however, they took no action to
declare a deficit or levy an assessment. Instead, they deferred making a decision until the completion of the
external audit by Ernst & Young LLP, which was to have been completed by April 15, and until a
determination is made as to whether any appropriations are going to be received from the state of Florida. In
its legislative session scheduled to end May 6, the state of Florida is expected to consider if an appropriation
will be made to offset or eliminate the deficit and the need for an assessment, and therefore, any potential
appropriation is not estimable.
As a result of the timing of these potential decisions, we are not in a position to estimate or accrue a potential
assessment from Citizens. The Citizens Board will meet again on April 21 at which time a decision may be
made. The agenda for the April 21 meeting indicates that Citizens officers will recommend to the Citizens
Board that the audited financial statements be accepted, but that no action be taken on the deficit disclosed
by those statements, until such time as the legislature has taken action or has failed to take action by May 6.
Based on currently available information regarding the amount of the estimated deficiency and our market
share, we believe that our maximum exposure to a regular assessment is $45 million pre-tax, which would be
recorded as a catastrophe loss when approved by the Citizens Board. This assessment would then be
recouped through subsequent billing to insureds in addition to their premium. These recoupments will be
reportable in our financial results as they are billed.
The table below presents the estimated maximum impact of a regular assessment on the financial
statements.
(in millions, except per share amounts and ratios)
Catastrophe losses $45
Effect on combined ratio 0.7 pts
Net income $29
Net income per diluted share $0.04
If the Citizens Board declares the assessment before May 3, our anticipated Form 10-Q filing date, our results
will be adjusted for our best estimate at that time. Otherwise the impact of this assessment will be included in
our results when estimable.
18
19. Definitions of GAAP Operating Ratios
Claims and claims expense (“loss”) ratio is the ratio of claims and claims expense to premiums earned.
Loss ratios include the impact of catastrophe losses.
Expense ratio is the ratio of amortization of DAC, operating costs and expenses and restructuring and
related charges to premiums earned.
Combined Ratio is the ratio of claims and claims expense, amortization of DAC, operating costs and expenses
and restructuring and related charges to premiums earned. The difference between 100% and the combined
ratio represents underwriting income as a percentage of premiums earned.
Effect of Discontinued Lines and Coverages on combined ratio is the ratio of claims and claims expense
and other costs and expenses in the Discontinued Lines and Coverages segment to Property-Liability
premiums earned. The sum of the effect of Discontinued Lines and Coverages on the combined ratio and the
Allstate Protection combined ratio is equal to the Property-Liability combined ratio.
Effect of catastrophe losses on loss ratio is the percentage of catastrophe losses included in claims and
claims expenses to premiums earned.
Effect of restructuring and related charges on expense ratio is the percentage of restructuring and
related charges to premiums earned.
Definitions of Non-GAAP and Operating Measures
We believe that investors’ understanding of Allstate’s performance is enhanced by our disclosure of the
following non-GAAP financial measures. Our methods of calculating these measures may differ from those
used by other companies and therefore comparability may be limited.
Operating income is income before cumulative effect of change in accounting principle, after-tax, excluding:
• realized capital gains and losses, after-tax, except for periodic settlements and accruals on non-hedge
derivative instruments which are reported with realized capital gains and losses but included in operating
income,
• amortization of deferred policy acquisition costs (“DAC”) and deferred sales inducements (“DSI”), to the
extent they resulted from the recognition of certain realized capital gains and losses,
• (loss) gain on disposition of operations, after-tax, and
• adjustments for other significant non-recurring, infrequent or unusual items, when (a) the nature of the
charge or gain is such that it is reasonably unlikely to recur within two years, or (b) there has been no similar
charge or gain within the prior two years.
Net income is the GAAP measure that is most directly comparable to operating income.
We use operating income to evaluate our results of operations. It reveals trends in our insurance and
financial services business that may be obscured by the net effect of realized capital gains and losses, (loss)
gain on disposition of operations and adjustments for other significant non-recurring infrequent or unusual
items. Realized capital gains and losses and (loss) gain on disposition of operations may vary significantly
between periods and are generally driven by business decisions and economic developments such as market
conditions, the timing of which is unrelated to the insurance underwriting process. Moreover, we reclassify
periodic settlements on non-hedge derivative instruments into operating income to report them in a manner
consistent with the economically hedged investments, replicated assets or product attributes (e.g. net
investment income and interest credited to contractholder funds) and by doing so, appropriately reflect trends
in product performance. Non-recurring items are excluded because, by their nature, they are not indicative of
our business or economic trends. Therefore, we believe it is useful for investors to evaluate these
components separately and in the aggregate when reviewing our performance. We note that the price to
earnings multiple commonly used by insurance investors as a forward-looking valuation technique uses
operating income as the denominator. We use adjusted measures of operating income and operating income
per diluted share in incentive compensation. Operating income should not be considered as a substitute for
net income and does not reflect the overall profitability of our business.
19
20. The following table reconciles operating income and net income for the three months ended March 31, 2005
and 2004.
For the three months ended March 31, Property-Liability Allstate Financial Consolidated Per diluted share
Est. Est. Est. Est.
2005 2005 2005 2005
($ in millions, except per share data) 2004 2004 2004 2004
Operating income $ 1,019 $ 912 $ 149 $ 132 $ 1,140 $ 1,020 $ 1.67 $ 1.44
Realized capital gains and losses 113 191 1 (23) 116 170
Income tax benefit (expense) (35) (59) - 9 (36) (50)
Realized capital gains and losses, 78 132 1 (14) 80 120 0.12 0.17
after-tax
DAC and DSI amortization relating to
realized capital gains and losses,
after-tax - - (61) (10) (61) (10) (0.09) (0.01)
Non-recurring increase in liability for
future benefits - - (22) - (22) - (0.03) -
Reclassification of periodic
settlements and accruals on non-hedge
derivative instruments, after-tax - - (12) (4) (12) (4) (0.02) (0.01)
Loss on disposition of operations,
after-tax - - (2) (2) (2) (2) (0.01) -
Income before cumulative effect of change
in accounting principle, after-tax 1,097 1,044 53 102 1,123 1,124 1.64 1.59
Cumulative effect of change in accounting
principle, after-tax - - - (175) - (175) - (0.25)
Net income (loss) $ 1,097 $ 1,044 $ 53 $ (73) $ 1,123 $ 949 $ 1.64 $ 1.34
In this press release, we provide guidance on operating income per diluted share for 2005 (assuming a level
of average expected catastrophe losses used in pricing for the remainder of the year). A reconciliation of this
measure to net income is not possible on a forward-looking basis because it is not possible to provide a
reliable forecast of realized capital gains and losses including periodic settlements and accruals on non-
hedge derivative instruments, which can vary substantially from one period to another and may have a
significant impact on net income. Because a forecast of realized capital gains and losses is not possible,
neither is a forecast of the effects of amortization of DAC and DSI on realized capital gains and losses nor
income taxes. The other reconciling items between operating income and net income on a forward-looking
basis are a non-recurring increase in liability for future benefits, after-tax, loss on disposition of operations,
after-tax, and cumulative effect of changes in accounting principle, after-tax, which we assume to be zero for
the remainder of the year.
Underwriting income (loss) is calculated as premiums earned, less claims and claims expense (“losses”),
amortization of DAC, operating costs and expenses and restructuring and related charges as determined
using GAAP. Management uses this measure in its evaluation of results of operations to analyze the
profitability of our Property-Liability insurance operations separately from investment results. It is also an
integral component of incentive compensation. It is useful for investors to evaluate the components of income
separately and in the aggregate when reviewing performance. Net income is the most directly comparable
GAAP measure. Underwriting income (loss) should not be considered as a substitute for net income and does
not reflect the overall profitability of our business. A reconciliation of Property-Liability underwriting income to
net income is provided in the Segment Results table.
20
21. Operating income return on equity is a ratio that uses a non-GAAP measure. It is calculated by dividing the
rolling 12-month operating income by the average of shareholders’ equity at the beginning and at the end of
the 12-month period, after excluding the after-tax effect of unrealized net capital gains. We use it to
supplement our evaluation of net income and return on equity. We believe that this measure is useful to
investors because it eliminates the effect of items that can fluctuate significantly from period to period and that
are driven by developments, the magnitude and timing of which are generally not influenced by management:
the after-tax effects of realized and unrealized capital gains and losses and the cumulative effect of change in
accounting principle, and non-recurring items that are not indicative of our business or economic trends.
Return on equity is the most directly comparable GAAP measure. The following table shows the
reconciliation.
For the twelve months ended
($ in millions) March 31,
Est. 2005 2004
Return on equity
Numerator:
Net income $ 3,355 $ 2,989
Denominator:
Beginning shareholders' equity 21,580 17,983
Ending shareholders' equity 21,325 21,580
Average shareholders' equity $ 21,453 $ 19,782
ROE 15.6% 15.1%
For the twelve months ended
($ in millions) March 31,
Est. 2005 2004
Operating income return on equity
Numerator:
Operating income $ 3,211 $ 3,009
Denominator:
Beginning shareholders' equity 21,580 17,983
Unrealized net capital gains 3,428 2,646
Adjusted beginning shareholders' equity 18,152 15,337
Ending shareholders' equity 21,325 21,580
Unrealized net capital gains 2,111 3,428
Adjusted ending shareholders' equity 19,214 18,152
Average shareholders' equity $ 18,683 $ 16,745
ROE 17.2% 18.0%
Book value per diluted share excluding the net impact of unrealized net capital gains on fixed income
securities is a ratio that uses a non-GAAP measure. It is calculated by dividing shareholders’ equity after
excluding the net impact of unrealized net capital gains on fixed income securities and related DAC and life
insurance reserves by total shares outstanding plus dilutive potential shares outstanding. Book value per
diluted share is the most directly comparable GAAP ratio.
We use the trend in book value per diluted share excluding unrealized net capital gains on fixed income
securities in conjunction with book value per diluted share to identify and analyze the change in net worth
attributable to management efforts between periods. We believe the non-GAAP ratio is useful to investors
because it eliminates the effect of items that can fluctuate significantly from period to period and are generally
driven by economic developments, primarily market conditions, the magnitude and timing of which are not
influenced by management, and we believe it enhances understanding and comparability of performance by
highlighting underlying business activity and profitability drivers. We note that book value per diluted share
excluding unrealized net capital gains on fixed income securities is a measure commonly used by insurance
investors as a valuation technique. Book value per diluted share excluding unrealized net capital gains on
fixed income securities should not be considered as a substitute for book value per diluted share and does
not reflect the recorded net worth of our business. The following table shows the reconciliation:
21
22. As of
(in millions, except per share data) March 31,
Est.
2005 2004
Book value per diluted share
Numerator:
Shareholders' equity $ 21,325 $ 21,580
Denominator:
Shares outstanding and dilutive potential shares outstanding 677.4 707.9
Book value per diluted share $ 31.48 $ 30.48
Book value per diluted share, excluding the net impact of unrealized
net capital gains on fixed income securities
Numerator:
Shareholders' equity $ 21,325 $ 21,580
Unrealized net capital gains on fixed income securities 1,385 2,611
Adjusted shareholders' equity $ 19,940 $ 18,969
Denominator:
Shares outstanding and dilutive potential shares outstanding 677.4 707.9
Book value per diluted share, excluding the net impact of unrealized net
capital gains on fixed income securities $ 29.44 $ 26.80
Gross margin represents life and annuity premiums and contract charges and net investment income, less
contract benefits and interest credited to contractholder funds. We use gross margin as a component of our
evaluation of the profitability of Allstate Financial’s life insurance and financial product portfolio. Additionally,
for many of our products, including fixed annuities, variable life and annuities, and interest-sensitive life
insurance, the amortization of DAC and DSI is determined based on actual and expected gross margin.
Gross margin is comprised of three components that are utilized to further analyze the business; they include
the investment margin, benefit margin, and contract charges and fees. We believe gross margin and its
components are useful to investors because they allow for the evaluation of income components separately
and in the aggregate when reviewing performance. Gross margin, investment margin and benefit margin
should not be considered as a substitute for net income and do not reflect the overall profitability of the
business. Net income is the GAAP measure that is most directly comparable to these margins. Gross margin
is reconciled to Allstate Financial’s GAAP net income in the following table.
Three Months Ended
March 31,
Est. 2005
($ in millions) 2004
Life and annuity premiums and contract charges $ 521 $ 496
Net investment income 918 821
Periodic settlements and accruals on non-hedge derivative instruments 19 6
Contract benefits (411) (395)
Interest credited to contractholder funds1 (552) (456)
495 472
Gross margin
Amortization of DAC and DSI (129) (130)
Operating costs and expenses (160) (145)
Income tax expense (57) (65)
Realized capital gains and losses, after-tax 1 (14)
DAC and DSI amortization relating to capital gains and losses, after-tax (61) (10)
Non-recurring increase in liability for future benefits (22) -
Reclassification of periodic settlements and accruals on non-hedge
derivative instruments, after-tax (12) (4)
Loss on disposition of operations, after-tax (2) (2)
Cumulative effect of change in accounting principle, after-tax - (175)
Allstate Financial net income $ 53 $ (73)
1
Amortization of DSI was excluded from interest credited to contractholder funds for purposes of calculating gross margin. Amortization
of DSI totaled $39 million in the first quarter of 2005 and $14 million for the first quarter of 2004.
22
23. Investment margin is a component of gross margin. Investment margin represents the excess of net
investment income over interest credited to contractholder funds and the implied interest on life contingent
immediate annuities included in Allstate Financial’s reserve for life-contingent contract benefits. We use
investment margin to evaluate Allstate Financial’s profitability related to the difference between investment
returns on assets supporting certain products and the amounts credited to customers (“spread”) during a
fiscal period.
Benefit margin is a component of gross margin. Benefit margin represents life and life-contingent immediate
annuity premiums, cost of insurance contract charges and variable annuity fees for contract guarantees less
contract benefits. Benefit margin excludes the implied interest on life-contingent immediate annuities, which
is included in the calculation of investment margin. We use benefit margin to evaluate Allstate Financial’s
underwriting performance, as it reflects the profitability of our products with respect to mortality or morbidity
risk during a fiscal period.
The components of gross margin are reconciled to the corresponding financial statement line items in the
following table.
Three Months Ended March 31,
Investment Benefit Contract Charges Gross
Margin Margin and Fees Margin
Est. Est. Est. Est.
2 2 2
2005 2004 2005 2004 2005 2004 2005
(in millions) 2004
Life and annuity
premiums $ - $ - $ 249 $ 246 $ - $ - $ 249 $ 246
Contract charges - - 152 135 120 115 272 250
Net investment income 918 821 - - - - 918 821
Periodic settlements and
accruals on non-hedge
derivative instruments 19 6 - - - - 19 6
Contract benefits (134) (132) (277) (263) - - (411) (395)
Interest credited to
contractholder funds1 (552) (456) - - - - (552) (456)
$ 251 $ 239 $ 124 $ 118 $ 120 $ 115 $ 495 $ 472
1
Amortization of DSI was excluded from interest credited to contractholder funds for purposes of calculating gross margin. Amortization
of DSI totaled $39 million in the first quarter of 2005 and $14 million in the first quarter of 2004.
2
Prior periods have been restated to conform to current period presentations. In connection therewith, fees related to guaranteed
minimum death and income benefits on variable annuities have been reclassified to benefit margin from maintenance charges.
Additionally, amounts previously presented as maintenance charges and surrender charges are now presented in the aggregate as
contract charges and fees. Further, the Allstate Workplace Division margins were conformed. These reclassifications did not result in
a change in gross margin.
Operating Measures
We believe that investors’ understanding of Allstate’s performance is enhanced by our disclosure of the
following operating financial measures. Our method of calculating these measures may differ from those
used by other companies and therefore comparability may be limited.
23
24. Premiums written is the amount of premiums charged for policies issued during a fiscal period. Premiums
earned is a GAAP measure. Premiums are considered earned and are included in financial results on a pro-rata
basis over the policy period. The portion of premiums written applicable to the unexpired terms of the policies is
recorded as unearned premiums on our Consolidated Statements of Financial Position. A reconciliation of
premiums written to premiums earned is presented in the following table.
Three Months Ended
March 31,
Est.
2005
($ in millions) 2004
Premiums written $ 6,582 $ 6,333
Change in Property-Liability unearned premiums 109 42
Other (7) (4)
Premiums earned $ 6,684 $ 6,371
Premiums and deposits is an operating measure that we use to analyze production trends for Allstate
Financial sales. It includes premiums on insurance policies and annuities and all deposits and other funds
received from customers on deposit-type products including the net new deposits of Allstate Bank, which we
account for under GAAP as increases to liabilities rather than as revenue.
The following table illustrates where premiums and deposits are reflected in the consolidated financial
statements.
Three Months Ended
March 31,
Est.
2005
($ in millions) 2004
Life and annuity premiums1 $ 249 $ 246
Deposits to contractholder funds 3,393 2,856
Deposits to separate accounts 343 367
Change in unearned premiums and other adjustments (6) (14)
Total Premiums and deposits $ 3,979 $ 3,455
1
Life and annuity contract charges in the amount of est. $272 million and $250 million for the three months ended March 31, 2005 and
2004, respectively, which are also revenues recognized for GAAP, have been excluded from the table above, but are a component of
the Consolidated Statements of Operations line item life and annuity premiums and contract charges.
New sales of financial products by Allstate exclusive agencies is an operating measure that we use to
quantify the current year sales of financial products by the Allstate Agency proprietary distribution channel.
New sales of financial products by Allstate exclusive agencies includes annual premiums on new insurance
policies, initial premiums and deposits on annuities, net new deposits in the Allstate Bank, sales of other
companies’ mutual funds, and excludes renewal premiums. New sales of financial products by Allstate
exclusive agencies for the first quarter of 2005 and 2004 totaled $514 million and $491 million, respectively.
Forward Looking Statements
This press release contains forward-looking statements about our operating income for 2005. These
statements are subject to the Private Securities Litigation Reform Act of 1995 and are based on
management’s estimates, assumptions and projections. Actual results may differ materially from those
projected in the forward-looking statements for a variety of reasons:
• Actual levels of PIF may be lower than projected if we are not able to grow or maintain our
retention levels and new business levels due to competitive pressures.
• Loss costs in our Property-Liability business, including losses due to catastrophes such as
hurricanes and earthquakes, may exceed management’s projections. In particular, losses due to
catastrophes may exceed the average expected level used in pricing.
24
25. • If we are unable to obtain regulatory approval of rate increases in a timely manner and at
adequate levels to cover reinsurance costs, we may refrain from writing new homeowners policies
or non-renew homeowners policies in certain markets. In turn, such steps could possibly lead to a
decline in standard auto PIF.
• Claim frequency could be higher than expected.
• Lower than projected interest rates and equity market returns could decrease consolidated net
investment income, increase DAC amortization, reduce contract charges, investment margins and
the profitability of the Allstate Financial segment.
• Higher than projected interest rates could increase surrenders and withdrawals, increase DAC
amortization and reduce the competitive position and profitability of the Allstate Financial segment.
• Results from the management and review of our portfolios could cause lower than expected net
investment income.
We undertake no obligation to publicly correct or update any forward-looking statements. Our projection of
operating income includes the estimated increased cost of the reinsurance and the maximum estimated
regular assessment from Citizens as discussed above. This press release contains unaudited financial
information.
The Allstate Corporation (NYSE: ALL) is the nation’s largest publicly held personal lines insurer. Widely
known through the “You’re In Good Hands With Allstate®” slogan, Allstate helps individuals in approximately
17 million households protect what they have today and better prepare for tomorrow through nearly 13,600
exclusive agencies and financial professionals in the U.S. and Canada. Customers can access Allstate
products and services such as auto insurance and homeowners insurance through Allstate agencies, or in
select states at allstate.com and 1-800-Allstate®. EncompassSM and Deerbrook® Insurance brand property and
casualty products are sold exclusively through independent agencies. Allstate Financial Group provides life
and supplemental accident and health insurance, annuity, banking and retirement products designed for
individual, institutional and worksite customers that are distributed through Allstate agencies, independent
agencies, financial institutions and broker-dealers.
We post an investor supplement on our web site. You can access it by going to allstate.com and clicking on
“Investor Relations.” From there, go to the “Quarterly Investor Info” button. We will post additional information
to the supplement over the next 30 days as it becomes available.
Contact:
Michael Trevino
Media Relations
(847) 402-5600
Robert Block, Larry Moews, Phil Dorn
Investor Relations
(847) 402-2800
###
25