allstate Quarter Information 2007 4th Earnings Press Release
1. Allstate Reports 2007 Fourth Quarter and Year-End Results
Company Improved Financial Strength, Is Well Positioned for 2008
NORTHBROOK, Ill., January 29, 2008 – The Allstate Corporation (NYSE: ALL) today reported results for
the fourth quarter of 2007 and for the year ended December 31, 2007:
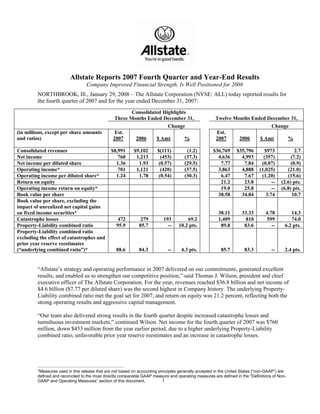
Consolidated Highlights
Three Months Ended December 31, Twelve Months Ended December 31,
Change Change
(in millions, except per share amounts Est. Est.
and ratios) 2007 2006 $ Amt % 2007 2006 $ Amt %
Consolidated revenues $8,991 $9,102 $(111) (1.2) $36,769 $35,796 $973 2.7
Net income 760 1,213 (453) (37.3) 4,636 4,993 (357) (7.2)
Net income per diluted share 1.36 1.93 (0.57) (29.5) 7.77 7.84 (0.07) (0.9)
Operating income* 701 1,121 (420) (37.5) 3,863 4,888 (1,025) (21.0)
Operating income per diluted share* 1.24 1.78 (0.54) (30.3) 6.47 7.67 (1.20) (15.6)
Return on equity 21.2 23.8 -- (2.6) pts.
Operating income return on equity* 19.0 25.8 -- (6.8) pts.
Book value per share 38.58 34.84 3.74 10.7
Book value per share, excluding the
impact of unrealized net capital gains
on fixed income securities* 38.11 33.33 4.78 14.3
Catastrophe losses 472 279 193 69.2 1,409 810 599 74.0
Property-Liability combined ratio 95.9 85.7 -- 10.2 pts. 89.8 83.6 -- 6.2 pts.
Property-Liability combined ratio
excluding the effect of catastrophes and
prior year reserve reestimates
(“underlying combined ratio”)* 88.6 84.3 -- 4.3 pts. 85.7 83.3 -- 2.4 pts.
“Allstate’s strategy and operating performance in 2007 delivered on our commitments, generated excellent
results, and enabled us to strengthen our competitive position,” said Thomas J. Wilson, president and chief
executive officer of The Allstate Corporation. For the year, revenues reached $36.8 billion and net income of
$4.6 billion ($7.77 per diluted share) was the second highest in Company history. The underlying Property-
Liability combined ratio met the goal set for 2007; and return on equity was 21.2 percent, reflecting both the
strong operating results and aggressive capital management.
“Our team also delivered strong results in the fourth quarter despite increased catastrophe losses and
tumultuous investment markets,” continued Wilson. Net income for the fourth quarter of 2007 was $760
million, down $453 million from the year earlier period, due to a higher underlying Property-Liability
combined ratio, unfavorable prior year reserve reestimates and an increase in catastrophe losses.
__________________________________________________________________
*Measures used in this release that are not based on accounting principles generally accepted in the United States (“non-GAAP”) are
defined and reconciled to the most directly comparable GAAP measure and operating measures are defined in the “Definitions of Non-
1
GAAP and Operating Measures” section of this document.
2. Consumer Focus
“Our consumer-focused strategy enabled us to succeed in the market by offering innovative products and
services that are reinventing protection for consumers,” Wilson added.
Allstate® Your Choice Auto Insurance (YCA) continued to add customers at a rate of more than 100,000 per
month in the fourth quarter, bringing the total YCA policies sold since inception to 3.2 million. Allstate®
Your Choice Home, the Company’s unique homeowners insurance product, is now available in 15 states.
Allstate’s product offering for higher risk drivers, Allstate BlueSM, is now available in 12 states and early
production shows encouraging results. In addition, Allstate GreenSM, a new eco-friendly insurance option that
offers consumers a convenient way to help the environment, is now available for consumers in Colorado and
Ohio.
Operational Excellence
“Maintaining a consistent focus on profitable growth resulted in excellent results for our Property-Liability
business in 2007,” Wilson said. “Our consumer focus enabled us to maintain pricing discipline in the face of
tough competition, with average premiums increasing in our core lines.” Margins for the year declined
resulting in a combined ratio of 89.8, reflecting a smaller benefit from prior year reserve reestimates, higher
catastrophe losses and higher loss costs. Increased loss costs represented about one third of the margin
reduction and were due to increased frequency and severity of auto and homeowners claims. For the year, the
combined ratio, excluding the effects of catastrophes and reserve reestimates, was 85.7, within the previously
provided outlook range of 84.0 to 86.0.
The combined ratio for the fourth quarter was 95.9 (88.6 excluding catastrophes and the effect of prior year
reserve releases) reflecting the same trends as for the year. Also in the fourth quarter, expenses were up
related to advertising, marketing and technology investments in product and service innovations.
Allstate Financial continued to focus on improving returns, with new business returns increasing significantly
over prior year, and leveraging both the Allstate branded Property-Liability customer base and its non-
proprietary distribution relationships. Allstate Financial operating income was $158 million for the quarter, up
11.3% from the fourth quarter of 2006. To optimize its capital position and leverage the diversification
benefits of the enterprise, Allstate Financial paid dividends of $657 million in the fourth quarter, bringing
total dividends paid by Allstate Financial to its parent companies in 2007 to $742 million. New sales of
financial products by Allstate exclusive agencies* increased to $2.9 billion in 2007, a 13.8 percent increase
from 2006.
“Our disciplined investment approach generated solid returns and shielded the portfolio from significant
losses in a tumultuous market,” Wilson said. Net investment income for the year was $6.44 billion; $1.63
billion of that was earned in the fourth quarter. Investments generated substantial capital gains of $1.24 billion
for the year, including $98 million in the fourth quarter, with strong equity portfolio performance more than
offsetting losses in the fixed income portfolio.
Capital Management
In 2007, Allstate repurchased 61 million common shares for $3.55 billion, representing nearly 10 percent of
shares outstanding at the beginning of the year. In the fourth quarter, 10.9 million shares were repurchased for
$579 million. As of December 31, 2007, $240 million remained under the current $4.0 billion repurchase
program, which is expected to be complete in the first quarter of 2008. Dividends of $0.38 per share were
paid in the fourth quarter, bringing total shareholder dividends for the year to $901 million.
2
3. People
“The Allstate team again outperformed the industry in 2007,” said Wilson, who marked the end of his first
year as chief executive officer and his 13th year with the Company. “We fulfilled the Good Hands promise to
thousands of our customers in Southern California, helping them recover from one of the state’s costliest
natural disasters. We also continued to reinvent protection and retirement for the consumer by launching
several new innovative products. We kept our commitment to shareholders by meeting our combined ratio
outlook for the year, generating solid growth in book value per share and attractive returns on equity. In
keeping with our commitment to our employees, we’re sharing the Company’s success with non-bonus
eligible employees through a profit sharing match of $1.42 for every $1.00 they contributed to the Allstate
Profit Sharing Fund.
Outlook
“Our four operational priorities of consumer focus, enterprise risk and return optimization, operational
excellence and aggressive capital management will continue to deliver excellent returns and help us continue
to outperform the industry in 2008.
“We expect our Property-Liability combined ratio, excluding the effects of catastrophes and prior year reserve
reestimates, will be within the range of 87.0 to 89.0 for 2008,” Wilson concluded.
BUSINESS HIGHLIGHTS
Three months ended Twelve months ended
($ in millions) December 31, December 31,
Est. % Est. %
2007 2006 Change 2007 2006 Change
Property-Liability
Premiums written* $6,560 $6,604 (0.7) $27,183 $27,526 (1.2)
Underwriting income* 276 978 (71.8) 2,784 4,497 (38.1)
Net income 744 1,084 (31.4) 4,258 4,614 (7.7)
Combined Ratio 95.9 85.7 10.2 pts 89.8 83.6 6.2 pts
Allstate Financial
Premiums and deposits* $1,810 $2,243 (19.3) $9,627 $11,678 (17.6)
Operating income 158 142 11.3 615 594 3.5
Net income 31 148 (79.1) 465 464 0.2
Investments
Net investment income $1,627 $1,564 4.0 $6,435 $6,177 4.2
Realized capital gains and losses 98 196 (50.0) 1,235 286 --
Property-Liability
• Property-Liability premiums written declined 0.7% from the fourth quarter of 2006, reflecting growth in
standard auto and a decline in homeowners due to catastrophe management actions including the increased
cost of the catastrophe reinsurance program. The cost of the catastrophe reinsurance program was $222
million in the fourth quarter of 2007 compared to $209 million in the fourth quarter of 2006. Excluding the
cost of the catastrophe reinsurance program, premiums written decreased 0.5%.
3
4. • Allstate brand standard auto premiums written grew 1.5% in the fourth quarter of 2007 compared to the prior
year quarter. Contributing to the overall change were the following:
- 0.9% increase in policies in force (“PIF”)
- 0.8 point decline in the renewal ratio to 88.9%
- 1.4% increase in six month average premium before reinsurance to $427
- 3.5% decrease in new issued applications
Three months ended Twelve months ended
(in thousands) December 31, December 31,
Est. % Est. %
2007 2006 Change 2007 2006 Change
Hurricane Exposure States1 246 247 (0.4) 1,018 1,037 (1.8)
California 77 81 (4.9) 315 319 (1.3)
All other states 145 157 (7.6) 621 627 (1.0)
468 485 (3.5) 1,954 1,983 (1.5)
Standard auto new issued applications
1
Hurricane exposure states are Alabama, Connecticut, Delaware, Florida, Georgia, Louisiana, Maine, Maryland,
Mississippi, New Hampshire, New Jersey, New York, North Carolina, Pennsylvania, Rhode Island, South Carolina,
Texas, Virginia and Washington D.C.
• Allstate brand homeowners premiums written declined 1.3% in the fourth quarter of 2007, compared to the
prior year quarter, primarily due to our catastrophe risk management actions. Excluding the cost of the
catastrophe reinsurance program, Allstate brand homeowners premiums written decreased 0.1% in the fourth
quarter of 2007 when compared to the prior year quarter. Contributing to the overall change were the
following:
- 3.4% decrease in PIF
- 1.7 point decline in the renewal ratio to 86.1%
- 2.6% increase in twelve month average premium before reinsurance to $856
- 23.7% decrease in new issued applications.
Three months ended Twelve months ended
(in thousands) December 31, December 31,
Est. % Est. %
2007 2006 Change 2007 2006 Change
Hurricane Exposure States1 82 105 (21.9) 377 472 (20.1)
California -- 13 (100.0) 25 56 (55.4)
All other states 89 106 (16.0) 401 459 (12.6)
171 224 (23.7) 803 987 (18.6)
Homeowners new issued applications
1
Hurricane exposure states are Alabama, Connecticut, Delaware, Florida, Georgia, Louisiana, Maine, Maryland,
Mississippi, New Hampshire, New Jersey, New York, North Carolina, Pennsylvania, Rhode Island, South Carolina,
Texas, Virginia and Washington D.C.
• During January 2008, we completed the renewal of our catastrophe reinsurance agreements countrywide,
except for Florida. We expect to place contracts for the state of Florida later this year. We estimate that the
total annualized cost of all reinsurance programs for the year beginning June 1, 2008 will be approximately
$660 million per year or $165 million per quarter, including an estimate for reinsurance coverage in Florida.
This is compared to approximately $900 million per year for our total annualized cost for the year beginning
June 1, 2007, or an estimated annualized cost decrease of $240 million beginning June 1, 2008. The
estimated decrease is due in part to our reduced exposure in Florida following our non-renewal activities over
the past year. We continue to attempt to capture our reinsurance cost in premium rates as allowed by state
regulatory authorities. We are currently involved in proceedings regarding homeowners insurance rates and
our ability to capture these reinsurance costs in various states including California, Florida and Texas. For
4
5. detailed information on our catastrophe reinsurance program, see http://media.corporate-
ir.net/media_files/irol/93/93125/reports2/all_4q07_reinsurance.pdf.
• Standard auto property damage frequencies increased 2.8% while bodily injury gross claim frequencies
decreased 2.8% compared to the fourth quarter of 2006. Auto property damage and bodily injury paid
severities increased 2.2% and 9.3%, respectively. The Allstate brand standard auto loss ratio increased 5.3
points compared to the fourth quarter of 2006 to 70.3 in the fourth quarter of 2007, due to the absence of
favorable reserve reestimates, and higher frequencies and current year severities.
• Homeowner gross claim frequency excluding catastrophes increased 4.6% compared to the fourth quarter of
2006. Homeowners severity excluding catastrophes increased 7.9% compared to the fourth quarter of 2006.
The Allstate brand homeowners loss ratio increased 22.1 points compared to the fourth quarter of 2006 to
74.8 in the fourth quarter of 2007, due to higher catastrophes and higher frequencies and current year severity.
The effect of catastrophe losses on the Allstate brand homeowners loss ratio totaled 28.4 in the fourth quarter
of 2007 compared to 16.5 in the fourth quarter of 2006.
• Property-Liability prior year reserve reestimates for the fourth quarter of 2007 were an unfavorable $48
million, compared to favorable prior year reserve reestimates of $184 million in the fourth quarter of 2006.
The unfavorable prior year reserve reestimates for the quarter were primarily related to catastrophes totaling
$26 million, as discussed below, and Discontinued Lines and Coverages totaling $16 million.
• Catastrophe losses for the quarter totaled $472 million, compared to $279 million in the fourth quarter of
2006. This increase was primarily due to $318 million in catastrophe losses related to the Southern California
wildfires in October. Catastrophe losses, excluding prior year reserve reestimates, were $446 million in the
quarter compared to $279 million in the fourth quarter of 2006, impacting the combined ratio by 6.6 points in
the quarter and 4.1 points in the fourth quarter of 2006. Unfavorable reserve reestimates related to
catastrophes from prior years totaled $26 million in the quarter. There were no reserve reestimates included
in catastrophe losses in the fourth quarter of 2006. The prior year reserve reestimates in the 2007 fourth
quarter were primarily attributable to increased loss reserves for reopened claims arising from litigation filed
in conjunction with a Louisiana deadline for filing suits related to Hurricane Katrina.
• Underwriting income was $276 million during the fourth quarter of 2007 compared to $978 million in the
same period of 2006. The decrease was due to a higher underlying combined ratio, the unfavorable change in
prior year reserve reestimates and higher catastrophe losses.
• The Property-Liability combined ratio was impacted by catastrophe losses and prior year reserve reestimates.
The impacts for the three months and twelve months ended December 31 are shown in the table below.
Three months ended Twelve months ended
December 31, December 31,
Est. Est.
2007 2006 2007 2006
Combined ratio excluding the effect of catastrophes
and prior year reserve reestimates (“underlying
88.6 84.3 85.7 83.3
combined ratio”)
Effect of catastrophe losses 7.0 4.1 5.2 3.0
Effect of prior year reserve reestimates 0.7 (2.7) (0.6) (3.5)
Catastrophe losses included in prior year reserve
reestimates (0.4) -- (0.5) 0.8
95.9 85.7 89.8 83.6
Combined ratio (GAAP)
5
6. • Our outlook for the Property-Liability 2008 combined ratio excluding the effect of catastrophe losses and
prior year reserve reestimates is in the range of 87.0 to 89.0. This outlook is based on various assumptions,
the most important of which are listed below:
Premiums written slightly higher than 2007 levels due to standard auto growth;
-
Loss costs are expected to increase higher than average premiums.
-
Allstate Financial
• Premiums and deposits in the fourth quarter of 2007 were $1.81 billion, a decrease of 19.3% from the prior
year quarter. This decline was due to the fact that there were no deposits on institutional products during the
fourth quarter of 2007 compared to $500 million in the fourth quarter of 2006. Sales of our institutional
products vary from period to period based on management’s assessment of market conditions.
• Operating income for the fourth quarter of 2007 was $158 million, $16 million higher than the prior year
quarter primarily due to increased income on limited partnership interests, increased contract charges and an
energy tax credit which reduced income tax expense.
• Net income for the fourth quarter of 2007 was $31 million, $117 million below the prior year quarter. The
decline was due to higher realized capital losses and a loss on disposition of operations. Higher net capital
losses were driven by $95 million in investment write-downs and a $120 million decline in the valuation of
derivative instruments, including investments in equity-linked notes and economic hedges of interest rate risk.
Investments
• Allstate’s investment portfolios totaled $118.98 billion as of December 31, 2007, a decline of $2.15 billion
from the third quarter of 2007, primarily due to lower funds associated with collateral received in conjunction
with securities lending and other activities, which declined $1.05 billion, and lower net unrealized gains.
• The decrease in net unrealized gains during the fourth quarter of 2007 was related primarily to unrealized
losses on investment grade fixed income securities, resulting from widening credit spreads and credit
exposure related to certain collateralized securities more than offsetting the effects of declining interest rates,
and sales of equity securities with net realized gains totaling $351 million. Total unrealized gains and losses
are shown in the table below.
(in millions) December 31, September 30, December 31,
2007 2007 2006
U.S. government and agencies $ 918 $ 767 $ 749
Municipal 720 645 943
Corporate 90 55 551
Foreign government 394 319 329
Mortgage-backed securities (1) (43) (54) (46)
Commercial mortgage-backed securities(1) (308) (165) 3
Asset-backed securities (1) (816) (461) 9
Redeemable preferred stock 1 -- 2
Fixed income securities 956 1,106 2,540
Equity securities 990 1,510 1,751
Derivatives (33) (47) (17)
$ 1,913 $ 2,569 $ 4,274
Unrealized gains and losses
(1) For further information on our sub-prime residential and commercial mortgage loan portfolio, see the Residential and Commercial Mortgage-
Backed and Other Asset -Backed Securities section.
6
7. • Net investment income increased 4.0% to $1.63 billion compared to the prior year quarter. Property-Liability
net investment income increased 3.8% to $490 million, compared to the prior year quarter, benefiting from
increased income on limited partnership interests and increased portfolio yields when compared to the same
period in the prior year. Allstate Financial net investment income rose 2.6% to $1.09 billion, compared to the
prior year quarter, including increased income from limited partnership interests.
• Net realized capital gains were $98 million on a pre-tax basis for the quarter, primarily due to $384 million of
net gains related to dispositions, including $332 million of gains related to equity securities in the Property-
Liability portfolio, and $6 million of net gains related to the settlement of derivative instruments. Partially
offsetting realized capital gains were $166 million of net losses related to valuations of derivative instruments
primarily due to changes in underlying interest rates and $126 million of investment write-downs, including
$20 million relating to asset-backed residential mortgage-backed securities and $62 million relating to asset-
backed collateralized debt obligations. Approximately $53 million or 31.8% of the losses related to the
valuations of derivative instruments relate to economic hedging instruments that support investments whose
valuation changes are reported in shareholders’ equity.
7
8. THE ALLSTATE CORPORATION
CONSOLIDATED AND SEGMENT HIGHLIGHTS
Three Months Ended Twelve Months Ended
December 31, December 31,
($ in millions, except per share amounts, Est. Percent Est. Percent
return data and ratios) 2007 2006 Change Change 2007 2006 Change Change
Consolidated Highlights
Revenues $ 8,991 $ 9,102 (111) (1.2) $ 36,769 $ 35,796 973 2.7
Net income 760 1,213 (453) (37.3) 4,636 4,993 (357) (7.2)
Operating income 701 1,121 (420) (37.5) 3,863 4,888 (1,025) (21.0)
Income per diluted share
Net 1.36 1.93 (0.57) (29.5) 7.77 7.84 (0.07) (0.9)
Operating 1.24 1.78 (0.54) (30.3) 6.47 7.67 (1.20) (15.6)
Weighted average shares outstanding (diluted) 571.9 629.4 (57.5) (9.1) 596.7 637.2 (40.5) (6.4)
Net shares outstanding 562.8 621.7 (58.9) (9.5)
Return on equity
Net income 21.2 23.8 (2.6) (10.9) pts.
Operating income 19.0 25.8 (6.8) (26.4) pts.
Book value per diluted share 38.58 34.84 3.74 10.7
Book value per diluted share, excluding the
impact of unrealized net capital gains on
fixed income securities 38.11 33.33 4.78 14.3
Property-Liability Highlights
Property-Liability premiums written $ 6,560 $ 6,604 (44) (0.7) $ 27,183 $ 27,526 (343) (1.2)
Property-Liability revenues 7,561 7,419 142 1.9 30,621 29,571 1,050 3.6
Net income 744 1,084 (340) (31.4) 4,258 4,614 (356) (7.7)
Underwriting income 276 978 (702) (71.8) 2,784 4,497 (1,713) (38.1)
Net investment income 490 472 18 3.8 1,972 1,854 118 6.4
Operating income 562 1,010 (448) (44.4) 3,343 4,388 (1,045) (23.8)
Catastrophe losses 472 279 193 69.2 1,409 810 599 74.0
Ratios:
Allstate Protection loss ratio 69.4 60.5 8.9 14.7 pts. 64.7 58.1 6.6 11.4 pts.
Allstate Protection expense ratio 26.3 25.1 1.2 4.8 pts. 24.9 25.0 (0.1) (0.4) pts.
Allstate Protection combined ratio 95.7 85.6 10.1 11.8 pts. 89.6 83.1 6.5 7.8 pts.
Effect of Discontinued Lines and Coverages on
combined ratio 0.2 0.1 0.1 100.0 pts. 0.2 0.5 (0.3) (60.0) pts.
Property-Liability combined ratio 95.9 85.7 10.2 11.9 pts. 89.8 83.6 6.2 7.4 pts.
Effect of catastrophe losses on combined ratio 7.0 4.1 2.9 70.7 pts. 5.2 3.0 2.2 73.3 pts.
Property-Liability combined ratio excluding
effect of catastrophes 88.9 81.6 7.3 8.9 pts. 84.6 80.6 4.0 5.0 pts.
Effect of prior year reserve reestimates on
combined ratio 0.7 (2.7) 3.4 125.9 pts. (0.6) (3.5) 2.9 82.9 pts.
Effect of catastrophe losses included in prior
year reserve reestimates on combined ratio (0.4) - (0.4) - pts. (0.5) 0.8 (1.3) (162.5) pts.
Property-Liability combined ratio excluding
effect of catastrophes and prior year
reserve reestimates 88.6 84.3 4.3 5.1 pts. 85.7 83.3 2.4 2.9 pts.
Allstate Financial Highlights
Premiums and deposits $ 1,810 $ 2,243 (433) (19.3) $ 9,627 $ 11,678 (2,051) (17.6)
Allstate Financial revenues 1,372 1,629 (257) (15.8) 5,970 6,060 (90) (1.5)
Net income 31 148 (117) (79.1) 465 464 1 0.2
Operating income 158 142 16 11.3 615 594 21 3.5
Net Income Analysis
Benefit spread 119 123 (4) (3.3) 480 506 (26) (5.1)
Investment spread 275 254 21 8.3 1,069 1,025 44 4.3
Investment Highlights
Net Investment Income $ 1,627 $ 1,564 63 4.0 $ 6,435 $ 6,177 258 4.2
Realized Capital Gains and Losses (Pretax) 98 196 (98) (50.0) 1,235 286 949 -
Total Investments 118,980 119,757 (777) (0.6)
8
9. THE ALLSTATE CORPORATION
CONSOLIDATED STATEMENTS OF OPERATIONS
Three Months Ended Twelve Months Ended
December 31, December 31,
Est. Percent Est. Percent
($ in millions, except per share data) 2007 2006 Change 2007 2006 Change
Revenues
Property-liability insurance premiums $ 6,786 $ 6,832 (0.7) $ 27,233 $ 27,369 (0.5)
Life and annuity premiums
and contract charges 480 510 (5.9) 1,866 1,964 (5.0)
Net investment income 1,627 1,564 4.0 6,435 6,177 4.2
Realized capital gains and losses 98 196 (50.0) 1,235 286 -
Total revenues 8,991 9,102 (1.2) 36,769 35,796 2.7
Costs and expenses
Property-liability insurance
claims and claims expense 4,724 4,138 14.2 17,667 16,017 10.3
Life and annuity contract benefits 404 435 (7.1) 1,589 1,570 1.2
Interest credited to contractholder funds 674 670 0.6 2,681 2,609 2.8
Amortization of deferred policy
acquisition costs 1,165 1,235 (5.7) 4,704 4,757 (1.1)
Operating costs and expenses 857 781 9.7 3,103 3,033 2.3
Restructuring and related charges 24 11 118.2 29 182 (84.1)
Interest expense 88 96 (8.3) 333 357 (6.7)
Total costs and expenses 7,936 7,366 7.7 30,106 28,525 5.5
Loss on disposition of operations (18) (4) - (10) (93) 89.2
Income from operations before income
tax expense 1,037 1,732 (40.1) 6,653 7,178 (7.3)
Income tax expense 277 519 (46.6) 2,017 2,185 (7.7)
Net income $ 760 $ 1,213 (37.3) $ 4,636 $ 4,993 (7.2)
Net income per share - Basic $ 1.38 $ 1.94 (28.9) $ 7.83 $ 7.89 (0.8)
Weighted average shares - Basic 568.4 624.0 (8.9) 592.4 632.5 (6.3)
Net income per share - Diluted $ 1.36 $ 1.93 (29.5) $ 7.77 $ 7.84 (0.9)
Weighted average shares - Diluted 571.9 629.4 (9.1) 596.7 637.2 (6.4)
Cash dividends declared per share $ 0.38 $ 0.35 8.6 $ 1.52 $ 1.40 8.6
9
10. THE ALLSTATE CORPORATION
CONTRIBUTION TO INCOME
Three Months Ended Twelve Months Ended
December 31, December 31,
Est. Percent Est. Percent
($ in millions, except per share data) 2007 2006 Change 2007 2006 Change
Contribution to income
Operating income before the impact of
restructuring and related charges $ 717 $ 1,128 (36.4) $ 3,882 $ 5,006 (22.5)
Restructuring and related charges,
after-tax 16 7 128.6 19 118 (83.9)
Operating income 701 1,121 (37.5) 3,863 4,888 (21.0)
Realized capital gains and losses, after-tax 61 125 (51.2) 798 186 -
DAC and DSI amortization relating to realized capital
gains and losses, after-tax 16 (4) - 12 36 (66.7)
(1)
Non-recurring items, after-tax - (18) (100.0) - (18) 100.0
Reclassification of periodic settlements
and accruals on non-hedge derivative
instruments, after-tax (6) (8) 25.0 (29) (36) 19.4
Loss on disposition of operations, after-tax (12) (3) - (8) (63) 87.3
Net income $ 760 $ 1,213 (37.3) $ 4,636 $ 4,993 (7.2)
Income per share - Diluted
Operating income before the impact of
restructuring and related charges $ 1.28 $ 1.80 (28.9) $ 6.51 $ 7.86 (17.2)
Restructuring and related charges,
after-tax 0.04 0.02 100.0 0.04 0.19 (78.9)
Operating income 1.24 1.78 (30.3) 6.47 7.67 (15.6)
Realized capital gains and losses, after-tax 0.12 0.20 (40.0) 1.34 0.29 -
DAC and DSI amortization relating to realized capital
gains and losses, after-tax 0.03 - - 0.02 0.06 (66.7)
(1)
Non-recurring items, after-tax - (0.03) 100.0 - (0.03) 100.0
Reclassification of periodic settlements
and accruals on non-hedge derivative
instruments, after-tax (0.01) (0.01) - (0.05) (0.05) -
Loss on disposition of operations, after-tax (0.02) (0.01) (100.0) (0.01) (0.10) 90.0
Net income $ 1.36 $ 1.93 (29.5) $ 7.77 $ 7.84 (0.9)
(1) Non-recurring items include a write-off of deferred costs related to a block of corporate owned life insurance policies that terminated due to bankruptcy of the
policyholder in the fourth quarter of 2006.
10
11. THE ALLSTATE CORPORATION
SEGMENT RESULTS
Three Months Ended Twelve Months Ended
December 31, December 31,
($ in millions, except ratios) Est. Est.
2007 2006 2007 2006
Property-Liability
Premiums written $ 6,560 $ 6,604 $ 27,183 $ 27,526
Premiums earned $ 6,786 $ 6,832 $ 27,233 $ 27,369
Claims and claims expense 4,724 4,138 17,667 16,017
Amortization of deferred policy acquisition costs 1,040 1,043 4,121 4,131
Operating costs and expenses 724 662 2,634 2,567
Restructuring and related charges 22 11 27 157
Underwriting income 276 978 2,784 4,497
Net investment income 490 472 1,972 1,854
Income tax expense on operations 204 440 1,413 1,963
Operating income 562 1,010 3,343 4,388
Realized capital gains and losses, after-tax 182 74 915 227
Loss on disposition of operations, after-tax - - - (1)
Net income $ 744 $ 1,084 $ 4,258 $ 4,614
Catastrophe losses $ 472 $ 279 $ 1,409 $ 810
Operating ratios
Claims and claims expense ratio 69.6 60.6 64.9 58.5
(2)
Expense ratio 26.3 25.1 24.9 25.1
Combined ratio 95.9 85.7 89.8 83.6
Effect of catastrophe losses on combined ratio 7.0 4.1 5.2 3.0
Effect of prior year reserve reestimates on combined ratio 0.7 (2.7) (0.6) (3.5)
Effect of catastrophe losses included in prior year reserve reestimate on combined ratio (0.4) - (0.5) 0.8
Effect of restructuring and related charges on combined ratio 0.3 0.2 0.1 0.6
Effect of Discontinued Lines and Coverages on combined ratio 0.2 0.1 0.2 0.5
Allstate Financial
Premiums and deposits $ 1,810 $ 2,243 $ 9,627 $ 11,678
Investments $ 74,256 $ 75,951 $ 74,256 $ 75,951
Premiums and contract charges $ 480 $ 510 $ 1,866 $ 1,964
Net investment income 1,085 1,058 4,297 4,173
Periodic settlements and accruals on non-hedge derivative instruments 10 12 46 56
Contract benefits 404 435 1,589 1,570
Interest credited to contractholder funds 676 669 2,682 2,614
Amortization of deferred policy acquisition costs 148 158 601 649
Operating costs and expenses 128 119 441 468
Restructuring and related charges 2 - 2 24
Income tax expense on operations 59 57 279 274
Operating income 158 142 615 594
Realized capital gains and losses, after-tax (125) 39 (125) (50)
DAC and DSI amortization relating to realized capital gains and losses, after-tax 16 (4) 12 36
(1)
Non-recurring items, after-tax - (18) - (18)
Reclassification of periodic settlements and accruals on non-hedge
derivative instruments, after-tax (6) (8) (29) (36)
Loss on disposition of operations, after-tax (12) (3) (8) (62)
Net income $ 31 $ 148 $ 465 $ 464
Corporate and Other
Net investment income $ 52 $ 34 $ 166 $ 150
Operating costs and expenses 93 96 361 355
Restructuring and related charges - - - 1
Income tax benefit on operations (22) (31) (100) (112)
Operating loss (19) (31) (95) (94)
Realized capital gains and losses, after-tax 4 12 8 9
Net loss $ (15) $ (19) $ (87) $ (85)
Consolidated net income $ 760 $ 1,213 $ 4,636 $ 4,993
(1) Non-recurring items include a write-off of deferred costs related to a block of corporate owned life insurance policies that terminated due to bankruptcy of the
policyholder in the fourth quarter of 2006.
(2) During the fourth quarter of 2007, the increase in the expense ratio was related to advertising, marketing and technology investments in product and service
innovations.
11
12. THE ALLSTATE CORPORATION
UNDERWRITING RESULTS BY AREA OF BUSINESS
Three Months Ended Twelve Months Ended
December 31, December 31,
Est. Percent Est. Percent
($ in millions, except ratios) 2007 2006 Change 2007 2006 Change
Property-Liability Underwriting Summary
Allstate Protection $ 294 $ 984 (70.1) $ 2,838 $ 4,636 (38.8)
Discontinued Lines and Coverages (18) (6) - (54) (139) 61.2
Underwriting income $ 276 $ 978 (71.8) $ 2,784 $ 4,497 (38.1)
Allstate Protection Underwriting Summary
Premiums written $ 6,560 $ 6,604 (0.7) $ 27,183 $ 27,525 (1.2)
Premiums earned $ 6,785 $ 6,831 (0.7) $ 27,232 $ 27,366 (0.5)
Claims and claims expense 4,708 4,133 13.9 17,620 15,885 10.9
Amortization of deferred policy acquisition costs 1,040 1,043 (0.3) 4,121 4,131 (0.2)
Operating costs and expenses 721 660 9.2 2,626 2,557 2.7
Restructuring and related charges 22 11 100.0 27 157 (82.8)
Underwriting income $ 294 $ 984 (70.1) $ 2,838 $ 4,636 (38.8)
Catastrophe losses $ 472 $ 279 69.2 $ 1,409 $ 810 74.0
Operating ratios:
Claims and claims expense ratio 69.4 60.5 64.7 58.1
Expense ratio (1) 26.3 25.1 24.9 25.0
Combined ratio 95.7 85.6 89.6 83.1
Effect of catastrophe losses
on combined ratio 7.0 4.1 5.2 3.0
Effect of restructuring and related
charges on combined ratio 0.3 0.2 0.1 0.6
Discontinued Lines and Coverages
Underwriting Summary
Premiums written $ - $ - - $ - $ 1 (100.0)
Premiums earned $ 1 $ 1 - $ 1 $ 3 (66.7)
Claims and claims expense 16 5 - 47 132 (64.4)
Operating costs and expenses 3 2 50.0 8 10 (20.0)
Underwriting loss $ (18) $ (6) - $ (54) $ (139) 61.2
Effect of Discontinued Lines and Coverages
on the Property-Liability combined ratio 0.2 0.1 0.2 0.5
(1) During the fourth quarter of 2007, the increase in the expense ratio was related to advertising, marketing and technology investments in product
and service innovations.
12
13. THE ALLSTATE CORPORATION
PROPERTY-LIABILITY PREMIUMS WRITTEN BY MARKET SEGMENT
Three Months Ended Twelve Months Ended
December 31, December 31,
Est. Percent Est. Percent
($ in millions) 2007 2006 Change 2007 2006 Change
Allstate brand
Standard auto (1) $ 3,949 $ 3,891 1.5 $ 16,035 $ 15,704 2.1
Non-standard auto (1) 265 310 (14.5) 1,179 1,386 (14.9)
Involuntary auto 16 19 (15.8) 78 114 (31.6)
Commercial lines 168 190 (11.6) 736 834 (11.8)
Homeowners 1,365 1,383 (1.3) 5,711 5,926 (3.6)
Other personal lines 364 362 0.6 1,583 1,600 (1.1)
6,127 6,155 (0.5) 25,322 25,564 (0.9)
Encompass brand
Standard auto 266 266 - 1,125 1,138 (1.1)
Non-standard auto 14 22 (36.4) 68 94 (27.7)
Involuntary auto 3 3 - 17 22 (22.7)
Homeowners 123 131 (6.1) 538 589 (8.7)
Other personal lines 27 27 - 113 118 (4.2)
433 449 (3.6) 1,861 1,961 (5.1)
Allstate Protection 6,560 6,604 (0.7) 27,183 27,525 (1.2)
Discontinued Lines and Coverages - - - - 1 (100.0)
Property-Liability $ 6,560 $ 6,604 (0.7) $ 27,183 $ 27,526 (1.2)
Allstate Protection
Standard auto $ 4,215 $ 4,157 1.4 $ 17,160 $ 16,842 1.9
Non-standard auto 279 332 (16.0) 1,247 1,480 (15.7)
Involuntary auto 19 22 (13.6) 95 136 (30.1)
Commercial lines 168 190 (11.6) 736 834 (11.8)
Homeowners 1,488 1,514 (1.7) 6,249 6,515 (4.1)
Other personal lines 391 389 0.5 1,696 1,718 (1.3)
$ 6,560 $ 6,604 (0.7) $ 27,183 $ 27,525 (1.2)
(1) Included in the fourth quarter 2007 amounts are premiums written associated with restoring mandatory personal injury protection in the
state of Florida during the period.
13
14. THE ALLSTATE CORPORATION
PROPERTY-LIABILITY
ANNUAL IMPACT OF NET RATE CHANGES APPROVED ON PREMIUMS WRITTEN (1)
Three Months Ended
December 31, 2007 (Est.)
Number of
Countrywide (%) (2) (3)
State Specific (%)
States
Allstate brand
Standard auto (5) 8 0.2 2.1
Non-standard auto (5) 1 (0.1) (8.6)
Homeowners 5 - -
Encompass brand
Standard auto 5 0.6 7.3
Non-standard auto - - -
Homeowners 5 0.1 6.8
Twelve Months Ended
December 31, 2007 (Est.)
Number of
Countrywide (%) (2) (3)
State Specific (%)
States
Allstate brand
Standard auto (5) 25 1.3 4.4
(5)
Non-standard auto 9 1.0 4.7
Homeowners (4) 33 3.6 5.8
Encompass brand
Standard auto 12 0.4 1.2
Non-standard auto 7 8.1 14.6
Homeowners (4) 26 2.3 4.3
(1) Rate increases that are indicated based on a loss trend analysis to achieve a targeted return will continue to
be pursued in all locations and for all products. Rate changes include changes approved based on our net
cost of reinsurance. These rate changes do not reflect initial rates filed for insurance subsidiaries initially
writing new business.
(2) Represents the impact in the states where rate changes were approved during 2007 as a percentage of total
countrywide prior year-end premiums written.
(3) Represents the impact in the states where rate changes were approved during 2007 as a percentage of total
prior year-end premiums written in those states.
(4) Includes Washington, D.C.
(5) Excludes the impact of rate changes in the state of Florida relating to the discontinuation and reinstatement
of mandatory personal injury protection.
14
15. THE ALLSTATE CORPORATION
ALLSTATE PROTECTION MARKET SEGMENT ANALYSIS
Three Months Ended December 31,
($ in millions, except ratios) Est. 2007 2006 Est. 2007 2006 Est. 2007 2006 Est. 2007 2006
Effect of
Catastrophe Losses
(2)
Premiums Earned Loss Ratio on the Loss Ratio Expense Ratio
Allstate brand
Standard auto $ 4,011 $ 3,964 70.3 65.0 0.1 0.6 25.6 24.1
Non-standard auto 290 334 44.8 53.9 0.3 - 25.2 21.8
Homeowners 1,428 1,424 74.8 52.7 28.4 16.5 27.2 26.7
Other (1) 597 618 61.0 53.1 5.9 (1.0) 28.8 26.8
Total Allstate brand 6,326 6,340 69.3 60.5 7.1 4.0 26.2 24.8
Encompass brand
Standard auto 277 289 73.3 60.2 0.4 0.3 24.5 28.7
Non-standard auto 16 23 75.0 60.9 - 4.3 31.3 30.4
Homeowners 133 144 58.6 55.6 17.3 15.3 30.1 30.5
Other (1) 33 35 93.9 85.7 - 5.7 30.3 14.3
Total Encompass brand 459 491 70.6 60.7 5.2 5.3 26.8 28.3
Allstate Protection $ 6,785 $ 6,831 69.4 60.5 7.0 4.1 26.3 25.1
Twelve Months Ended December 31,
($ in millions, except ratios) Est. 2007 2006 Est. 2007 2006 Est. 2007 2006 Est. 2007 2006
Effect of
Catastrophe Losses
Loss Ratio (2)
Premiums Earned on the Loss Ratio Expense Ratio
Allstate brand
Standard auto $ 15,952 $ 15,591 65.8 61.5 0.6 0.6 24.4 24.5
Non-standard auto 1,232 1,436 54.9 56.1 0.2 - 23.5 22.0
Homeowners 5,732 5,793 66.5 50.4 19.5 10.9 25.0 25.3
Other (1) 2,426 2,546 60.4 52.1 5.0 (0.9) 26.3 26.5
Total Allstate brand 25,342 25,366 64.9 57.8 5.3 2.8 24.7 24.7
Encompass brand
Standard auto 1,127 1,160 64.2 60.0 0.4 (0.3) 26.4 28.3
Non-standard auto 76 98 75.0 76.5 - 1.0 27.6 29.6
Homeowners 551 590 54.6 58.6 12.0 17.3 30.0 30.2
Other (1) 136 152 61.8 81.6 2.2 7.9 27.2 25.6
Total Encompass brand 1,890 2,000 61.6 62.1 3.9 5.6 27.6 28.7
Allstate Protection $ 27,232 $ 27,366 64.7 58.1 5.2 3.0 24.9 25.0
(1) Other includes commercial lines, condominium, renters, involuntary auto and other personal lines.
(2) Loss Ratio comparisons are impacted by the relative level of prior year reserve reestimates. Please refer to the quot;Effect of Pretax Prior
Year Reserve Reestimates on the Combined Ratioquot; table for detailed reserve reestimate information.
15
16. THE ALLSTATE CORPORATION
PROPERTY-LIABILITY
EFFECT OF PRETAX PRIOR YEAR RESERVE REESTIMATES ON THE COMBINED RATIO
Three Months Ended December 31,
Effect of Pretax Reserve
Pretax Reestimates on the
(1)
Reserve Reestimates Combined Ratio
Est. Est.
($ in millions, except ratios) 2007 2006 2007 2006
Auto $ (22) $ (158) (0.3) (2.3)
Homeowners 44 20 0.7 0.3
Other 10 (51) 0.1 (0.8)
(2)
Allstate Protection 32 (189) 0.5 (2.8)
Discontinued Lines and Coverages 16 5 0.2 0.1
Property-Liability $ 48 $ (184) 0.7 (2.7)
Allstate brand $ 17 $ (184) 0.3 (2.7)
Encompass brand 15 (5) 0.2 (0.1)
(2)
Allstate Protection $ 32 $ (189) 0.5 (2.8)
Twelve Months Ended December 31,
Effect of Pretax Reserve
Pretax Reestimates on the
(1)
Reserve Reestimates Combined Ratio
Est. Est.
($ in millions, except ratios) 2007 2006 2007 2006
Auto $ (311) $ (737) (1.1) (2.7)
Homeowners 115 (244) 0.4 (0.9)
Other (23) (122) (0.1) (0.4)
(3)
Allstate Protection (219) (1,103) (0.8) (4.0)
Discontinued Lines and Coverages 47 132 0.2 0.5
Property-Liability $ (172) $ (971) (0.6) (3.5)
Allstate brand $ (167) $ (1,085) (0.6) (3.9)
Encompass brand (52) (18) (0.2) (0.1)
(3)
Allstate Protection $ (219) $ (1,103) (0.8) (4.0)
(1) Favorable reserve reestimates are shown in parentheses.
(2) Unfavorable reserve reestimates included in catastrophe losses totaled $26 million in the three months ended December
31, 2007 and there were no reserve reestimates included in catastrophe losses in the three months ended December 31,
2006.
(3) Unfavorable reserve reestimates included in catastrophe losses totaled $127 million in the twelve months ended
December 31, 2007 and favorable reserve reestimates included in catastrophe losses totaled $223 million in the twelve
months ended December 31, 2006.
16