1. UNITED STATES
SECURITIES AND EXCHANGE COMMISSION
Washington, D.C. 20549
Form 10-K
(Mark One)
¥ ANNUAL REPORT PURSUANT TO SECTION 13 OR 15(d) OF
THE SECURITIES EXCHANGE ACT OF 1934
For the fiscal year ended December 31, 2005
OR
n TRANSITION REPORT PURSUANT TO SECTION 13 OR 15(d) OF
THE SECURITIES EXCHANGE ACT OF 1934
For the transition period from to .
Commission File Number 1-14365
El Paso Corporation
(Exact Name of Registrant as Specified in Its Charter)
Delaware 76-0568816
(State or Other Jurisdiction of (I.R.S. Employer
Incorporation or Organization) Identification No.)
El Paso Building
1001 Louisiana Street
Houston, Texas 77002
(Address of Principal Executive Offices) (Zip Code)
Telephone Number: (713) 420-2600
Internet Website: www.elpaso.com
Securities registered pursuant to Section 12(b) of the Act:
Name of Each Exchange
Title of Each Class on which Registered
Common Stock, par value $3 per share New York Stock Exchange
Securities registered pursuant to Section 12(g) of the Act: None
Indicate by check mark if the registrant is a well-known seasoned issuer, as defined in Rule 405 of the Securities Act.
Yes ¥ No n.
Indicate by check mark if the registrant is not required to file reports pursuant to Section 13 or Section 15(d) of the
Act. Yes n No ¥.
Indicate by check mark whether the registrant (1) has filed all reports required to be filed by Section 13 or 15(d) of the Securities
Exchange Act of 1934 during the preceding 12 months (or for such shorter period that the registrant was required to file such reports),
and (2) has been subject to such filing requirements for the past 90 days. Yes ¥ No n.
Indicate by check mark if disclosure of delinquent filers pursuant to Item 405 of Regulation S-K is not contained herein, and will
not be contained, to the best of registrant's knowledge, in definitive proxy or information statements incorporated by reference in Part
III of this Form 10-K or any amendment to this Form 10-K. ¥
Indicate by check mark whether the registrant is a large accelerated filer, an accelerated filer, or a non-accelerated filer. See
definition of quot;quot;accelerated filer and large accelerated filer'' in Rule 12b-2 of the Exchange Act. (Check one):
Large accelerated filer ¥ Accelerated filer n Non-accelerated filer n
Indicate by check mark whether the registrant is a shell company (as defined in Rule 12b-2 of the Exchange Act).
Yes n No ¥.
State the aggregate market value of the voting and non-voting common equity held by non-affiliates of the registrant.
Aggregate market value of the voting stock (which consists solely of shares of common stock) held by non-affiliates of the
registrant as of June 30, 2005 computed by reference to the closing sale price of the registrant's common stock on the New York Stock
Exchange on such date: $7,594,102,633.
Indicate the number of shares outstanding of each of the registrant's classes of common stock, as of the latest practicable date.
Common Stock, par value $3 per share. Shares outstanding on February 24, 2006: 659,210,298
Documents Incorporated by Reference
List hereunder the following documents if incorporated by reference and the part of the Form 10-K (e.g., Part I, Part II, etc.) into
which the document is incorporated: Portions of our definitive proxy statement for the 2006 Annual Meeting of Stockholders are
incorporated by reference into Part III of this report. These will be filed no later than April 30, 2006.
2. EL PASO CORPORATION
TABLE OF CONTENTS
Caption Page
PART I
Item 1. BusinessÏÏÏÏÏÏÏÏÏÏÏÏÏÏÏÏÏÏÏÏÏÏÏÏÏÏÏÏÏÏÏÏÏÏÏÏÏÏÏÏÏÏÏÏÏÏÏÏÏÏÏÏÏÏÏÏÏÏÏÏÏÏÏÏÏÏÏÏ 1
Item 1A. Risk Factors ÏÏÏÏÏÏÏÏÏÏÏÏÏÏÏÏÏÏÏÏÏÏÏÏÏÏÏÏÏÏÏÏÏÏÏÏÏÏÏÏÏÏÏÏÏÏÏÏÏÏÏÏÏÏÏÏÏÏÏÏÏÏÏÏ 24
Cautionary Statement for Purposes of the quot;quot;Safe Harbor'' Provisions of the Private
Securities Litigation Reform Act of 1995
Item 1B. Unresolved Staff Comments ÏÏÏÏÏÏÏÏÏÏÏÏÏÏÏÏÏÏÏÏÏÏÏÏÏÏÏÏÏÏÏÏÏÏÏÏÏÏÏÏÏÏÏÏÏÏÏÏÏÏÏ 33
Item 2. Properties ÏÏÏÏÏÏÏÏÏÏÏÏÏÏÏÏÏÏÏÏÏÏÏÏÏÏÏÏÏÏÏÏÏÏÏÏÏÏÏÏÏÏÏÏÏÏÏÏÏÏÏÏÏÏÏÏÏÏÏÏÏÏÏÏÏÏ 33
Item 3. Legal Proceedings ÏÏÏÏÏÏÏÏÏÏÏÏÏÏÏÏÏÏÏÏÏÏÏÏÏÏÏÏÏÏÏÏÏÏÏÏÏÏÏÏÏÏÏÏÏÏÏÏÏÏÏÏÏÏÏÏÏÏÏ 33
Item 4. Submission of Matters to a Vote of Security Holders ÏÏÏÏÏÏÏÏÏÏÏÏÏÏÏÏÏÏÏÏÏÏÏÏÏÏÏÏÏÏ 35
PART II
Item 5. Market for Registrant's Common Equity, Related Stockholder Matters and Issuer
Purchases of Equity Securities ÏÏÏÏÏÏÏÏÏÏÏÏÏÏÏÏÏÏÏÏÏÏÏÏÏÏÏÏÏÏÏÏÏÏÏÏÏÏÏÏÏÏÏÏÏÏÏ 36
Item 6. Selected Financial Data ÏÏÏÏÏÏÏÏÏÏÏÏÏÏÏÏÏÏÏÏÏÏÏÏÏÏÏÏÏÏÏÏÏÏÏÏÏÏÏÏÏÏÏÏÏÏÏÏÏÏÏÏÏÏ 37
Item 7. Management's Discussion and Analysis of Financial Condition and
Results of OperationsÏÏÏÏÏÏÏÏÏÏÏÏÏÏÏÏÏÏÏÏÏÏÏÏÏÏÏÏÏÏÏÏÏÏÏÏÏÏÏÏÏÏÏÏÏÏÏÏÏÏÏÏÏÏÏ 38
Item 7A. Quantitative and Qualitative Disclosures About Market Risk ÏÏÏÏÏÏÏÏÏÏÏÏÏÏÏÏÏÏÏÏÏÏÏ 79
Item 8. Financial Statements and Supplementary Data ÏÏÏÏÏÏÏÏÏÏÏÏÏÏÏÏÏÏÏÏÏÏÏÏÏÏÏÏÏÏÏÏÏÏÏ 82
Item 9. Changes in and Disagreements with Accountants on Accounting and
Financial DisclosureÏÏÏÏÏÏÏÏÏÏÏÏÏÏÏÏÏÏÏÏÏÏÏÏÏÏÏÏÏÏÏÏÏÏÏÏÏÏÏÏÏÏÏÏÏÏÏÏÏÏÏÏÏÏÏÏ 155
Item 9A. Controls and Procedures ÏÏÏÏÏÏÏÏÏÏÏÏÏÏÏÏÏÏÏÏÏÏÏÏÏÏÏÏÏÏÏÏÏÏÏÏÏÏÏÏÏÏÏÏÏÏÏÏÏÏÏÏÏÏ 155
Item 9B. Other Information ÏÏÏÏÏÏÏÏÏÏÏÏÏÏÏÏÏÏÏÏÏÏÏÏÏÏÏÏÏÏÏÏÏÏÏÏÏÏÏÏÏÏÏÏÏÏÏÏÏÏÏÏÏÏÏÏÏÏÏ 155
PART III
Item 10. Directors and Executive Officers of the Registrant ÏÏÏÏÏÏÏÏÏÏÏÏÏÏÏÏÏÏÏÏÏÏÏÏÏÏÏÏÏÏÏÏ 156
Item 11. Executive Compensation ÏÏÏÏÏÏÏÏÏÏÏÏÏÏÏÏÏÏÏÏÏÏÏÏÏÏÏÏÏÏÏÏÏÏÏÏÏÏÏÏÏÏÏÏÏÏÏÏÏÏÏÏÏÏ 156
Item 12. Security Ownership of Certain Beneficial Owners and Management and
Related Stockholder Matters ÏÏÏÏÏÏÏÏÏÏÏÏÏÏÏÏÏÏÏÏÏÏÏÏÏÏÏÏÏÏÏÏÏÏÏÏÏÏÏÏÏÏÏÏÏÏÏÏ 156
Item 13. Certain Relationships and Related Transactions ÏÏÏÏÏÏÏÏÏÏÏÏÏÏÏÏÏÏÏÏÏÏÏÏÏÏÏÏÏÏÏÏÏÏ 156
Item 14. Principal Accountant Fees and Services ÏÏÏÏÏÏÏÏÏÏÏÏÏÏÏÏÏÏÏÏÏÏÏÏÏÏÏÏÏÏÏÏÏÏÏÏÏÏÏÏÏ 156
PART IV
Item 15. Exhibits and Financial Statement Schedules ÏÏÏÏÏÏÏÏÏÏÏÏÏÏÏÏÏÏÏÏÏÏÏÏÏÏÏÏÏÏÏÏÏÏÏÏÏ 157
Signatures ÏÏÏÏÏÏÏÏÏÏÏÏÏÏÏÏÏÏÏÏÏÏÏÏÏÏÏÏÏÏÏÏÏÏÏÏÏÏÏÏÏÏÏÏÏÏÏÏÏÏÏÏÏÏÏÏÏÏÏÏÏÏÏÏÏÏ 187
Below is a list of terms that are common to our industry and used throughout this document:
/d • per day MDth • thousand dekatherms
Bbl • barrel MMBtu • million British thermal units
BBtu • billion British thermal units MMcf • million cubic feet
Bcf • billion cubic feet MMcfe • million cubic feet of natural gas equivalents
Bcfe • billion cubic feet of natural gas equivalents MMWh • thousand megawatt hours
LNG • liquefied natural gas MW • megawatt
MBbls • thousand barrels NGL • natural gas liquids
Mcf • thousand cubic feet TBtu • trillion British thermal units
Mcfe • thousand cubic feet of natural gas equivalents Tcfe • trillion cubic feet of natural gas equivalents
When we refer to natural gas and oil in quot;quot;equivalents,'' we are doing so to compare quantities of oil with quantities of
natural gas or to express these different commodities in a common unit. In calculating equivalents, we use a generally
recognized standard in which one Bbl of oil is equal to six Mcf of natural gas. Also, when we refer to cubic feet
measurements, all measurements are at a pressure of 14.73 pounds per square inch.
When we refer to quot;quot;us'', quot;quot;we'', quot;quot;our'', quot;quot;ours'', quot;quot;the Company'', or quot;quot;El Paso'', we are describing El Paso
Corporation and/or our subsidiaries.
i
3. PART I
ITEM 1. BUSINESS
Overview
We are an energy company, originally founded in 1928 in El Paso, Texas, with a stated purpose to provide
natural gas and related energy products in a safe, efficient and dependable manner. Our long-term business
strategy is focused on participating in the energy industry through a rate regulated natural gas transmission
business in North America and a large, independent exploration and production business operating both
domestically and internationally.
Natural Gas Transmission. We own North America's largest interstate pipeline system, which has
approximately 55,500 miles of pipe that connect North America's major producing basins to its major
consuming markets. We also own approximately 420 Bcf of storage capacity and an LNG import facility with
806 MMcf of daily base load sendout capacity.
Exploration and Production. Our exploration and production business is focused on the exploration for
and the acquisition, development and production of natural gas, oil and NGL in the United States and Brazil
and related marketing activities. As of December 31, 2005, we held an estimated 2.4 Tcfe of proved natural
gas and oil reserves in the United States and Brazil, exclusive of our equity share in the proved reserves of an
unconsolidated affiliate of 253 Bcfe.
Other. We currently own or have owned other non-core assets acquired as part of a number of mergers
and acquisitions and growth initiatives when we expanded from a regional gas pipeline company in the
mid-1990's to an international energy company by early 2001. Since 2003, a substantial portion of these assets
have been sold, have pending sales contracts or are in the process of being sold. The divestiture of these assets
was targeted at improving our operating results, financial condition and liquidity, which were negatively
impacted by the decline of the energy trading industry, bankruptcy of several energy industry participants and
our credit downgrades.
Business Objective and Strategy
As of December 31, 2005, we conduct our core natural gas transmission and exploration and production
operations through our Pipelines, Exploration and Production and Marketing and Trading segments. We also
have Power and Field Services segments. Our business segments provide a variety of energy products and
services and are managed separately as each segment requires different technology and marketing strategies. For
further discussion of our business segments, see the information below and in Part II, Item 7, Management's
Discussion and Analysis of Financial Condition and Results of Operations. For our segment operating results and
assets, see Part II, Item 8, Financial Statements and Supplementary Data, Note 20, which is incorporated herein
by reference. Our business strategy in each of our operating segments can be summarized as follows:
Pipelines Enhancing the value of our transmission business through
successful recontracting, continuous efficiency improvements
through cost management and prudent capital spending in the
United States and Mexico, while providing outstanding customer
service through safe operations.
Exploration and Production Growing our reserve base in a manner that creates shareholder
value through disciplined capital allocation, cost control and
portfolio management.
Marketing and Trading Marketing our natural gas and oil production at optimal prices
and managing associated price risks.
The assets remaining in our Power segment are used to serve customers under long-term power sales
contracts or sell power to the open market in spot market transactions. Additionally, through the remaining
assets in our Field Services segment, we provide processing and gathering services through two facilities that
support our Rocky Mountain production activities.
1
4. Pipelines Segment
Our Pipelines segment provides natural gas transmission and related services through eight separate,
wholly owned pipeline systems and four 50 percent owned systems that, combined, own or have interests in
approximately 55,500 miles of interstate natural gas pipelines, representing the largest integrated natural gas
transmission system in the United States. Our system connects the nation's principal natural gas supply
regions to the six largest consuming regions in the United States: the Gulf Coast, California, the northeast, the
midwest, the southwest and the southeast. Our pipeline operations include access to systems in Canada and
assets in Mexico. The size, connectivity and diversity of our U.S. pipeline system provides growth
opportunities through infrastructure development or large scale expansion projects and gives us the capability
to adapt to the dynamics of shifting supply and demand.
We also own or have interests in approximately 420 Bcf of storage capacity through our wholly owned
transmission systems and two wholly owned and three partially owned storage systems used to provide a
variety of flexible services to our customers. We also have one LNG receiving terminal and related facilities at
Elba Island, Georgia.
Each of our U.S. pipeline systems and storage facilities operate under Federal Energy Regulatory
Commission (FERC) approved tariffs that establish rates, cost recovery mechanisms, terms and conditions of
service to our customers. The fees or rates established under our tariffs are a function of our costs of providing
services to our customers, including a reasonable return on our invested capital. Our revenues from
transportation, storage, LNG terminalling and related services consist of two types of revenues:
Reservation revenues. Reservation revenues are from customers (referred to as firm customers)
that reserve capacity on our pipeline system, storage facilities or LNG terminalling facilities. These firm
customers are obligated to pay a monthly reservation or demand charge, regardless of the amount of
natural gas they transport or store, for the term of their contracts.
Usage revenues. Usage revenues are from both firm customers and interruptible customers (those
without reserved capacity) that pay usage charges based on the volume of gas actually transported,
stored, injected or withdrawn.
In 2005, approximately 79 percent of our revenues were attributable to reservation charges paid by firm
customers. The remaining 21 percent of our revenues were variable. Because of our regulated nature and the
2
5. high percentage of our revenues attributable to reservation charges, our revenues have historically been
relatively stable. However, our financial results can be subject to volatility due to factors such as changes in
natural gas prices and market conditions, regulatory actions, competition, weather and the creditworthiness of
our customers. We also experience volatility when the amounts of natural gas utilized in our operations differ
from the amounts we recover from our customers for that purpose.
Our strategy is to enhance the value of our transmission business through:
‚ Seeking to expand our systems by attracting new customers, markets or supply sources while leveraging
our existing assets to the extent possible;
‚ Recontracting or contracting available or expiring capacity and resolving open rate cases;
‚ Focusing on efficiency in our operations and cost control, including efficiencies that may be available
across our systems or due to the coast-to-coast scale of our operations;
‚ Investing in maintenance and pipeline integrity projects to maintain the value and ensure the safety of
our pipeline systems and assets;
‚ Providing outstanding customer service; and
‚ Providing natural gas transmission and related services through safe operations.
Wholly Owned Interstate Transmission Systems
Below is a further discussion of our wholly owned pipeline systems.
As of December 31, 2005
Average Throughput(1)
Transmission Supply and Miles of Design Storage
System Market Region Pipeline Capacity Capacity 2005 2004 2003
(MMcf/d) (Bcf) (BBtu/d)
Tennessee Gas Extends from Louisiana, the Gulf 14,100 6,876 90 4,443 4,469 4,710
Pipeline of Mexico and south Texas to the
(TGP) northeast section of the U.S.,
including the metropolitan areas of
New York City and Boston.
ANR Pipeline Extends from Louisiana, 10,500 6,775 192 4,100 4,067 4,232
(ANR) Oklahoma, Texas and the Gulf of
Mexico to the midwestern and
northeastern regions of the U.S.,
including the metropolitan areas of
Detroit, Chicago and Milwaukee.
5,650(2) Ì(3)
El Paso Natural Extends from the San Juan, 10,700 4,053 4,074 3,874
Gas (EPNG) Permian and Anadarko basins to
California, its single largest market,
as well as markets in Arizona,
Nevada, New Mexico, Oklahoma,
Texas and northern Mexico.
Southern Natural Extends from natural gas fields in 7,700 3,450 60 1,984 2,163 2,101
Gas (SNG) Texas, Louisiana, Mississippi,
Alabama and the Gulf of Mexico to
markets in Louisiana, Mississippi,
Alabama, Florida, Georgia, South
Carolina and Tennessee, including
the metropolitan areas of Atlanta
and Birmingham.
Colorado Extends from production areas in 4,000 3,000 29 1,902 1,744 1,685
Interstate Gas the Rocky Mountain region and
(CIG) the Anadarko Basin to the front
range of the Rocky Mountains and
multiple interconnections with
pipeline systems transporting gas
to the midwest, the southwest,
California and the Pacific
northwest.
3
6. As of December 31, 2005
Average Throughput(1)
Transmission Supply and Miles of Design Storage
System Market Region Pipeline Capacity Capacity 2005 2004 2003
(MMcf/d) (Bcf) (BBtu/d)
Wyoming Extends from western Wyoming 600 1,997 Ì 1,479 1,201 1,213
Interstate and the Powder River Basin to
(WIC) various pipeline interconnections
near Cheyenne, Wyoming.
Mojave Pipeline Connects with the EPNG system 400 407 Ì 161 161 192
(MPC) near Cadiz, California, the EPNG
and Transwestern systems at
Topock, Arizona and to the Kern
River Gas Transmission Company
system in California. This system
also extends to customers in the
vicinity of Bakersfield, California.
Cheyenne Plains Extends from the Cheyenne hub in 400 757 Ì 433 89 Ì
Gas Pipeline Colorado to various pipeline
(CPG) interconnections near Greensburg,
Kansas.
(1)
Includes throughput transported on behalf of affiliates.
(2)
This capacity reflects winter-sustainable west-flow capacity of 4,850 MMcf/d and approximately 800 MMcf/d of east-end delivery
capacity.
(3)
Effective January 1, 2006, EPNG began offering interruptible storage service from a storage facility that has a maximum working
capacity of up to approximately 44 Bcf.
4
7. We also have a number of pipeline expansion projects underway as of December 31, 2005, which are in
various stages of certification and approval. Below are the more significant projects that have been approved
by the FERC:
Anticipated
Project Capacity Description Completion Date
(MMcf/d)
ANR
Wisconsin 2006 164 To construct and operate a 3.8 mile, 30-inch pipeline November 2006
expansion extension of the Madison Lateral Loop, a 3.1 mile, 16-inch
pipeline loop(1) of the Little Chute Lateral in Outagamie
County, a 20,620 horsepower compressor station, a 2,370
horsepower compressor unit at the Janesville compressor
station, and upgrades of five existing meter stations in
various counties in Wisconsin.
TGP
Triple-T expansion 200 To construct 6.2 miles of 24-inch pipeline to extend its August 2006
existing 30-inch Triple-T Line, beginning in Eugene Island
Block 349, to interconnect with Enterprise Products
Partners' Anaconda System on the EI 371 platform, as well
as associated piping and other appurtenant facilities.
Northeast 49 To modify an existing dehydration tower, filed jointly with November 2006
ConneXion-NY/NJ National Fuel, serving the Hebron Storage Field in Potter
County, Pennsylvania, expand capacity on Line 300, located
in Bradford and Susquehanna Counties, Pennsylvania by
building 6 miles of loop(1) line, add compression facilities at
Compressor Station 313 in Potter County, Pennsylvania, and
at Station 317 in Bradford County, Pennsylvania, upgrade
Ramsey Meter Station in Bergen County, New Jersey, and
use additional incremental capacity resulting from the
replacement of compression facilities at Station 325 in
Sussex County, New Jersey.
Louisiana 850 To construct a 300 foot extension of its 20-inch Grand Isle October 2006
Deepwater Link supply lateral, construct 2,100 feet of 24-inch West Delta
supply lateral, abandon 3,100 feet of the 20-inch line
connected to the Grand Isle platform, and install
appurtenant facilities on Enterprise's Independence Hub
platform located in Mississippi Canyon Block 920.
WIC
Piceance Basin 333 To construct and operate approximately 142 miles of 24-inch March 2006
expansion pipeline, compression and metering facilities to move
additional supplies into the WIC system.
(1)
A loop is the installation of a pipeline, parallel to an existing pipeline, with tie-ins at several points along the existing pipeline. Looping
increases a transmission system's capacity.
5
8. Partially Owned Interstate Transmission Systems
As of December 31, 2005
Average Throughput(2)
Transmission Supply and Ownership Miles of Design
System(1) Interest Pipeline(2) Capacity(2)
Market Region 2005 2004 2003
(Percent) (MMcf/d) (BBtu/d)
Florida Gas Extends from south Texas to south 50 4,867 2,090 1,916 2,014 1,963
Transmission(3) Florida.
Great Lakes Gas Extends from the Manitoba- 50 2,115 2,500 2,376 2,200 2,366
Transmission Minnesota border to the Michigan-
Ontario border at St. Clair, Michigan.
Samalayuca Pipeline Extends from U.S.-Mexico border to 50 23 460 423 433 409
and Gloria a Dios the State of Chihuahua, Mexico.
Compression Station
San Fernando Pipeline Extends from Pemex Compression 50 71 1,000 951 951 130
Station 19 to the Pemex metering
station in San Fernando, Mexico in
the State of Tamaulipas.
(1)
These systems are accounted for as equity investments.
(2)
Miles, volumes and average throughput represent the systems' totals and are not adjusted for our ownership interest.
(3)
We have a 50 percent equity interest in Citrus Corporation, which owns this system.
We also have a 50 percent interest in Wyco Development, L.L.C. Wyco owns the Front Range Pipeline, a
state-regulated gas pipeline extending from the Cheyenne Hub to Public Service Company of Colorado's
(PSCo) Fort St. Vrain electric generation plant, and compression facilities on WIC's Medicine Bow lateral.
These facilities are leased to PSCo and WIC, respectively, under long-term leases.
Underground Natural Gas Storage Entities
In addition to the storage capacity on our transmission systems, we own or have interests in the following
natural gas storage entities:
As of December 31, 2005
Ownership Storage
Capacity(1)
Storage Entity Interest Location
(Percent) (Bcf)
Bear Creek Storage ÏÏÏÏÏÏÏÏÏÏÏÏÏÏÏÏÏÏÏÏÏÏÏÏÏÏÏÏÏÏÏÏÏÏ 100 58 Louisiana
ANR Storage ÏÏÏÏÏÏÏÏÏÏÏÏÏÏÏÏÏÏÏÏÏÏÏÏÏÏÏÏÏÏÏÏÏÏÏÏÏÏÏ 100 56 Michigan
Blue Lake Gas Storage ÏÏÏÏÏÏÏÏÏÏÏÏÏÏÏÏÏÏÏÏÏÏÏÏÏÏÏÏÏÏÏ 75 47 Michigan
Eaton Rapids Gas Storage(2) ÏÏÏÏÏÏÏÏÏÏÏÏÏÏÏÏÏÏÏÏÏÏÏÏÏÏÏ 50 13 Michigan
Young Gas Storage(2) ÏÏÏÏÏÏÏÏÏÏÏÏÏÏÏÏÏÏÏÏÏÏÏÏÏÏÏÏÏÏÏÏ 48 6 Colorado
(1)
Includes a total of 133 Bcf contracted to affiliates. Storage capacity is under long-term contracts and is not adjusted for our
ownership interest.
(2)
These systems were accounted for as equity investments as of December 31, 2005.
LNG Facility
In addition to our pipeline systems and storage facilities, we own an LNG receiving terminal located on
Elba Island, near Savannah, Georgia. The recently completed expansion of the Elba Island facility increased
the peak sendout capacity to 1,215 MMcf/d and the base load sendout capacity to 806 MMcf/d. The capacity
at the terminal is contracted with subsidiaries of British Gas Group and Royal Dutch Shell PLC.
6
9. Markets and Competition
We provide natural gas services to a variety of customers, including natural gas producers, marketers,
end-users and other natural gas transmission, distribution and electric generation companies. In performing
these services, we compete with other pipeline service providers as well as alternative energy sources such as
coal, nuclear and hydroelectric power generation and fuel oil for heating.
Imported LNG is one of the fastest growing supply sectors of the natural gas market. Terminals and other
regasification facilities can serve as important sources of supply for pipelines, enhancing their delivery
capabilities and operational flexibility and complementing traditional supply transported into market areas.
However, these LNG delivery systems also may compete with our pipelines for transportation of gas into
market areas we serve.
Electric power generation is the fastest growing demand sector of the natural gas market. The growth of
the electric power industry potentially benefits the natural gas industry by creating more demand for natural
gas turbine generated electric power. This effect is offset, in varying degrees, by increased generation
efficiency, the more effective use of surplus electric capacity and increased natural gas prices. In addition, in
several regions of the country, new additions in electric generating capacity have exceeded load growth and
electric transmission capabilities out of those regions. These developments may inhibit owners of new power
generation facilities from signing firm contracts with pipelines.
Our existing contracts mature at various times and in varying amounts of throughput capacity. Our ability
to extend our existing contracts or remarket expiring capacity is dependent on competitive alternatives, the
regulatory environment at the federal, state and local levels and market supply and demand factors at the
relevant dates these contracts are extended or expire. The duration of new or renegotiated contracts will be
affected by current prices, competitive conditions and judgments concerning future market trends and
volatility. Subject to regulatory requirements, we attempt to recontract or remarket our capacity at the rates
allowed under our tariffs although, at times, we discount these rates to remain competitive. The level of
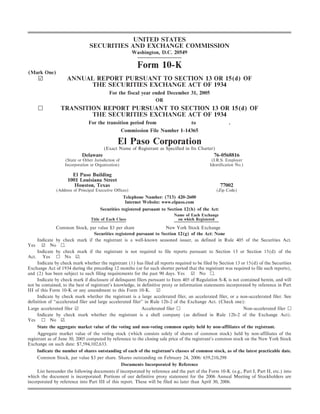
discount varies for each of our pipeline systems. The table below shows the contracted capacity that expires by
year over the next five years and thereafter.
Contract Expirations
36%
12,000 11,270
11,000
10,000
9,000
8,000
MDth/d
19%
7,000
5,874
6,000 14%
14%
4,523
4,437
5,000
9% 8%
4,000
2,931 2,613
3,000
2,000
1,000
0
2006 2007 2008 2009 2010 Beyond
7
10. The following table details the markets we serve and the competition faced by each of our wholly owned
pipeline transmission systems as of December 31, 2005:
TGP
Customer Information Contract Information Competition
Approximately 466 firm and Approximately 481 firm transportation TGP faces strong competition in the northeast,
interruptible customers, none contracts. Weighted average remaining Appalachian, midwest and southeast market areas.
of which individually contract term of approximately five years. It competes with other interstate and intrastate
represents more than pipelines for deliveries to multiple-connection
10 percent of revenues customers who can take deliveries at alternative
points. Natural gas delivered on the TGP system
competes with alternative energy sources such as
electricity, hydroelectric power, coal and fuel oil. In
addition, TGP competes with pipelines and
gathering systems for connection to new supply
sources in Texas, the Gulf of Mexico and from the
Canadian border.
In the offshore areas of the Gulf of Mexico, factors
such as the distance of the supply fields from the
pipeline, relative basis pricing of the pipeline receipt
points, and costs of intermediate gathering or
required processing of the natural gas to be
transported may influence determinations of whether
natural gas is ultimately attached to our system.
ANR
Customer Information Contract Information Competition
Approximately 297 firm and Approximately 634 firm transportation ANR's principal markets are in the midwest where
interruptible customers contracts. Weighted average remaining it competes with other interstate and intrastate
contract term of approximately five years. pipeline companies and local distribution companies
to provide natural gas transportation and storage
services. ANR competes directly with other
Major Customer: interstate pipelines, including Guardian Pipeline, for
We Energies markets in Wisconsin. We Energies owns an interest
(829 BBtu/d) Contract terms expire in 2006-2010. in Guardian, which is currently serving a portion of
its firm transportation requirements. ANR also
competes directly with other interstate pipelines in
the midwest market to serve electric generation and
local distribution companies.
ANR also competes directly with numerous
pipelines and gathering systems for access to new
supply sources. ANR's principal supply sources are
the Rockies and mid-continent production accessed
in Kansas and Oklahoma, western Canadian
production delivered to Wisconsin and the Chicago
area and Gulf of Mexico sources, including
deepwater production and LNG imports.
8
11. EPNG
Customer Information Contract Information Competition
Approximately 163 firm and Approximately 251 firm transportation EPNG faces competition in the west and southwest
interruptible customers contracts. Weighted average remaining from other existing and proposed pipelines, from
contract term of approximately four years. California storage facilities, and alternative energy
sources that are used to generate electricity such as
hydroelectric power, nuclear, coal and fuel oil. In
Major Customers: addition, initiatives to bring LNG into California
Southern California Gas and northern Mexico are underway.
Company
(453 BBtu/d) Contract term expires in 2006.
(93 BBtu/d) Contract term expire in 2007.
(768 BBtu/d) Contract terms expire in 2009-2011.
Southwest Gas Corporation
(12 BBtu/d) Contract term expires in 2006.
(470 BBtu/d) Contract term expires in 2011.
(74 BBtu/d) Contract term expires in 2015.
SNG
Customer Information Contract Information Competition
Approximately 225 firm Approximately 181 firm transportation SNG faces strong competition in a number of its
and interruptible contracts. Weighted average remaining key markets. SNG competes with other interstate
customers contract term of approximately six years. and intrastate pipelines for deliveries to multiple-
connection customers who can take deliveries at
alternative points. Natural gas delivered on our
Major Customers: system competes with alternative energy sources
Atlanta Gas Light Company used to generate electricity, such as hydroelectric
(959 BBtu/d) Contract terms expire in 2008-2015. power, coal and fuel oil. SNG's four largest
Southern Company Services customers are able to obtain a significant portion of
(418 BBtu/d) Contract terms expire in 2010-2018. their natural gas requirements through transportation
Alabama Gas Corporation from other pipelines. Also, SNG competes with
(415 BBtu/d) Contract terms expire in 2006-2013. several pipelines for the transportation business of
Scana Corporation their other customers. In addition, SNG competes
(346 BBtu/d) Contract terms expire in 2006-2019. with pipelines and gathering systems for connection
to new supply services.
CIG
Customer Information Contract Information Competition
Approximately 111 firm and Approximately 184 firm transportation CIG serves two major markets. Its quot;quot;on-system''
interruptible customers contracts. Weighted average remaining market consists of utilities and other customers
contract term of approximately five years. located along the front range of the Rocky
Mountains in Colorado and Wyoming. Its quot;quot;off-
Major Customer: system'' market consists of the transportation of
Public Service Company of Rocky Mountain production from multiple supply
Colorado basins to interconnections with other pipelines bound
(970 BBtu/d) Contract terms expire in 2007. for the midwest, the southwest, California and the
(187 BBtu/d) Contract term expires in 2008. Pacific northwest. Competition for its on-system
(261 BBtu/d) Contract terms expires in 2009-2014. market consists of an intrastate pipeline, local
production from the Denver-Julesburg basin, and
long-haul shippers who elect to sell into this market
rather than the off-system market. Competition for
its off-system market consists of other existing and
proposed interstate pipelines that are directly
connected to its supply sources.
9
12. WIC
Customer Information Contract Information Competition
Approximately 47 firm Approximately 47 firm transportation WIC competes with pipelines that are existing,
and interruptible contracts. Weighted average remaining proposed and currently under construction to provide
customers contract term of approximately six years. transportation services to delivery points in northeast
Colorado and western Wyoming. WIC's one Bcf/d
Medicine Bow lateral is the primary source of
transportation for increasing volumes of Powder
Major Customers: River Basin supply and can readily be expanded as
Williams Power Company supply increases. Currently, there are two other
(353 BBtu/d) Contract terms expire in 2008-2013. interstate pipelines that transport limited volumes
CIG out of this basin.
(247 BBtu/d) Contract terms expire in 2006-2016.
Western Gas Resources
(235 BBtu/d) Contract terms expire in 2007-2013.
Cantera Gas Company
(226 BBtu/d) Contract terms expire in 2012-2013.
MPC
Customer Information Contract Information Competition
Approximately 13 firm and Approximately six firm transportation MPC faces competition from other existing and
interruptible customers contracts. Weighted average remaining proposed pipelines, and alternative energy sources
contract term of approximately eight that are used to generate electricity such as
years. hydroelectric power, nuclear, coal and fuel oil. In
addition, initiatives to bring LNG into California
Major Customers: and northern Mexico are underway.
EPNG
(312 BBtu/d)
Los Angeles Department Contract term expires in 2015.
of Water and Power
(50 BBtu/d)
Contract term expires in 2007.
CPG
Customer Information Contract Information Competition
Approximately 20 firm and Approximately 16 firm transportation CPG competes directly with other interstate
interruptible customers contracts Weighted average remaining pipelines serving the mid-continent region.
contract term of approximately nine Indirectly, CPG competes with other existing and
years. proposed interstate pipelines that transport Rocky
Mountain gas to other markets.
Major Customers:
Oneok Energy Services
Company L.P.
(195 BBtu/d) Contract terms expire in 2015.
Anadarko Energy Service
Company
(112 BBtu/d) Contract terms expire in 2015-2016.
Encana Marketing
(USA) Inc.
(170 BBtu/d) Contract term expires in 2015.
Kerr McGee
(83 BBtu/d) Contract terms expire in 2015.
10
13. Exploration and Production Segment
Our Exploration and Production segment's long-term business strategy focuses on the exploration for and
the acquisition, development and production of natural gas, oil and NGL in the United States and
internationally. As of December 31, 2005, we controlled over 3 million net leasehold acres. During 2005, daily
equivalent natural gas production averaged approximately 743 MMcfe/d and our proved natural gas and oil
reserves at December 31, 2005, were approximately 2.4 Tcfe, excluding amounts related to our unconsolidated
investment in Four Star Oil & Gas Company (Four Star).
Our consolidated operations are divided into the following regions:
Region Operating Areas/Basins
United States
Onshore ÏÏÏÏÏÏÏÏÏÏÏÏÏÏÏÏÏÏÏÏÏÏÏÏÏÏÏÏÏÏÏÏÏÏÏ East Texas and North Louisiana
Rocky Mountains
Black Warrior
Arkoma
Raton
Illinois
Texas Gulf Coast ÏÏÏÏÏÏÏÏÏÏÏÏÏÏÏÏÏÏÏÏÏÏÏÏÏÏÏ South Texas
Gulf of Mexico and south Louisiana ÏÏÏÏÏÏÏÏÏÏÏ Gulf of Mexico (Federal and State waters)
South Louisiana
Internationally
Brazil ÏÏÏÏÏÏÏÏÏÏÏÏÏÏÏÏÏÏÏÏÏÏÏÏÏÏÏÏÏÏÏÏÏÏÏÏÏ Camamu, Santos, Espirito Santo and
Potiguar
In addition to our consolidated operations, we own a 43.1 percent interest in Four Star, which was
acquired in connection with our acquisition of Medicine Bow Energy Corporation (Medicine Bow). Four Star
operates onshore in the San Juan, Permian, Hugoton and South Alabama Basins and the Gulf of Mexico.
During 2005, our proportionate share of Four Star's daily equivalent natural gas production averaged
approximately 24 MMcfe/d and at December 31, 2005, proved natural gas and oil reserves, net to our interest,
were 253 Bcfe.
Our business strategy has been to create value through our drilling activities and through acquisitions of
assets and companies. For 2006, we expect our growth to occur principally through drilling activities.
However, we believe strategic acquisitions can support our corporate objectives by:
‚ Re-shaping our portfolio toward longer-lived, shallower decline rate reserves;
‚ Leveraging operational expertise we already possess in key operating areas, geologies or techniques;
‚ Balancing our exposure to regions, basins and commodities;
‚ Achieving risk-adjusted returns competitive with those available within our existing inventory; and
‚ Increasing our reserves more rapidly by supplementing drilling activities.
11
14. Natural Gas and Oil Properties
Natural Gas, Oil and Condensate and NGL Reserves and Production
The tables below present our estimated proved reserves as of December 31, 2005 and our 2005 production
by region and summarizes our estimated proved reserves by classification as of December 31, 2005:
Net Proved Reserves(1)
2005
Total
Natural Gas Oil/Condensate NGL Production
(MMcf) (MBbls) (MBbls) (MMcfe) (Percent) (MMcfe)
Reserves and Production by Region
United States(2)
OnshoreÏÏÏÏÏÏÏÏÏÏÏÏÏÏÏÏÏÏÏÏÏÏÏÏ 1,258,329 32,007 1,207 1,457,615 60% 109,361
Texas Gulf Coast ÏÏÏÏÏÏÏÏÏÏÏÏÏÏÏÏ 392,783 2,765 9,702 467,580 20% 77,014
Gulf of Mexico and south Louisiana 179,654 8,456 1,653 240,311 10% 65,432
Total United States ÏÏÏÏÏÏÏÏÏÏÏÏÏÏ 1,830,766 43,228 12,562 2,165,506 90% 251,807
BrazilÏÏÏÏÏÏÏÏÏÏÏÏÏÏÏÏÏÏÏÏÏÏÏÏÏÏÏÏ 56,388 32,250 Ì 249,890 10% 19,300
Total ÏÏÏÏÏÏÏÏÏÏÏÏÏÏÏÏÏÏÏÏÏÏÏÏÏÏ 1,887,154 75,478 12,562 2,415,396 100% 271,107
Unconsolidated investment in
Four Star(3)(4) ÏÏÏÏÏÏÏÏÏÏÏÏÏÏÏÏÏÏÏ 192,895 3,349 6,668 252,996 100% 8,844
Reserves by Classification
United States(2)
Producing ÏÏÏÏÏÏÏÏÏÏÏÏÏÏÏÏÏÏÏÏÏÏ 1,175,838 19,831 9,503 1,351,841 63%
Non-Producing ÏÏÏÏÏÏÏÏÏÏÏÏÏÏÏÏÏÏ 228,173 8,750 1,507 289,716 13%
UndevelopedÏÏÏÏÏÏÏÏÏÏÏÏÏÏÏÏÏÏÏÏ 426,755 14,647 1,552 523,949 24%
Total proved ÏÏÏÏÏÏÏÏÏÏÏÏÏÏÏÏÏÏ 1,830,766 43,228 12,562 2,165,506 100%
Brazil
Producing ÏÏÏÏÏÏÏÏÏÏÏÏÏÏÏÏÏÏÏÏÏÏ 17,260 632 Ì 21,052 9%
Non-Producing ÏÏÏÏÏÏÏÏÏÏÏÏÏÏÏÏÏÏ 10,162 512 Ì 13,234 5%
UndevelopedÏÏÏÏÏÏÏÏÏÏÏÏÏÏÏÏÏÏÏÏ 28,966 31,106 Ì 215,604 86%
Total proved ÏÏÏÏÏÏÏÏÏÏÏÏÏÏÏÏÏÏ 56,388 32,250 Ì 249,890 100%
Worldwide
Producing ÏÏÏÏÏÏÏÏÏÏÏÏÏÏÏÏÏÏÏÏÏÏ 1,193,098 20,463 9,503 1,372,893 57%
Non-Producing ÏÏÏÏÏÏÏÏÏÏÏÏÏÏÏÏÏÏ 238,335 9,262 1,507 302,950 12%
UndevelopedÏÏÏÏÏÏÏÏÏÏÏÏÏÏÏÏÏÏÏÏ 455,721 45,753 1,552 739,553 31%
Total proved ÏÏÏÏÏÏÏÏÏÏÏÏÏÏÏÏÏÏ 1,887,154 75,478 12,562 2,415,396 100%
Unconsolidated investment in
Four Star(3)
Producing ÏÏÏÏÏÏÏÏÏÏÏÏÏÏÏÏÏÏÏÏÏÏ 154,979 3,246 5,371 206,677 82%
Non-Producing ÏÏÏÏÏÏÏÏÏÏÏÏÏÏÏÏÏÏ 3,105 20 28 3,395 1%
UndevelopedÏÏÏÏÏÏÏÏÏÏÏÏÏÏÏÏÏÏÏÏ 34,811 83 1,269 42,924 17%
Total Four Star ÏÏÏÏÏÏÏÏÏÏÏÏÏÏÏ 192,895 3,349 6,668 252,996 100%
(1)
Net proved reserves exclude our Power segment's equity interests in proved reserves in Indonesia and in Peru of 162,254 MMcf of
natural gas and 2,058 MBbls of oil, condensate and NGL for total natural gas equivalents of 174,600 MMcfe, all net to our ownership
interests. Our Power segment has completed or expects to complete the sale of these equity interests in 2006.
(2)
Net proved reserves exclude royalties and interests owned by others and reflect contractual arrangements and royalty obligations in
effect at the time of the estimate.
(3)
Our share of Four Star's proved reserves has been estimated based on an evaluation of those reserves by El Paso's internal reservoir
engineers and not by engineers of Four Star. An independent reservoir engineering firm, Ryder Scott, which was engaged by us,
prepared an estimate on 86 percent of Four Star's proved reserves. Based on the amount of Four Star's proved reserves determined by
Ryder Scott, we believe our reported reserve amounts are reasonable.
(4)
Represents our proportionate share of Four Star's production since the acquisition date.
12
15. Consolidated reserve information in the tables above is based on our internal reserve report. Ryder Scott,
an independent petroleum engineering firm that reports to the Audit Committee of our Board of Directors,
prepared an estimate on 92 percent of our natural gas and oil reserves. Based on the amount of proved reserves
determined by Ryder Scott, we believe our reported reserve amounts are reasonable. This information is
consistent with estimates of reserves filed with other federal agencies except for differences of less than five
percent resulting from actual production, acquisitions, property sales, necessary reserve revisions and additions
to reflect actual experience.
There are numerous uncertainties inherent in estimating quantities of proved reserves, projecting future
rates of production costs, and projecting the timing of development expenditures, including many factors
beyond our control. Reservoir engineering is a subjective process of estimating underground accumulations of
natural gas and oil that cannot be measured in an exact manner. The reserve data represents only estimates
which are often different from the quantities of natural gas and oil that are ultimately recovered. The accuracy
of any reserve estimate is highly dependent on the quality of available data, the accuracy of the assumptions on
which they are based, and on engineering and geological interpretations and judgment.
All estimates of proved reserves are determined according to the rules prescribed by the SEC. These rules
indicate that the standard of quot;quot;reasonable certainty'' be applied to proved reserve estimates. This concept of
reasonable certainty implies that as more technical data becomes available, a positive, or upward, revision is
more likely than a negative, or downward, revision. Estimates are subject to revision based upon a number of
factors, including reservoir performance, prices, economic conditions and government restrictions. In addition,
results of drilling, testing and production subsequent to the date of an estimate may justify revision of that
estimate.
In general, the volume of production from natural gas and oil properties we own declines as reserves are
depleted. Except to the extent we conduct successful exploration and development activities or acquire
additional properties containing proved reserves, or both, our proved reserves will decline as reserves are
produced. Recovery of proved undeveloped reserves requires significant capital expenditures and successful
drilling operations. The reserve data assumes that we can and will make these expenditures and conduct these
operations successfully, but future events, including commodity price changes, may cause these assumptions
to change. In addition, estimates of proved undeveloped reserves and proved non-producing reserves are
subject to greater uncertainties than estimates of proved producing reserves. For further discussion of our
reserves, see Part II, Item 8, Financial Statements and Supplementary Data, under the heading Supplemental
Natural Gas and Oil Operations.
13
16. Acreage and Wells
Our properties are primarily in the United States and are separated into the Onshore, Texas Gulf Coast and
Gulf of Mexico and south Louisiana regions. We also have properties internationally in Brazil. The following tables
detail (i) our interest in developed and undeveloped acreage at December 31, 2005, (ii) our interest in natural gas
and oil wells at December 31, 2005 and (iii) our exploratory and development wells drilled during the years 2003
through 2005. Any acreage in which our interest is limited to owned royalty, overriding royalty and other similar
interests is excluded.
Developed Undeveloped Total
Acreage
Gross(1) Net(2) Gross(1) Net(2) Gross(1) Net(2)
United States
Onshore ÏÏÏÏÏÏÏÏÏÏÏÏÏÏÏÏÏÏÏÏÏÏÏÏÏÏÏÏÏÏÏÏÏÏ 867,392 518,892 1,591,543 1,216,552 2,458,935 1,735,444
Texas Gulf Coast ÏÏÏÏÏÏÏÏÏÏÏÏÏÏÏÏÏÏÏÏÏÏÏÏÏÏ 103,234 79,439 151,751 109,241 254,985 188,680
Gulf of Mexico and south Louisiana ÏÏÏÏÏÏÏÏÏÏ 530,464 362,938 540,972 494,481 1,071,436 857,419
Total ÏÏÏÏÏÏÏÏÏÏÏÏÏÏÏÏÏÏÏÏÏÏÏÏÏÏÏÏÏÏÏÏÏÏÏ 1,501,090 961,269 2,284,266 1,820,274 3,785,356 2,781,543
Brazil ÏÏÏÏÏÏÏÏÏÏÏÏÏÏÏÏÏÏÏÏÏÏÏÏÏÏÏÏÏÏÏÏÏÏÏÏÏÏ 49,262 17,242 1,157,268 346,788 1,206,530 364,030
Worldwide Total ÏÏÏÏÏÏÏÏÏÏÏÏÏÏÏÏÏÏÏÏÏÏÏÏÏ 1,550,352 978,511 3,441,534 2,167,062 4,991,886 3,145,573
In the United States, our net developed acreage is concentrated primarily in the Gulf of Mexico (38 percent), Utah
(12 percent), Texas (10 percent), Oklahoma (9 percent), Alabama (8 percent), New Mexico (8 percent) and Louisiana
(6 percent). Our net undeveloped acreage is concentrated primarily in New Mexico (27 percent), the Gulf of Mexico
(22 percent), Wyoming (10 percent), Louisiana (7 percent), Texas (7 percent), West Virginia (7 percent), Indiana
(6 percent) and Alabama (5 percent). Approximately 14 percent, 13 percent and 10 percent of our total United States net
undeveloped acreage is held under leases that have minimum remaining primary terms expiring in 2006, 2007 and 2008.
Approximately 24 percent, 21 percent and 14 percent of our total Brazilian net undeveloped acreage is held under leases
that have minimum remaining primary terms expiring in 2006, 2007 and 2008.
Number of Wells
Productive Being Drilled at
Natural Gas Productive Oil Total Productive December 31,
Wells Wells Wells 2005
Productive Wells
Gross(1) Net(2) Gross(1) Net(2) Gross(1) Net(2)(3) Gross(1) Net(2)
United States
Onshore ÏÏÏÏÏÏÏÏÏÏÏÏÏÏÏÏÏÏÏÏÏÏÏ 3,424 2,614 514 363 3,938 2,977 36 29
Texas Gulf CoastÏÏÏÏÏÏÏÏÏÏÏÏÏÏÏÏ 831 702 Ì Ì 831 702 Ì Ì
Gulf of Mexico and south Louisiana 175 115 53 35 228 150 4 1
Total United States ÏÏÏÏÏÏÏÏÏÏÏÏ 4,430 3,431 567 398 4,997 3,829 40 30
BrazilÏÏÏÏÏÏÏÏÏÏÏÏÏÏÏÏÏÏÏÏÏÏÏÏÏÏÏÏ 4 3 6 5 10 8 Ì Ì
Worldwide Total ÏÏÏÏÏÏÏÏÏÏÏÏÏÏ 4,434 3,434 573 403 5,007 3,837 40 30
Net Exploratory Net Development
Wells Drilled(2) Wells Drilled(2)
Wells Drilled
2005 2004 2003 2005 2004 2003
United States
ProductiveÏÏÏÏÏÏÏÏÏÏÏÏÏÏÏÏÏÏÏÏÏÏÏÏÏÏÏÏÏÏÏÏÏÏÏÏÏÏÏÏÏÏÏÏÏÏÏÏÏÏÏÏ 86 13 54 279 298 272
Dry ÏÏÏÏÏÏÏÏÏÏÏÏÏÏÏÏÏÏÏÏÏÏÏÏÏÏÏÏÏÏÏÏÏÏÏÏÏÏÏÏÏÏÏÏÏÏÏÏÏÏÏÏÏÏÏÏÏ 2 10 22 4 3 1
Total ÏÏÏÏÏÏÏÏÏÏÏÏÏÏÏÏÏÏÏÏÏÏÏÏÏÏÏÏÏÏÏÏÏÏÏÏÏÏÏÏÏÏÏÏÏÏÏÏÏÏÏÏÏÏ 88 23 76 283 301 273
Brazil
ProductiveÏÏÏÏÏÏÏÏÏÏÏÏÏÏÏÏÏÏÏÏÏÏÏÏÏÏÏÏÏÏÏÏÏÏÏÏÏÏÏÏÏÏÏÏÏÏÏÏÏÏÏÏ Ì Ì 2 Ì Ì Ì
Dry ÏÏÏÏÏÏÏÏÏÏÏÏÏÏÏÏÏÏÏÏÏÏÏÏÏÏÏÏÏÏÏÏÏÏÏÏÏÏÏÏÏÏÏÏÏÏÏÏÏÏÏÏÏÏÏÏÏ Ì 1 4 Ì Ì Ì
Total ÏÏÏÏÏÏÏÏÏÏÏÏÏÏÏÏÏÏÏÏÏÏÏÏÏÏÏÏÏÏÏÏÏÏÏÏÏÏÏÏÏÏÏÏÏÏÏÏÏÏÏÏÏÏ Ì 1 6 Ì Ì Ì
Worldwide
ProductiveÏÏÏÏÏÏÏÏÏÏÏÏÏÏÏÏÏÏÏÏÏÏÏÏÏÏÏÏÏÏÏÏÏÏÏÏÏÏÏÏÏÏÏÏÏÏÏÏÏÏÏÏ 86 13 56 279 298 272
Dry ÏÏÏÏÏÏÏÏÏÏÏÏÏÏÏÏÏÏÏÏÏÏÏÏÏÏÏÏÏÏÏÏÏÏÏÏÏÏÏÏÏÏÏÏÏÏÏÏÏÏÏÏÏÏÏÏÏ 2 11 26 4 3 1
Total ÏÏÏÏÏÏÏÏÏÏÏÏÏÏÏÏÏÏÏÏÏÏÏÏÏÏÏÏÏÏÏÏÏÏÏÏÏÏÏÏÏÏÏÏÏÏÏÏÏÏÏÏÏÏ 88 24 82 283 301 273
(1)
Gross interest reflects the total acreage or wells we participated in, regardless of our ownership interest in the acreage or wells.
(2)
Net interest is the aggregate of the fractional working interests that we have in the gross acreage, gross wells or gross drilled wells.
(3)
At December 31, 2005, we operated 3,541 of the 3,841 net productive wells.
14
17. The drilling performance above should not be considered indicative of future drilling performance, nor
should it be assumed that there is any correlation between the number of productive wells drilled and the
amount of natural gas and oil that may ultimately be recovered.
Net Production, Sales Prices, Transportation and Production Costs
The following table details our net production volumes, average sales prices received, average
transportation costs, average production costs and production taxes associated with the sale of natural gas and
oil for each of the three years ended December 31:
2005 2004 2003
Net Production Volumes
United States
Natural gas (MMcf) ÏÏÏÏÏÏÏÏÏÏÏÏÏÏÏÏÏÏÏÏÏÏÏÏÏÏÏÏÏÏ 206,714 238,009 338,762
Oil, condensate and NGL (MBbls) ÏÏÏÏÏÏÏÏÏÏÏÏÏÏÏÏÏÏ 7,516 8,498 11,778
Total (MMcfe) ÏÏÏÏÏÏÏÏÏÏÏÏÏÏÏÏÏÏÏÏÏÏÏÏÏÏÏÏÏÏÏ 251,807 288,994 409,432
Brazil
Natural gas (MMcf) ÏÏÏÏÏÏÏÏÏÏÏÏÏÏÏÏÏÏÏÏÏÏÏÏÏÏÏÏÏÏ 15,578 6,848 Ì
Oil, condensate and NGL (MBbls) ÏÏÏÏÏÏÏÏÏÏÏÏÏÏÏÏÏÏ 620 320 Ì
Total (MMcfe) ÏÏÏÏÏÏÏÏÏÏÏÏÏÏÏÏÏÏÏÏÏÏÏÏÏÏÏÏÏÏÏ 19,300 8,772 Ì
Worldwide
Natural gas (MMcf) ÏÏÏÏÏÏÏÏÏÏÏÏÏÏÏÏÏÏÏÏÏÏÏÏÏÏÏÏÏÏ 222,292 244,857 338,762
Oil, condensate and NGL (MBbls) ÏÏÏÏÏÏÏÏÏÏÏÏÏÏÏÏÏÏ 8,136 8,818 11,778
Total (MMcfe) ÏÏÏÏÏÏÏÏÏÏÏÏÏÏÏÏÏÏÏÏÏÏÏÏÏÏÏÏÏÏÏ 271,107 297,766 409,432
Natural Gas Average Realized Sales Price ($/Mcf)(1)
United States
Excluding hedges ÏÏÏÏÏÏÏÏÏÏÏÏÏÏÏÏÏÏÏÏÏÏÏÏÏÏÏÏÏÏÏÏÏ $ 7.92 $ 6.02 $ 5.51
Including hedges ÏÏÏÏÏÏÏÏÏÏÏÏÏÏÏÏÏÏÏÏÏÏÏÏÏÏÏÏÏÏÏÏÏÏ $ 6.69 $ 5.94 $ 5.40
Brazil
Excluding hedges ÏÏÏÏÏÏÏÏÏÏÏÏÏÏÏÏÏÏÏÏÏÏÏÏÏÏÏÏÏÏÏÏÏ $ 2.33 $ 2.01 $ Ì
Including hedges ÏÏÏÏÏÏÏÏÏÏÏÏÏÏÏÏÏÏÏÏÏÏÏÏÏÏÏÏÏÏÏÏÏÏ $ 2.33 $ 2.01 $ Ì
Worldwide
Excluding hedges ÏÏÏÏÏÏÏÏÏÏÏÏÏÏÏÏÏÏÏÏÏÏÏÏÏÏÏÏÏÏÏÏÏ $ 7.53 $ 5.90 $ 5.51
Including hedges ÏÏÏÏÏÏÏÏÏÏÏÏÏÏÏÏÏÏÏÏÏÏÏÏÏÏÏÏÏÏÏÏÏÏ $ 6.39 $ 5.83 $ 5.40
Oil, Condensate, and NGL Average Realized Sales Price
($/Bbl)(1)
United States
Excluding hedges ÏÏÏÏÏÏÏÏÏÏÏÏÏÏÏÏÏÏÏÏÏÏÏÏÏÏÏÏÏÏÏÏÏ $ 45.86 $ 34.44 $ 26.64
Including hedges ÏÏÏÏÏÏÏÏÏÏÏÏÏÏÏÏÏÏÏÏÏÏÏÏÏÏÏÏÏÏÏÏÏÏ $ 45.86 $ 34.44 $ 25.96
Brazil
Excluding hedges ÏÏÏÏÏÏÏÏÏÏÏÏÏÏÏÏÏÏÏÏÏÏÏÏÏÏÏÏÏÏÏÏÏ $ 53.42 $ 43.01 $ Ì
Including hedges ÏÏÏÏÏÏÏÏÏÏÏÏÏÏÏÏÏÏÏÏÏÏÏÏÏÏÏÏÏÏÏÏÏÏ $ 42.42 $ 39.19 $ Ì
Worldwide
Excluding hedges ÏÏÏÏÏÏÏÏÏÏÏÏÏÏÏÏÏÏÏÏÏÏÏÏÏÏÏÏÏÏÏÏÏ $ 46.43 $ 34.75 $ 26.64
Including hedges ÏÏÏÏÏÏÏÏÏÏÏÏÏÏÏÏÏÏÏÏÏÏÏÏÏÏÏÏÏÏÏÏÏÏ $ 45.60 $ 34.61 $ 25.96
Average Transportation Cost
United States
Natural gas ($/Mcf) ÏÏÏÏÏÏÏÏÏÏÏÏÏÏÏÏÏÏÏÏÏÏÏÏÏÏÏÏÏÏ $ 0.20 $ 0.17 $ 0.18
Oil, condensate and NGL ($/Bbl)ÏÏÏÏÏÏÏÏÏÏÏÏÏÏÏÏÏÏÏ $ 0.69 $ 1.16 $ 1.05
Worldwide
Natural gas ($/Mcf) ÏÏÏÏÏÏÏÏÏÏÏÏÏÏÏÏÏÏÏÏÏÏÏÏÏÏÏÏÏÏ $ 0.18 $ 0.17 $ 0.18
Oil, condensate and NGL ($/Bbl)ÏÏÏÏÏÏÏÏÏÏÏÏÏÏÏÏÏÏÏ $ 0.63 $ 1.12 $ 1.05
15
18. 2005 2004 2003
Average Production Cost($/Mcfe)(2)
United States
Average lease operating cost ÏÏÏÏÏÏÏÏÏÏÏÏÏÏÏÏÏÏÏÏÏÏÏÏ $ 0.73 $ 0.62 $ 0.42
Average production taxes ÏÏÏÏÏÏÏÏÏÏÏÏÏÏÏÏÏÏÏÏÏÏÏÏÏÏÏ 0.27 0.11 0.14
Total production cost ÏÏÏÏÏÏÏÏÏÏÏÏÏÏÏÏÏÏÏÏÏÏÏÏÏÏ $ 1.00 $ 0.73 $ 0.56
Brazil
Average lease operating cost ÏÏÏÏÏÏÏÏÏÏÏÏÏÏÏÏÏÏÏÏÏÏÏÏ $ 0.42 $ Ì $ Ì
Worldwide
Average lease operating cost ÏÏÏÏÏÏÏÏÏÏÏÏÏÏÏÏÏÏÏÏÏÏÏÏ $ 0.72 $ 0.60 $ 0.42
Average production taxes ÏÏÏÏÏÏÏÏÏÏÏÏÏÏÏÏÏÏÏÏÏÏÏÏÏÏÏ 0.24 0.11 0.14
Total production cost ÏÏÏÏÏÏÏÏÏÏÏÏÏÏÏÏÏÏÏÏÏÏÏÏÏÏ $ 0.96 $ 0.71 $ 0.56
(1)
Prices are stated before transportation costs.
(2)
Production costs include lease operating costs and production related taxes (including ad valorem and severance taxes).
Acquisition, Development and Exploration Expenditures
The following table details information regarding the costs incurred in our acquisition, development and
exploration activities for each of the three years ended December 31:
2005 2004 2003
(In millions)
United States
Acquisition Costs:
Proved ÏÏÏÏÏÏÏÏÏÏÏÏÏÏÏÏÏÏÏÏÏÏÏÏÏÏÏÏÏÏÏÏÏÏÏÏÏÏÏÏÏÏÏÏÏÏÏÏ $ 643 $ 33 $ 10
Unproved ÏÏÏÏÏÏÏÏÏÏÏÏÏÏÏÏÏÏÏÏÏÏÏÏÏÏÏÏÏÏÏÏÏÏÏÏÏÏÏÏÏÏÏÏÏÏ 143 32 35
Development Costs ÏÏÏÏÏÏÏÏÏÏÏÏÏÏÏÏÏÏÏÏÏÏÏÏÏÏÏÏÏÏÏÏÏÏÏÏÏÏÏÏ 503 395 668
Exploration Costs:
Delay rentals ÏÏÏÏÏÏÏÏÏÏÏÏÏÏÏÏÏÏÏÏÏÏÏÏÏÏÏÏÏÏÏÏÏÏÏÏÏÏÏÏÏÏÏ 3 7 6
Seismic acquisition and reprocessing ÏÏÏÏÏÏÏÏÏÏÏÏÏÏÏÏÏÏÏÏÏÏÏ 7 29 56
Drilling ÏÏÏÏÏÏÏÏÏÏÏÏÏÏÏÏÏÏÏÏÏÏÏÏÏÏÏÏÏÏÏÏÏÏÏÏÏÏÏÏÏÏÏÏÏÏÏÏ 133 149 405
Asset Retirement Obligations(1) ÏÏÏÏÏÏÏÏÏÏÏÏÏÏÏÏÏÏÏÏÏÏÏÏÏÏÏÏÏ 1 30 124
Total full cost pool expenditures ÏÏÏÏÏÏÏÏÏÏÏÏÏÏÏÏÏÏÏÏÏÏÏÏÏÏÏ 1,433 675 1,304
Non-full cost pool expendituresÏÏÏÏÏÏÏÏÏÏÏÏÏÏÏÏÏÏÏÏÏÏÏÏÏÏÏÏ 22 11 17
Total cost incurred(2) ÏÏÏÏÏÏÏÏÏÏÏÏÏÏÏÏÏÏÏÏÏÏÏÏÏÏÏÏÏÏÏÏÏÏ $1,455 $ 686 $1,321
Acquisition of unconsolidated investment in Four Star(2) ÏÏÏÏÏÏÏÏ $ 769 $ Ì $ Ì
Brazil and Other International
Acquisition Costs:
Proved ÏÏÏÏÏÏÏÏÏÏÏÏÏÏÏÏÏÏÏÏÏÏÏÏÏÏÏÏÏÏÏÏÏÏÏÏÏÏÏÏÏÏÏÏÏÏÏÏ $ 8 $ 69 $ Ì
Unproved ÏÏÏÏÏÏÏÏÏÏÏÏÏÏÏÏÏÏÏÏÏÏÏÏÏÏÏÏÏÏÏÏÏÏÏÏÏÏÏÏÏÏÏÏÏÏ 1 3 4
Development Costs ÏÏÏÏÏÏÏÏÏÏÏÏÏÏÏÏÏÏÏÏÏÏÏÏÏÏÏÏÏÏÏÏÏÏÏÏÏÏÏÏ 6 1 Ì
Exploration Costs:
Seismic acquisition and reprocessing ÏÏÏÏÏÏÏÏÏÏÏÏÏÏÏÏÏÏÏÏÏÏÏ 7 15 11
Drilling ÏÏÏÏÏÏÏÏÏÏÏÏÏÏÏÏÏÏÏÏÏÏÏÏÏÏÏÏÏÏÏÏÏÏÏÏÏÏÏÏÏÏÏÏÏÏÏÏ 8 10 84
Asset Retirement Obligations ÏÏÏÏÏÏÏÏÏÏÏÏÏÏÏÏÏÏÏÏÏÏÏÏÏÏÏÏÏÏÏ Ì 3 Ì
Total full cost pool expenditures ÏÏÏÏÏÏÏÏÏÏÏÏÏÏÏÏÏÏÏÏÏÏÏÏÏÏÏ 30 101 99
Non-full cost pool expendituresÏÏÏÏÏÏÏÏÏÏÏÏÏÏÏÏÏÏÏÏÏÏÏÏÏÏÏÏ Ì 3 1
Total cost incurred ÏÏÏÏÏÏÏÏÏÏÏÏÏÏÏÏÏÏÏÏÏÏÏÏÏÏÏÏÏÏÏÏÏÏÏÏ $ 30 $ 104 $ 100
16
19. 2005 2004 2003
(In millions)
Worldwide
Acquisition Costs:
Proved ÏÏÏÏÏÏÏÏÏÏÏÏÏÏÏÏÏÏÏÏÏÏÏÏÏÏÏÏÏÏÏÏÏÏÏÏÏÏÏÏÏÏÏÏÏÏÏÏ $ 651 $ 102 $ 10
Unproved ÏÏÏÏÏÏÏÏÏÏÏÏÏÏÏÏÏÏÏÏÏÏÏÏÏÏÏÏÏÏÏÏÏÏÏÏÏÏÏÏÏÏÏÏÏÏ 144 35 39
Development Costs ÏÏÏÏÏÏÏÏÏÏÏÏÏÏÏÏÏÏÏÏÏÏÏÏÏÏÏÏÏÏÏÏÏÏÏÏÏÏÏÏ 509 396 668
Exploration Costs:
Delay rentals ÏÏÏÏÏÏÏÏÏÏÏÏÏÏÏÏÏÏÏÏÏÏÏÏÏÏÏÏÏÏÏÏÏÏÏÏÏÏÏÏÏÏÏ 3 7 6
Seismic acquisition and reprocessing ÏÏÏÏÏÏÏÏÏÏÏÏÏÏÏÏÏÏÏÏÏÏÏ 14 44 67
Drilling ÏÏÏÏÏÏÏÏÏÏÏÏÏÏÏÏÏÏÏÏÏÏÏÏÏÏÏÏÏÏÏÏÏÏÏÏÏÏÏÏÏÏÏÏÏÏÏÏ 141 159 489
Asset Retirement Obligations(1) ÏÏÏÏÏÏÏÏÏÏÏÏÏÏÏÏÏÏÏÏÏÏÏÏÏÏÏÏÏ 1 33 124
Total full cost pool expenditures ÏÏÏÏÏÏÏÏÏÏÏÏÏÏÏÏÏÏÏÏÏÏÏÏÏÏÏ 1,463 776 1,403
Non-full cost pool expendituresÏÏÏÏÏÏÏÏÏÏÏÏÏÏÏÏÏÏÏÏÏÏÏÏÏÏÏÏ 22 14 18
Total cost incurred(2) ÏÏÏÏÏÏÏÏÏÏÏÏÏÏÏÏÏÏÏÏÏÏÏÏÏÏÏÏÏÏÏÏÏÏ $1,485 $ 790 $1,421
Acquisition of unconsolidated investment in Four Star(2) ÏÏÏÏÏÏÏÏ $ 769 $ Ì $ Ì
(1)
Includes an increase to our property, plant and equipment of approximately $114 million in 2003 associated with our adoption of
Statement of Financial Accounting Standards (SFAS) No. 143.
(2)
Includes $179 million of deferred income tax adjustments related to the acquisition of full-cost pool properties and $217 million
related to the acquisition of our unconsolidated investment in Four Star.
We spent approximately $247 million in 2005, $156 million in 2004, and $220 million in 2003 to develop
proved undeveloped reserves that were included in our reserve report as of January 1 of each year.
Markets and Competition
We primarily sell our domestic natural gas and oil to third parties through our Marketing and Trading
segment at spot market prices, subject to customary adjustments. As part of our long-term business strategy,
we will continue this practice. We sell our NGL at market prices under monthly or long-term contracts,
subject to customary adjustments. In Brazil, we sell the majority of our natural gas and oil to Petrobras, a
Brazilian energy company. We also engage in hedging activities on a portion of our production to stabilize our
cash flows and to reduce the risk of downward commodity price movements on sales of our production. As of
December 31, 2005, in this segment we had hedged approximately 85,000 BBtu of our anticipated natural gas
production in 2006 and approximately 26,000 BBtu of our anticipated natural gas production during 2007
through 2012. For a further discussion of the prices at which we have hedged our natural gas and oil
production, see Part II, Item 7 Management's Discussion and Analysis of Financial Condition and Results of
Operations.
The exploration and production business is highly competitive in the search for and acquisition of
additional natural gas and oil reserves and in the sale of natural gas, oil and NGL. Our competitors include
major and intermediate sized natural gas and oil companies, independent natural gas and oil operators and
individual producers or operators with varying scopes of operations and financial resources. Competitive
factors include price and contract terms, our ability to access drilling and other equipment and our ability to
hire and retain skilled personnel on a timely and cost effective basis. Ultimately, our future success in the
exploration and production business will be dependent on our ability to find or acquire additional reserves at
costs that yield acceptable returns on the capital invested.
17
20. Marketing and Trading Segment
Our Marketing and Trading segment's primary focus is to market our Exploration and Production
segment's natural gas and oil production and to manage the company's price risks related to its anticipated
production, primarily through the use of natural gas and oil derivative contracts. In addition, we also continue
to manage and liquidate various transportation, power and other contracts remaining from our legacy trading
operations, primarily entered into prior to the deterioration of the energy trading environment in 2002. We
enter into contracts in this segment with both third parties and with affiliates that require physical delivery of a
commodity or financial settlement which are further described below.
Production-related Natural Gas and Oil Derivatives
Our natural gas and oil contracts include options and swaps designed to provide price protection to
El Paso from fluctuations in natural gas and oil prices. As of December 31, 2005, these contracts provided
El Paso with floor prices, ceiling prices and fixed prices on the following volumes of future natural gas and oil
production:
2006 2007 2008 2009
Natural Gas (TBtu)
Volumes with floor priceÏÏÏÏÏÏÏÏÏÏÏÏÏÏÏÏÏÏÏÏÏÏÏÏÏÏÏÏÏÏ 120 51 18 17
Volumes with ceiling price ÏÏÏÏÏÏÏÏÏÏÏÏÏÏÏÏÏÏÏÏÏÏÏÏÏÏÏÏ 60 21 18 17
Volumes with fixed pricesÏÏÏÏÏÏÏÏÏÏÏÏÏÏÏÏÏÏÏÏÏÏÏÏÏÏÏÏÏ 25 Ì Ì Ì
Oil (MBbls)
Volumes with floor and ceiling prices ÏÏÏÏÏÏÏÏÏÏÏÏÏÏÏÏÏÏÏ Ì 1,009 930 Ì
Volumes with fixed pricesÏÏÏÏÏÏÏÏÏÏÏÏÏÏÏÏÏÏÏÏÏÏÏÏÏÏÏÏÏ 1,044 Ì Ì Ì
Contracts Related to Legacy Trading Operations
Natural gas transportation-related contracts. Our transportation contracts give us the right to transport
natural gas using pipeline capacity for a fixed reservation charge plus variable transportation costs. We
typically refer to the fixed reservation cost as a demand charge. Our ability to utilize our transportation
capacity under these contracts is dependent on several factors, including the difference in natural gas prices at
receipt and delivery locations along the pipeline system, the amount of working capital needed to use this
capacity and the capacity required to meet our other long-term obligations. The following table details our
transportation contracts as of December 31 2005:
Alliance Pipeline Enterprise Texas Pipeline Other Pipelines
918,000(1)
Daily capacity (MMBtu/d)ÏÏÏÏÏÏÏÏÏÏÏÏ 160,000 435,000
ExpirationÏÏÏÏÏÏÏÏÏÏÏÏÏÏÏÏÏÏÏÏÏÏÏÏÏÏÏ 2015 May 2006 2006 to 2028
Receipt points ÏÏÏÏÏÏÏÏÏÏÏÏÏÏÏÏÏÏÏÏÏÏÏ AECO Canada South Texas Various
Delivery pointsÏÏÏÏÏÏÏÏÏÏÏÏÏÏÏÏÏÏÏÏÏÏÏ Chicago Houston Ship Channel Various
(1)
Approximately 700,000 MMBtu/d of this capacity is contracted with our pipeline affiliates.
Other natural gas derivative contracts. As of December 31, 2005, we have eight significant physical
natural gas contracts with power plants associated with our legacy trading operations. These contracts obligate
us to sell gas to these plants and have various expiration dates ranging from 2009 to 2028, with expected
obligations under individual contracts with third parties ranging from 32,000 to 142,000 MMBtu/d.
Power contracts. As of December 31, 2005, we held derivative contracts with Constellation Energy
Commodities Group (Constellation) that swap locational differences in power prices between the
Pennsylvania-New Jersey-Maryland (PJM) eastern region with those in the west PJM hub through 2013.
We also held a number of other power contracts that obligate us to supply power or manage the price risk
associated with those supply contracts. These include a power supply agreement associated with our formerly-
18
21. owned Utility Contract Funding (UCF) facility for approximately 1,700 MMWh per year through 2016.
During 2005, we entered into contracts that substantially offset the commodity risk associated with these
power supply and power price risk management contracts. We will terminate or assign a portion of these
contracts to Morgan Stanley in 2006; however, we will retain some contracts (including those related to UCF)
that will expose us primarily to locational price risk in the future as any fixed price exposure is largely offset by
the new contracts we entered into in 2005.
Markets and Competition
Our Marketing and Trading segment operates in a highly competitive environment, competing on the
basis of price, operating efficiency, technological advances, experience in the marketplace and counterparty
credit. Each market served is influenced directly or indirectly by energy market economics. Our primary
competitors include:
‚ Affiliates of major oil and natural gas producers;
‚ Large domestic and foreign utility companies;
‚ Affiliates of large local distribution companies;
‚ Affiliates of other interstate and intrastate pipelines; and
‚ Independent energy marketers and power producers with varying scopes of operations and financial
resources.
19
22. Power Segment
Our Power segment includes the ownership and operation of our remaining international and domestic
power generation facilities. A number of our power assets have either been sold or are under sales agreements
that are expected to close in the first half of 2006. These facilities primarily sell power under long-term power
purchase agreements with power transmission and distribution companies owned by local governments which
subject us to certain political risks. As of December 31, 2005, we owned or had interests in 23 power facilities
in 11 countries with a total generating capacity of approximately 6,334 gross MW (only significant assets and
investments are listed):
El Paso Expiration
Ownership Gross Year of Power
Project(1) Area Interest Capacity Power Purchaser Sales Contracts Fuel Type
(Percent) (MW)
International
Brazil
Araucaria(2) ÏÏ Brazil 60 484 COPEL Ì Natural Gas
Macae(2) ÏÏÏÏÏ Brazil 100 928 Petrobras 2007 Natural Gas
(3)
Manaus ÏÏÏÏ Brazil 100 238 Manaus Energia 2008 Oil
Porto Velho ÏÏ Brazil 50 404 Eletronorte 2010, 2023 Oil
Rio Negro(3) ÏÏ Brazil 100 158 Manaus Energia 2008 Oil
Asia(4)
Fauji ÏÏÏÏÏÏÏÏ Pakistan 42 157 Pakistan Water and Power 2029 Natural Gas
Habibullah ÏÏÏ Pakistan 50 136 Pakistan Water and Power 2029 Natural Gas
Sengkang ÏÏÏÏ Indonesia 48 135 PLN 2022 Natural Gas
Central and other South America(4)
Aguaytia ÏÏÏÏÏ Peru 24 155 Various 2005, 2006 Natural Gas
CEPP ÏÏÏÏÏÏÏ Dominican Republic 48 67 CDEEE, Spot Market 2014 Oil
Fortuna ÏÏÏÏÏÏ Panama 25 300 Union Fenosa 2005, 2008 Hydroelectric
Itabo ÏÏÏÏÏÏÏÏ Dominican Republic 25 416 CDEEE and AES 2016 Oil/Coal
Europe
EMA(4) ÏÏÏÏÏÏ Hungary 50 69 Dunaferr Energy Services 2016 Natural Gas/Oil
Domestic
Ì(5) Ì(5)
BerkshireÏÏÏÏÏ MA - U.S. 56 261 Natural Gas
Midland
Cogeneration MI - U.S. 44 1,575 Consumers Power, Dow 2025 Natural Gas
(1)
Our Macae project in Brazil is consolidated. All others in this table are reflected as investments in unconsolidated affiliates in our
financial statements.
(2)
See Part II, Item 8, Financial Statements and Supplementary Data, Note 16 for a further discussion of these plants.
(3)
See Part II, Item 8, Financial Statements and Supplementary Data, Note 21 for a further discussion of the transfer of ownership in
2008 of these facilities.
(4)
We have sold or have received approval from our Board of Directors to sell these facilities in 2006.
(5)
Our Marketing and Trading segment sells the power that this facility generates to the wholesale power market.
In addition to the international power plants above, our Power segment also has investments in the
following international pipelines:
El Paso
Ownership Miles of Design Average 2005
Capacity(1) Throughput(1)
Pipeline Interest Pipeline
(Percent) (MMcf/d) (BBtu/d)
Bolivia to Brazil ÏÏÏÏÏÏÏÏÏÏÏÏÏÏÏÏÏÏÏÏÏÏÏÏÏÏÏÏÏÏÏÏÏÏÏÏÏÏÏÏÏÏÏÏÏÏÏ 8 1,957 1,059 841
Argentina to Chile ÏÏÏÏÏÏÏÏÏÏÏÏÏÏÏÏÏÏÏÏÏÏÏÏÏÏÏÏÏÏÏÏÏÏÏÏÏÏÏÏÏÏÏÏÏ 22 336 138 100
(1)
Volumes represent the pipeline's total design capacity and average throughput and are not adjusted for our ownership interest.
Field Services Segment
As of December 31, 2005, our Field Services segment conducted our remaining midstream activities,
which consisted principally of two processing plants that support our Exploration and Production segment
activities in the Rocky Mountain area. These facilities had operational capacity of 49 MMcf/d. In January
2006, these plants were transferred to our Exploration and Production segment. As a result, our Field Services
segment will cease to be a business segment in 2006.
20