Financial Leverage Definition, Advantages, and Disadvantages
tribune earnings_q2_06_tables
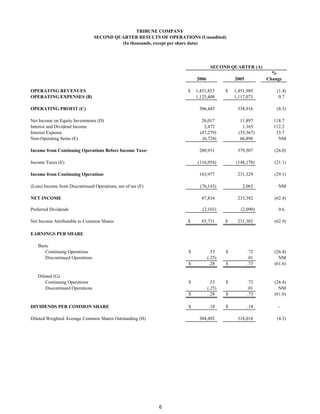
1. TRIBUNE COMPANY
SECOND QUARTER RESULTS OF OPERATIONS (Unaudited)
(In thousands, except per share data)
SECOND QUARTER (A)
%
2006 2005 Change
OPERATING REVENUES $ 1,431,853 $ 1,451,989 (1.4)
OPERATING EXPENSES (B) 1,125,408 1,117,073 0.7
OPERATING PROFIT (C) 306,445 334,916 (8.5)
Net Income on Equity Investments (D) 26,017 11,897 118.7
Interest and Dividend Income 2,472 1,165 112.2
Interest Expense (47,279) (35,367) 33.7
Non-Operating Items (E) (6,724) 66,896 NM
Income from Continuing Operations Before Income Taxes 280,931 379,507 (26.0)
Income Taxes (E) (116,954) (148,178) (21.1)
Income from Continuing Operations 163,977 231,329 (29.1)
(Loss) Income from Discontinued Operations, net of tax (F) (76,143) 2,063 NM
NET INCOME 87,834 233,392 (62.4)
Preferred Dividends (2,103) (2,090) 0.6
Net Income Attributable to Common Shares $ 85,731 $ 231,302 (62.9)
EARNINGS PER SHARE
Basic
Continuing Operations $ .53 $ .72 (26.4)
Discontinued Operations (.25) .01 NM
$ .28 $ .73 (61.6)
Diluted (G)
Continuing Operations $ .53 $ .72 (26.4)
Discontinued Operations (.25) .01 NM
$ .28 $ .73 (61.6)
DIVIDENDS PER COMMON SHARE $ .18 $ .18 -
Diluted Weighted Average Common Shares Outstanding (H) 304,492 318,018 (4.3)
6
2. (A) 2006 second quarter: March 27, 2006 to June 25, 2006. (13 weeks)
2005 second quarter: March 28, 2005 to June 26, 2005. (13 weeks)
(B) Operating expenses for the second quarter of 2006 included $5 million, or $.01 per diluted share, of stock-based
compensation expense ($3 million for Publishing, $1 million for Broadcasting, $1 million for Corporate).
(C) Operating profit excludes interest and dividend income, interest expense, equity income and losses, non-operating items and
income taxes.
(D) Net income on equity investments for the second quarter of 2006 included the Company's $5.9 million share of a
one-time favorable income tax adjustment at CareerBuilder.
(E) The second quarter of 2006 included the following non-operating items:
Pretax After-tax
Loss Loss Diluted EPS
Loss on derivatives and related investments (1) $ (6,121) $ (3,734) $ (.01)
Other, net (603) (368) -
Income tax adjustments - (3,595) (.01)
Total non-operating items $ (6,724) $ (7,697) $ (.03)
The second quarter of 2005 included the following non-operating items:
Pretax After-tax
Gain Gain Diluted EPS
Gain on derivatives and related investments (1) $ 61,803 $ 37,700 $ .12
Other, net 5,093 3,107 .01
Total non-operating items $ 66,896 $ 40,807 $ .13
(1) Gain (loss) on derivatives and related investments represents the net change in fair values of the derivative component of
the Company's PHONES and the related Time Warner shares.
(F) In June 2006, the Company announced agreements to sell its Atlanta and Albany television stations. Operating
results for these stations are now reported as discontinued operations. (Loss) income from discontinued
operations in the second quarter included the following:
Second Quarter
2006 2005
Income from operations, net of tax $ 1,876 $ 2,063
Expected loss on sales, net of tax (1) (78,019) -
Total $ (76,143) $ 2,063
(1) In the second quarter of 2006, the Company recorded a pretax loss of $90 million, including $80 million of allocated
television group goodwill, to write down the Atlanta and Albany net assets to estimated fair value, less cost to sell. In
accordance with Financial Accounting Standard (quot;FASquot;) No. 142, quot;Goodwill and Other Intangible Assetsquot;, the Company
aggregates all of its television stations into one reporting unit for goodwill accounting purposes. Although no goodwill was
recorded when the Atlanta station was acquired and only $.3 million of goodwill was recorded for the Albany acquisition, FAS
142 requires the Company to allocate a portion of its total television group goodwill to stations that are sold based on the fair
value of the stations, relative to the fair value of the Company's remaining stations.
7
3. (G) For the second quarters of 2006 and 2005, weighted average common shares outstanding used in the calculations of diluted
earnings per share (quot;EPSquot;) were adjusted for the dilutive effect of stock-based compensation grants. The Company's Series C,
D-1 and D-2 convertible preferred shares were not included in the calculation of diluted EPS for the second quarter of either
year because their effects were antidilutive. Following are the calculations for the second quarter:
Second Quarter
2006 2005
Income from continuing operations $ 163,977 $ 231,329
(Loss) income from discontinued operations, net of tax (76,143) 2,063
Net income 87,834 233,392
Dividends for series C, D-1 and D-2 preferred stock (2,103) (2,090)
Net income attributable to common shares $ 85,731 $ 231,302
Weighted average common shares outstanding 302,683 315,466
Adjustment for stock-based compensation grants 1,809 2,552
Adjusted weighted average common
shares outstanding 304,492 318,018
Diluted earnings per share:
Continuing operations $ .53 $ .72
Discontinued operations (.25) .01
$ .28 $ .73
(H) The number of common shares outstanding, in thousands, at June 25, 2006 was 302,991.
8
4. TRIBUNE COMPANY
FIRST HALF RESULTS OF OPERATIONS (Unaudited)
(In thousands, except per share data)
FIRST HALF (A)
%
2006 2005 Change
OPERATING REVENUES $ 2,721,414 $ 2,757,887 (1.3)
OPERATING EXPENSES (B) 2,194,310 2,173,976 0.9
OPERATING PROFIT (C) 527,104 583,911 (9.7)
Net Income on Equity Investments (D) 32,565 12,368 163.3
Interest and Dividend Income 4,652 2,247 107.0
Interest Expense (96,051) (70,458) 36.3
Non-Operating Items (E) (20,421) 63,052 NM
Income from Continuing Operations Before Income Taxes 447,849 591,120 (24.2)
Income Taxes (E) (182,440) (218,814) (16.6)
Income from Continuing Operations 265,409 372,306 (28.7)
(Loss) Income from Discontinued Operations, net of tax (F) (74,811) 3,931 NM
NET INCOME 190,598 376,237 (49.3)
Preferred Dividends (4,206) (4,180) 0.6
Net Income Attributable to Common Shares $ 186,392 $ 372,057 (49.9)
EARNINGS PER SHARE
Basic
Continuing Operations $ .86 $ 1.17 (26.5)
Discontinued Operations (.25) .01 NM
$ .61 $ 1.18 (48.3)
Diluted (G)
Continuing Operations $ .86 $ 1.16 (25.9)
Discontinued Operations (.25) .01 NM
$ .61 $ 1.17 (47.9)
DIVIDENDS PER COMMON SHARE $ .36 $ .36 -
Diluted Weighted Average Common Shares Outstanding (H) 305,047 319,169 (4.4)
9
5. (A) 2006 first half: Dec. 26, 2005 to June 25, 2006. (26 weeks)
2005 first half: Dec. 27, 2004 to June 26, 2005. (26 weeks)
Operating expenses for the first half of 2006 included stock-based compensation expense of $23 million,
(B)
or $.05 per diluted share, a charge of $19 million, or $.04 per diluted share, for severance and other payments
associated with the new union contracts at Newsday, and a gain of $7 million, or $.01 per diluted share, related to
property sales in publishing.
(C) Operating profit excludes interest and dividend income, interest expense, equity income and losses, non-operating items and
income taxes.
(D) Net income on equity investments for the first half of 2006 included the Company's $5.9 million share of a one-time
favorable income tax adjustment at CareerBuilder.
(E) The first half of 2006 included the following non-operating items:
Pretax After-tax
Loss Loss Diluted EPS
Loss on derivatives and related investments (1) $ (16,438) $ (10,027) $ (.03)
Other, net (3,983) (2,430) (.01)
Income tax adjustments - (3,595) (.01)
Total non-operating items $ (20,421) $ (16,052) $ (.05)
The first half of 2005 included the following non-operating items:
Pretax After-tax
Gain Gain Diluted EPS
Gain on derivatives and related investments (1) $ 59,551 $ 36,326 $ .12
Other, net 3,501 2,136 .01
Income tax settlement adjustments (2) - 11,829 .03
Total non-operating items $ 63,052 $ 50,291 $ .16
(1) Gain (loss) on derivatives and related investments represents the net change in fair values of the derivative component of
the Company's PHONES and the related Time Warner shares.
(2) In the first quarter of 2005, the Company reduced its income tax expense and liabilities by a total of $12 million
as a result of favorably resolving certain federal income tax issues.
10
6. (F) In June 2006, the Company announced agreements to sell its Atlanta and Albany television stations. Operating
results for these stations are now reported as discontinued operations. (Loss) income from discontinued
operations in the first half included the following:
First Half
2006 2005
Income from operations, net of tax $ 3,208 $ 3,931
Expected loss on sales, net of tax (1) (78,019) -
Total $ (74,811) $ 3,931
(1) In the first half of 2006, the Company recorded a pretax loss of $90 million, including $80 million of allocated
television group goodwill, to write down the Atlanta and Albany net assets to estimated fair value, less cost to sell. In
accordance with Financial Accounting Standard (quot;FASquot;) No. 142, quot;Goodwill and Other Intangible Assetsquot;, the Company
aggregates all of its television stations into one reporting unit for goodwill accounting purposes. Although no goodwill was
recorded when the Atlanta station was acquired and only $.3 million of goodwill was recorded for the Albany acquisition, FAS
142 requires the Company to allocate a portion of its total television group goodwill to stations that are sold based on the fair
value of the stations, relative to the fair value of the Company's remaining stations.
(G) For the first halves of 2006 and 2005, weighted average common shares outstanding used in the calculations of diluted earnings
per share (quot;EPSquot;) were adjusted for the dilutive effect of stock-based compensation grants. The Company's Series C, D-1 and
D-2 convertible preferred shares were not included in the calculation of diluted EPS for the first half of either year because their
effects were antidilutive. Following are the calculations for the first half:
First Half
2006 2005
Income from continuing operations $ 265,409 $ 372,306
(Loss) income from discontinued operations, net of tax (74,811) 3,931
Net income 190,598 376,237
Dividends for series C, D-1 and D-2 preferred stock (4,206) (4,180)
Net income attributable to common shares $ 186,392 $ 372,057
Weighted average common shares outstanding 303,451 316,387
Adjustment for stock-based compensation grants 1,596 2,782
Adjusted weighted average common
shares outstanding 305,047 319,169
Diluted earnings per share:
Continuing operations $ .86 $ 1.16
Discontinued operations (.25) .01
$ .61 $ 1.17
(H) The number of common shares outstanding, in thousands, at June 25, 2006 was 302,991.
11
8. (A) The Company uses cash operating expenses to evaluate internal performance. The Company has presented cash operating expenses because
it is a common measure used by rating agencies, financial analysts and investors. Cash operating expenses are not a measure of financial
performance under generally accepted accounting principles (quot;GAAPquot;) and should not be considered in isolation or as a substitute for
measures of performance prepared in accordance with GAAP.
Following is a reconciliation of operating expenses to cash operating expenses for the second quarter of 2006:
Broadcasting and
Publishing Entertainment Corporate Consolidated
Operating expenses $ 819,646 $ 291,742 $ 14,020 $ 1,125,408
Less: depreciation and amortization expense 42,450 12,639 346 55,435
Cash operating expenses $ 777,196 $ 279,103 $ 13,674 $ 1,069,973
Following is a reconciliation of operating expenses to cash operating expenses for the second quarter of 2005:
Broadcasting and
Publishing Entertainment Corporate Consolidated
Operating expenses $ 820,973 $ 282,628 $ 13,472 $ 1,117,073
Less: depreciation and amortization expense 45,210 12,109 406 57,725
Cash operating expenses $ 775,763 $ 270,519 $ 13,066 $ 1,059,348
Following is a reconciliation of operating expenses to cash operating expenses for the first half of 2006:
Broadcasting and
Publishing Entertainment Corporate Consolidated
Operating expenses $ 1,641,953 $ 517,974 $ 34,383 $ 2,194,310
Less: depreciation and amortization expense 85,059 25,044 685 110,788
Cash operating expenses $ 1,556,894 $ 492,930 $ 33,698 $ 2,083,522
Following is a reconciliation of operating expenses to cash operating expenses for the first half of 2005:
Broadcasting and
Publishing Entertainment Corporate Consolidated
Operating expenses $ 1,627,946 $ 519,110 $ 26,920 $ 2,173,976
Less: depreciation and amortization expense 89,856 24,578 807 115,241
Cash operating expenses $ 1,538,090 $ 494,532 $ 26,113 $ 2,058,735
(B) Publishing cash operating expenses for the first half of 2006 included a charge of $19 million for severance and other payments
associated with the new union contracts at Newsday and a gain of $7 million related to property sales.
(C) Cash operating expenses for the second quarter of 2006 included stock-based compensation expense of $3 million for Publishing,
$1 million for Broadcasting and Entertainment and $1 million for Corporate. Cash operating expenses for the first half of 2006
included stock-based compensation expense of $10 million for Publishing, $4 million for Broadcasting and Entertainment and
$9 million for Corporate.
(D) Operating cash flow is defined as operating profit before depreciation and amortization. The Company uses operating cash flow along with
operating profit and other measures to evaluate the financial performance of the Company's business segments. The Company has
presented operating cash flow because it is a common alternative measure of financial performance used by rating agencies, financial analysts
and investors. These groups use operating cash flow along with other measures as a way to estimate the value of a company. The
Company's definition of operating cash flow may not be consistent with that of other companies. Operating cash flow does not represent
cash provided by operating activities as reflected in the Company's consolidated statements of cash flows, is not a measure of financial
performance under GAAP and should not be considered in isolation or as a substitute for measures of performance prepared in accordance
with GAAP.
13
9. (E) Operating profit for each segment excludes interest and dividend income, interest expense, equity income and losses, non-operating items and
income taxes.
Following is a reconciliation of operating profit (loss) to operating cash flow for the second quarter of 2006:
Broadcasting and
Publishing Entertainment Corporate Consolidated
Operating profit (loss) $ 208,657 $ 111,808 $ (14,020) $ 306,445
Add back: depreciation and amortization expense 42,450 12,639 346 55,435
Operating cash flow $ 251,107 $ 124,447 $ (13,674) $ 361,880
Following is a reconciliation of operating profit (loss) to operating cash flow for the second quarter of 2005:
Broadcasting and
Publishing Entertainment Corporate Consolidated
Operating profit (loss) $ 217,651 $ 130,737 $ (13,472) $ 334,916
Add back: depreciation and amortization expense 45,210 12,109 406 57,725
Operating cash flow $ 262,861 $ 142,846 $ (13,066) $ 392,641
Following is a reconciliation of operating profit (loss) to operating cash flow for the first half of 2006:
Broadcasting and
Publishing Entertainment Corporate Consolidated
Operating profit (loss) $ 382,879 $ 178,608 $ (34,383) $ 527,104
Add back: depreciation and amortization expense 85,059 25,044 685 110,788
Operating cash flow $ 467,938 $ 203,652 $ (33,698) $ 637,892
Following is a reconciliation of operating profit (loss) to operating cash flow for the first half of 2005:
Broadcasting and
Publishing Entertainment Corporate Consolidated
Operating profit (loss) $ 416,190 $ 194,641 $ (26,920) $ 583,911
Add back: depreciation and amortization expense 89,856 24,578 807 115,241
Operating cash flow $ 506,046 $ 219,219 $ (26,113) $ 699,152
14
10. TRIBUNE COMPANY
SUMMARY OF REVENUES AND NEWSPAPER ADVERTISING VOLUME (Unaudited)
(In thousands)
Period 6 (5 Weeks) Second Quarter (13 Weeks) Year to Date (26 Weeks)
% % %
2006 2005 Change 2006 2005 Change 2006 2005 Change
Publishing
Advertising
$ 128,235 $ 129,514 $ 334,079 $ 331,637 $ 631,680 $ 635,818
Retail (1.0) 0.7 (0.7)
National 69,778 75,239 (7.3) 177,294 190,253 (6.8) 360,856 390,767 (7.7)
Classified 115,410 113,044 2.1 311,557 301,035 3.5 618,083 583,807 5.9
313,423 317,797 822,930 822,925 1,610,619 1,610,392
Sub-Total (1.4) - -
53,631 56,777 141,975 149,918 287,839 301,634
Circulation (5.5) (5.3) (4.6)
Other 23,131 23,916 (3.3) 63,398 65,781 (3.6) 126,374 132,110 (4.3)
Segment Total (A) 390,185 398,490 (2.1) 1,028,303 1,038,624 (1.0) 2,024,832 2,044,136 (0.9)
Broadcasting & Entertainment
Television 121,475 124,496 (2.4) 320,255 324,426 (1.3) 594,976 604,669 (1.6)
34,772 39,840 83,295 88,939 101,606 109,082
Radio/Entertainment (12.7) (6.3) (6.9)
156,247 164,336 403,550 413,365 696,582 713,751
Segment Total (4.9) (2.4) (2.4)
$ 546,432 $ 562,826 (2.9) $ 1,431,853 $ 1,451,989 (1.4) $ 2,721,414 $ 2,757,887 (1.3)
Consolidated Revenues
Total Advertising Inches (B)
Full Run
Retail 582 581 0.2 1,491 1,495 (0.3) 2,816 2,880 (2.2)
National 346 361 (4.2) 879 919 (4.4) 1,776 1,885 (5.8)
Classified 1,065 1,018 4.6 2,794 2,608 7.1 5,439 4,989 9.0
Sub-Total 1,993 1,960 1.7 5,164 5,022 2.8 10,031 9,754 2.8
Part Run 2,124 2,068 2.7 5,586 5,306 5.3 10,547 10,305 2.3
Total 4,117 4,028 2.2 10,750 10,328 4.1 20,578 20,059 2.6
Preprint Pieces (B) 1,416,631 1,451,660 (2.4) 3,623,877 3,758,570 (3.6) 6,977,890 7,257,435 (3.9)
(A) Publishing advertising and other revenues for 2005 have been reclassified to conform with the 2006 presentation. There was no effect
on total revenues.
(B) Volume for 2005 has been modified to conform with the 2006 presentation. Volume includes only the daily newspapers and is based on
preliminary internal data, which may be updated in subsequent reports. The presentation of volume data has been changed to be mor
consistent with the summary of revenues table
15