SlideShare ist ein Scribd-Unternehmen logo
1 von 219
Downloaden Sie, um offline zu lesen
UNITED STATES SECURITIES AND EXCHANGE COMMISSION
                                                             Washington, D.C. 20549

                                                                Form 10-K
 (Mark One)
       ¥            ANNUAL REPORT PURSUANT TO SECTION 13 OR 15(d)
                    OF THE SECURITIES EXCHANGE ACT OF 1934
                    For the fiscal year ended December 31, 2007 or
       n            TRANSITION REPORT PURSUANT TO SECTION 13 or 15(d)
                    OF THE SECURITIES EXCHANGE ACT OF 1934
                    For the transition period from           to
                                              Commission file numbers 001-13251


                                                 SLM Corporation
                                                   (Exact Name of Registrant as Specified in Its Charter)
                               Delaware                                                                      52-2013874
                       (State of Other Jurisdiction of                                                       (I.R.S. Employer
                      Incorporation or Organization)                                                        Identification No.)
             12061 Bluemont Way, Reston, Virginia                                                                20190
                                                                                                               (Zip Code)
                  (Address of Principal Executive Offices)
                                                                    (703) 810-3000
                                                   (Registrant’s Telephone Number, Including Area Code)
                                   Securities registered pursuant to Section 12(b) of the Act
                                           Common Stock, par value $.20 per share.
                                              Name of Exchange on which Listed:
                                                    New York Stock Exchange
                       6.97% Cumulative Redeemable Preferred Stock, Series A, par value $.20 per share
                       Floating Rate Non-Cumulative Preferred Stock, Series B, par value $.20 per share
                                              Name of Exchange on which Listed:
                                                    New York Stock Exchange
                                  Medium Term Notes, Series A, CPI-Linked Notes due 2017
                                  Medium Term Notes, Series A, CPI-Linked Notes due 2018
                                            6% Senior Notes due December 15, 2043
                                              Name of Exchange on which Listed:
                                                    New York Stock Exchange
                                   Securities registered pursuant to Section 12(g) of the Act:
                                                             None.

     Indicate by check mark whether the registrant is a well-known seasoned issuer, as defined in Rule 405 of the Securities
       Yes ¥       No n
Act.
     Indicate by check mark if the registrant is not required to file reports pursuant to Section 13 or 15(d) of the Act. Yes n         No ¥
     Indicate by check mark whether the registrant: (1) has filed all reports required to be filed by Section 13 or 15(d) of the Securities
Exchange Act of 1934 during the preceding 12 months (or for such shorter period that the registrant was required to file such reports), and
(2) has been subject to such filing requirements for the past 90 days. Yes ¥          No n
     Indicate by check mark if disclosure of delinquent filers pursuant to Item 405 of Regulation S-K is not contained herein, and will not be
contained, to the best of registrant’s knowledge, in definitive proxy or information statements incorporated by reference in Part III of this
Form 10-K or any amendment to this Form 10-K. ¥
     Indicate by check mark whether the registrant is a large accelerated filer, an accelerated filer, a non-accelerated filer, or a smaller
reporting company. See definitions of “large accelerated filer,” “accelerated filer” and “smaller reporting company” in Rule 12b-2 of the
Exchange Act. (Check one):
Large accelerated filer ¥                 Accelerated filer n                 Non-accelerated filer n                Smaller reporting company n
                                                                  (Do not check if a smaller reporting company)
     Indicate by check mark whether the registrant is a shell company (as defined in Rule 12b-2 of the Exchange Act). Yes n                No ¥
     The aggregate market value of voting stock held by non-affiliates of the registrant as of June 30, 2007 was $23.6 billion (based on
closing sale price of $57.58 per share as reported for the New York Stock Exchange — Composite Transactions).
     As of January 31, 2008, there were 466,570,624 shares of voting common stock outstanding.
                                           DOCUMENTS INCORPORATED BY REFERENCE
     Portions of the Proxy Statement relating to the registrant’s Annual Meeting of Shareholders scheduled to be held May 8, 2008 are
incorporated by reference into Part III of this Report.
FORWARD-LOOKING AND CAUTIONARY STATEMENTS
     This report contains forward-looking statements and information that are based on management’s current
expectations as of the date of this document. Statements that are not historical facts, including statements
about our beliefs or expectations and statements that assume or are dependent upon future events are forward-
looking statements, and are contained throughout this Annual Report on Form 10-K, including under the
sections entitled “Business” and “Management’s Discussion and Analysis of Financial Condition and Results
of Operations.” These forward-looking statements are subject to risks, uncertainties, assumptions and other
factors that may cause the actual results to be materially different from those reflected in such forward-looking
statements. These factors include, among others, the occurrence of any event, change or other circumstances
that could give rise to our ability to cost-effectively refinance the aggregate interim $30 billion asset-backed
commercial paper conduit facilities (collectively, the “Interim ABCP Facility”) extended to SLM Corporation,
more commonly known as Sallie Mae, and its subsidiaries (collectively, “the Company”) by Bank of America,
N.A. and JPMorgan Chase, N.A. in connection with the Merger Agreement (defined in the Glossary below),
including any potential foreclosure on the student loans under those facilities following their termination,
increased financing costs and more limited liquidity; any adverse outcomes in any significant litigation to
which we are a party; our derivative counterparties may terminate their positions with the Company if its
credit ratings fall to certain levels and the Company could incur substantial additional costs to replace any
terminated positions; changes in the terms of student loans and the educational credit marketplace arising from
the implementation of applicable laws and regulations and from changes in these laws and regulations, which,
among other things, may reduce the volume, average term and yields on student loans under the Federal
Family Education Loan Program (“FFELP”) or result in loans being originated or refinanced under non-FFELP
programs or may affect the terms upon which banks and others agree to sell FFELP loans to the Company. In
addition, a larger than expected increase in third-party consolidations of our FFELP loans could materially
adversely affect our results of operations. The Company could also be affected by changes in the demand for
educational financing or in financing preferences of lenders, educational institutions, students and their
families; incorrect estimates or assumptions by management in connection with the preparation of our
consolidated financial statements; changes in the composition of our Managed FFELP and Private Education
Loan portfolios; changes in the general interest rate environment and in the securitization markets for
education loans, which may increase the costs or limit the availability of financings necessary to initiate,
purchase or carry education loans; changes in projections of losses from loan defaults; changes in general
economic conditions; changes in prepayment rates and credit spreads; and changes in the demand for debt
management services and new laws or changes in existing laws that govern debt management services. All
forward-looking statements contained in this report are qualified by these cautionary statements and are made
only as of the date this Annual Report on Form 10-K is filed. The Company does not undertake any obligation
to update or revise these forward-looking statements to conform the statement to actual results or changes in
the Company’s expectations.


                                                       1
GLOSSARY

     Listed below are definitions of key terms that are used throughout this document. See also APPENDIX A,
“FEDERAL FAMILY EDUCATION LOAN PROGRAM,” for a further discussion of the FFELP and The
College Cost Reduction and Access Act of 2007.

    CCRAA — The College Cost Reduction and Access Act of 2007.

      Consolidation Loan Rebate Fee — All holders of FFELP Consolidation Loans are required to pay to the
U.S. Department of Education (“ED”) an annual 105 basis point Consolidation Loan Rebate Fee on all
outstanding principal and accrued interest balances of FFELP Consolidation Loans purchased or originated
after October 1, 1993, except for loans for which consolidation applications were received between October 1,
1998 and January 31, 1999, where the Consolidation Loan Rebate Fee is 62 basis points.

     Constant Prepayment Rate (“CPR”) — A variable in life of loan estimates that measures the rate at
which loans in the portfolio pay before their stated maturity. The CPR is directly correlated to the average life
of the portfolio. CPR equals the percentage of loans that prepay annually as a percentage of the beginning of
period balance.

     “Core Earnings” — In accordance with the Rules and Regulations of the Securities and Exchange
Commission (“SEC”), we prepare financial statements in accordance with generally accepted accounting
principles in the United States of America (“GAAP”). In addition to evaluating the Company’s GAAP-based
financial information, management evaluates the Company’s business segments on a basis that, as allowed
under the Financial Accounting Standards Board’s (“FASB”) Statement of Financial Accounting Standards
(“SFAS”) No. 131, “Disclosures about Segments of an Enterprise and Related Information,” differs from
GAAP. We refer to management’s basis of evaluating our segment results as “Core Earnings” presentations for
each business segment and we refer to these performance measures in our presentations with credit rating
agencies and lenders. While “Core Earnings” results are not a substitute for reported results under GAAP, we
rely on “Core Earnings” performance measures in operating each business segment because we believe these
measures provide additional information regarding the operational and performance indicators that are most
closely assessed by management.

     Our “Core Earnings” performance measures are the primary financial performance measures used by
management to evaluate performance and to allocate resources. Accordingly, financial information is reported
to management on a “Core Earnings” basis by reportable segment, as these are the measures used regularly by
our chief operating decision makers. Our “Core Earnings” performance measures are used in developing our
financial plans and tracking results, and also in establishing corporate performance targets and determining
incentive compensation. Management believes this information provides additional insight into the financial
performance of the Company’s core business activities. Our “Core Earnings” performance measures are not
defined terms within GAAP and may not be comparable to similarly titled measures reported by other
companies. “Core Earnings” net income reflects only current period adjustments to GAAP net income.
Accordingly, the Company’s “Core Earnings” presentation does not represent another comprehensive basis of
accounting.

    See Note 20 to the consolidated financial statements,“Segment Reporting,” and “MANAGEMENT’S
DISCUSSION AND ANALYSIS OF FINANCIAL CONDITION AND RESULTS OF OPERATIONS —
BUSINESS SEGMENTS — Limitations of ‘Core Earnings’” for further discussion of the differences between
“Core Earnings” and GAAP, as well as reconciliations between “Core Earnings” and GAAP.

     In prior filings with the SEC of SLM Corporation’s Annual Report on Form 10-K and quarterly report on
Form 10-Q, “Core Earnings” has been labeled as “‘Core’ net income” or “Managed net income” in certain
instances.

    Direct Loans — Student loans originated directly by ED under the FDLP.

    ED — The U.S. Department of Education.

                                                        2
Embedded Fixed Rate/Variable Rate Floor Income — Embedded Floor Income is Floor Income (see
definition below) that is earned on off-balance sheet student loans that are in securitization trusts sponsored by
us. At the time of the securitization, the value of Embedded Fixed Rate Floor Income is included in the initial
valuation of the Residual Interest (see definition below) and the gain or loss on sale of the student loans.
Embedded Floor Income is also included in the quarterly fair value adjustments of the Residual Interest.

     Exceptional Performer (“EP”) Designation — The EP designation is determined by ED in recognition
of a servicer meeting certain performance standards set by ED in servicing FFELP Loans. Upon receiving the
EP designation, the EP servicer receives reimbursement on default claims higher than the legislated Risk
Sharing (see definition below) levels on federally guaranteed student loans for all loans serviced for a period
of at least 270 days before the date of default. The EP servicer is entitled to receive this benefit as long as it
remains in compliance with the required servicing standards, which are assessed on an annual and quarterly
basis through compliance audits and other criteria. The annual assessment is in part based upon subjective
factors which alone may form the basis for an ED determination to withdraw the designation. If the
designation is withdrawn, Risk Sharing may be applied retroactively to the date of the occurrence that resulted
in noncompliance. The College Cost Reduction Act of 2007 eliminated the EP designation effective October 1,
2007. See also Appendix A, “FEDERAL FAMILY EDUCATION LOAN PROGRAM.”

     FDLP — The William D. Ford Federal Direct Student Loan Program.

    FFELP — The Federal Family Education Loan Program, formerly the Guaranteed Student Loan
Program.

      FFELP Consolidation Loans — Under the Federal Family Education Loan Program (“FFELP”), borrow-
ers with multiple eligible student loans may consolidate them into a single student loan with one lender at a
fixed rate for the life of the loan. The new note is considered a FFELP Consolidation Loan. Typically a
borrower may consolidate his student loans only once unless the borrower has another eligible loan to
consolidate with the existing FFELP Consolidation Loan. The borrower rate on a FFELP Consolidation Loan
is fixed for the term of the loan and is set by the weighted average interest rate of the loans being
consolidated, rounded up to the nearest 1/8th of a percent, not to exceed 8.25 percent. In low interest rate
environments, FFELP Consolidation Loans provide an attractive refinancing opportunity to certain borrowers
because they allow borrowers to consolidate variable rate loans into a long-term fixed rate loan. Holders of
FFELP Consolidation Loans are eligible to earn interest under the Special Allowance Payment (“SAP”)
formula (see definition below).

     FFELP Stafford and Other Student Loans — Education loans to students or parents of students that
are guaranteed or reinsured under the FFELP. The loans are primarily Stafford loans but also include PLUS
and HEAL loans.

     Fixed Rate Floor Income — We refer to Floor Income (see definition below) associated with student
loans whose borrower rate is fixed to term (primarily FFELP Consolidation Loans and Stafford Loans
originated on or after July 1, 2006) as Fixed Rate Floor Income.

      Floor Income — FFELP student loans generally earn interest at the higher of a floating rate based on the
Special Allowance Payment or SAP formula (see definition below) set by ED and the borrower rate, which is
fixed over a period of time. We generally finance our student loan portfolio with floating rate debt over all
interest rate levels. In low and/or declining interest rate environments, when the fixed borrower rate is higher
than the rate produced by the SAP formula, our student loans earn at a fixed rate while the interest on our
floating rate debt continues to decline. In these interest rate environments, we earn additional spread income
that we refer to as Floor Income. Depending on the type of the student loan and when it was originated, the
borrower rate is either fixed to term or is reset to a market rate each July 1. As a result, for loans where the
borrower rate is fixed to term, we may earn Floor Income for an extended period of time, and for those loans
where the borrower interest rate is reset annually on July 1, we may earn Floor Income to the next reset date.

                                                        3
In accordance with new legislation enacted in 2006, lenders are required to rebate Floor Income to ED for all
new FFELP loans disbursed on or after April 1, 2006.
     The following example shows the mechanics of Floor Income for a typical fixed rate FFELP Consolida-
tion Loan (with a commercial paper-based SAP spread of 2.64 percent):
    Fixed Borrower Rate . . . . . . . . . . . . . . . . . . . . . . . . . . . . . . . . . . . . . . . . . . . . . . . . . . . . . . 7.25%
    SAP Spread over Commercial Paper Rate . . . . . . . . . . . . . . . . . . . . . . . . . . . . . . . . . . . . . . . (2.64)%
    Floor Strike Rate(1) . . . . . . . . . . . . . . . . . . . . . . . . . . . . . . . . . . . . . . . . . . . . . . . . . . . . . . . .   4.61%

    (1)
          The interest rate at which the underlying index (Treasury bill or commercial paper) plus the fixed SAP spread equals the fixed
          borrower rate. Floor Income is earned anytime the interest rate of the underlying index declines below this rate.

Based on this example, if the quarterly average commercial paper rate is over 4.61 percent, the holder of the
student loan will earn at a floating rate based on the SAP formula, which in this example is a fixed spread to
commercial paper of 2.64 percent. On the other hand, if the quarterly average commercial paper rate is below
4.61 percent, the SAP formula will produce a rate below the fixed borrower rate of 7.25 percent and the loan
holder earns at the borrower rate of 7.25 percent. The difference between the fixed borrower rate and the
lender’s expected yield based on the SAP formula is referred to as Floor Income. Our student loan assets are
generally funded with floating rate debt, so when student loans are earning at the fixed borrower rate,
decreases in interest rates may increase Floor Income.

  Graphic Depiction of Floor Income:


                                 10.00%
                                          Fixed Borrower Rate = 7.25%
                                          Special Allowance Payment (SAP) Rate = 2.64%
                                 9.00%


                                 8.00%              Lender Yield
                         Yield                                                              Fixed Borrower Rate
                                 7.00%


                                 6.00%
                                              Floor Income
                                                                                                 Floating Debt Rate


                                 5.00%
                                                                    Floor Strike Rate @ 4.61%

                                 4.00%
                                      4.00%                        5.00%                          6.00%                 7.00%
                                                                           Commercial Paper Rate


      Floor Income Contracts — We enter into contracts with counterparties under which, in exchange for an
upfront fee representing the present value of the Floor Income that we expect to earn on a notional amount of
underlying student loans being economically hedged, we will pay the counterparties the Floor Income earned
on that notional amount over the life of the Floor Income Contract. Specifically, we agree to pay the
counterparty the difference, if positive, between the fixed borrower rate less the SAP (see definition below)
spread and the average of the applicable interest rate index on that notional amount, regardless of the actual
balance of underlying student loans, over the life of the contract. The contracts generally do not extend over
the life of the underlying student loans. This contract effectively locks in the amount of Floor Income we will
earn over the period of the contract. Floor Income Contracts are not considered effective hedges under
SFAS No. 133, “Accounting for Derivative Instruments and Hedging Activities,” and each quarter we must
record the change in fair value of these contracts through income.

                                                                              4
Front-End Borrower Benefits — Financial incentives offered to borrowers at origination. Front-End
Borrower Benefits primarily represent our payment on behalf of borrowers for required FFELP fees, including
the federal origination fee and federal default fee. We account for these Front-End Borrower Benefits as loan
premiums amortized over the estimated life of the loans as an adjustment to the loan’s yield.

     Gross Floor Income — Floor Income earned before payments on Floor Income Contracts.

     GSE — The Student Loan Marketing Association was a federally chartered government-sponsored
enterprise and wholly owned subsidiary of SLM Corporation that was dissolved under the terms of the
Privatization Act (see definition below) on December 29, 2004.

    Guarantors — State agencies or non-profit companies that guarantee (or insure) FFELP student loans
made by eligible lenders under the HEA.

     HEA — The Higher Education Act of 1965, as amended.

     Interim ABCP Facility — An aggregate of $30 billion asset-backed commercial paper conduit facilities
that we entered into on April 30, 2007 in connection with the Merger (defined below under “Merger
Agreement”).

     Lender Partners — Lender Partners are lenders who originate loans under forward purchase commit-
ments to Sallie Mae where we own the loans from inception or, in most cases, acquire the loans soon after
origination.

     Managed Basis — We generally analyze the performance of our student loan portfolio on a Managed
Basis, under which we view both on-balance sheet student loans and off-balance sheet student loans owned by
the securitization trusts as a single portfolio, and the related on-balance sheet financings are combined with off-
balance sheet debt. When the term Managed is capitalized in this document, it is referring to Managed Basis.

     Merger Agreement — On April 16, 2007, the Company announced that a buyer group (“Buyer Group”)
led by J.C. Flowers & Co. (“J.C. Flowers”), Bank of America, N.A. and JPMorgan Chase, N.A. (the “Merger”)
signed a definitive agreement (“Merger Agreement”) to acquire the Company for approximately $25.3 billion
or $60.00 per share of common stock. (See also “Merger Agreement” filed with the SEC on the Company’s
Current Report on Form 8-K, dated April 18, 2007.) On January 25, 2008, the Company, Mustang Holding
Company Inc. (“Mustang Holding”), Mustang Merger Sub, Inc. (“Mustang Sub”), J.C. Flowers, Bank of
America, N.A. and JPMorgan Chase Bank, N.A. entered into a Settlement, Termination and Release
Agreement (the “Agreement”). Under the Agreement, a lawsuit filed by the Company related to the Merger, as
well as all counterclaims, was dismissed.

    Preferred Lender List — Most higher education institutions select a small number of lenders to
recommend to their students and parents. This recommended list is referred to as the Preferred Lender List.

     Preferred Channel Originations — Preferred Channel Originations are comprised of: 1) loans that are
originated by internally marketed Sallie Mae brands, and 2) student loans that are originated by lenders with
forward purchase commitment agreements with Sallie Mae and are committed for sale to Sallie Mae, such that
we either own them from inception or, in most cases, acquire them soon after origination.

      Private Education Consolidation Loans — Borrowers with multiple Private Education Loans (defined
below) may consolidate them into a single loan with Sallie Mae (Private Consolidation Loans@). The interest
rate on the new loan is variable rate with the spread set at the lower of the average weighted spread of the
underlying loans (available only to Sallie Mae customers) or a new spread as a result of favorable underwriting
criteria.

                                                         5
Private Education Loans — Education loans to students or parents of students that are not guaranteed or
reinsured under the FFELP or any other federal or private student loan program. Private Education Loans
include loans for higher education (undergraduate and graduate degrees) and for alternative education, such as
career training, private kindergarten through secondary education schools and tutorial schools. Higher
education loans have repayment terms similar to FFELP loans, whereby repayments begin after the borrower
leaves school. Our higher education Private Education Loans to students attending Title IV Schools are not
dischargeable in bankruptcy, except in certain limited circumstances. Repayment for alternative education
generally begins immediately.

     In the context of our Private Education Loan business, we use the term “non-traditional loans” to describe
education loans made to certain borrowers that have or are expected to have a high default rate as a result of a
number of factors, including having a lower tier credit rating, low program completion and graduation rates or,
where the borrower is expected to graduate, a low expected income relative to the borrower’s cost of
attendance.

     Privatization Act — The Student Loan Marketing Association Reorganization Act of 1996.

     Reconciliation Legislation — The Higher Education Reconciliation Act of 2005, which reauthorized the
student loan programs of the HEA and generally became effective as of July 1, 2006.
     Repayment Borrower Benefits — Financial incentives offered to borrowers based on pre-determined
qualifying factors, which are generally tied directly to making on-time monthly payments. The impact of
Repayment Borrower Benefits is dependent on the estimate of the number of borrowers who will eventually
qualify for these benefits and the amount of the financial benefit offered to the borrower. We occasionally
change Repayment Borrower Benefits programs in both amount and qualification factors. These programmatic
changes must be reflected in the estimate of the Repayment Borrower Benefits discount when made.

     Residual Interest — When we securitize student loans, we retain the right to receive cash flows from the
student loans sold to trusts we sponsor in excess of amounts needed to pay servicing, derivative costs (if any),
other fees, and the principal and interest on the bonds backed by the student loans. The Residual Interest,
which may also include reserve and other cash accounts, is the present value of these future expected cash
flows, which includes the present value of Embedded Fixed Rate Floor Income described above. We value the
Residual Interest at the time of sale of the student loans to the trust and at the end of each subsequent quarter.

     Retained Interest — The Retained Interest includes the Residual Interest (defined above) and servicing
rights (as the Company retains the servicing responsibilities).

      Risk Sharing — When a FFELP loan defaults, the federal government guarantees 97 percent of the
principal balance plus accrued interest (98 percent on loans disbursed before July 1, 2006) and the holder of
the loan is at risk for the remaining amount not guaranteed as a Risk Sharing loss on the loan. FFELP student
loans originated after October 1, 1993 are subject to Risk Sharing on loan default claim payments unless the
default results from the borrower’s death, disability or bankruptcy. FFELP loans serviced by a servicer that has
EP designation (see definition above) from ED are subject to one-percent Risk Sharing for claims filed on or
after July 1, 2006 and before October 1, 2007.

      Special Allowance Payment (“SAP”) — FFELP student loans originated prior to April 1, 2006 (with the
exception of certain PLUS and SLS loans discussed below) generally earn interest at the greater of the
borrower rate or a floating rate determined by reference to the average of the applicable floating rates (91-day
Treasury bill rate or commercial paper) in a calendar quarter, plus a fixed spread that is dependent upon when
the loan was originated and the loan’s repayment status. If the resulting floating rate exceeds the borrower
rate, ED pays the difference directly to us. This payment is referred to as the Special Allowance Payment or
SAP and the formula used to determine the floating rate is the SAP formula. We refer to the fixed spread to
the underlying index as the SAP spread. For loans disbursed after April 1, 2006, FFELP loans effectively only

                                                        6
earn at the SAP rate, as the excess interest earned when the borrower rate exceeds the SAP rate (Floor
Income) must be refunded to ED.

     Variable rate PLUS Loans and SLS Loans earn SAP only if the variable rate, which is reset annually,
exceeds the applicable maximum borrower rate. For PLUS loans disbursed on or after January 1, 2000, this
limitation on SAP was repealed effective April 1, 2006.

     Title IV Programs and Title IV Loans — Student loan programs created under Title IV of the HEA,
including the FFELP and the FDLP, and student loans originated under those programs, respectively.

     Variable Rate Floor Income — For FFELP Stafford student loans whose borrower interest rate resets
annually on July 1, we may earn Floor Income or Embedded Floor Income (see definitions above) based on a
calculation of the difference between the borrower rate and the then current interest rate. We refer to this as
Variable Rate Floor Income because Floor Income is earned only through the next reset date.

     Wholesale Consolidation Loans — During 2006, we implemented a loan acquisition strategy under
which we began purchasing a significant amount of FFELP Consolidation Loans, primarily via the spot
market, which augments our in-house FFELP Consolidation Loan origination process. Wholesale Consolida-
tion Loans are considered incremental volume to our core acquisition channels, which are focused on the retail
marketplace with an emphasis on our brand strategy.


                                                       7
PART I.

Item 1. Business

INTRODUCTION TO SLM CORPORATION

    SLM Corporation, more commonly known as Sallie Mae, is the market leader in education finance. SLM
Corporation is a holding company that operates through a number of subsidiaries. (References in this Annual
Report to the “Company” refer to SLM Corporation and its subsidiaries).

     Our primary business is to originate and hold student loans. We provide funding, delivery and servicing
support for education loans in the United States through our participation in the Federal Family Education
Loan Program (“FFELP”) and through our own non-federally guaranteed Private Education Loan programs.
We primarily market our FFELP Stafford loans and Private Education Loans through on-campus financial aid
offices. We have also expanded into direct-to-consumer marketing, primarily for Private Education Loans, to
reach those students and families that choose not to consult with the financial aid office.

     We have used both internal growth and strategic acquisitions to attain our leadership position in the
education finance marketplace. Our sales force, which delivers our products on campuses across the country, is
the largest in the student loan industry. The core of our marketing strategy is to promote our on-campus
brands, which generate student loan originations through our Preferred Channel. Loans generated through our
Preferred Channel are more profitable than loans acquired through other acquisition channels because we own
them earlier in the student loan’s life and generally incur lower costs to acquire such loans. We have built
brand leadership through the Sallie Mae name, the brands of our subsidiaries and those of our lender partners.
These sales and marketing efforts are supported by the largest and most diversified servicing capabilities in the
industry.

     We have expanded into a number of fee-based businesses, most notably, our Asset Performance Group
(“APG”) business (formerly, Debt Management Operations (“DMO”)). We also earn fees for a number of
services including student loan and guarantee servicing, 529 college-savings plan administration services, and
for providing processing capabilities and information technology to educational institutions. We also operate
an affinity marketing program through Upromise, Inc. (“Upromise”). References in this Annual Report to
“Upromise” refer to Upromise and its subsidiaries.

    At December 31, 2007, we had approximately 11,000 employees.

CURRENT BUSINESS STRATEGY

     On September 27, 2007, the College Cost Reduction and Access Act of 2007 (“CCRAA”) was signed
into law by the President, resulting in, among other things, a reduction in the yield received by the Company
on FFELP loans originated on or after October 1, 2007. In the summer of 2007, the global capital markets
began to experience a severe dislocation that has persisted to present. This dislocation, along with a reduction
in the Company’s unsecured debt ratings caused by the proposed Merger, resulted in more limited access to
the capital markets than the Company has enjoyed in the past and a substantial increase in its cost of newly
obtained funding.

     Our management team is evaluating certain aspects of our business in light of the impact of the CCRAA
and the current challenges in the capital markets. The CCRAA has a number of important implications for the
profitability of our FFELP loan business, including a reduction in Special Allowance Payments, the elimination
of the Exceptional Performer designation and the corresponding reduction in default payments to 97 percent
through 2012 and 95 percent thereafter, an increase in the lender paid origination fees for certain loan types
and a reduction in default collection retention fees and account maintenance fees related to guaranty agency
activities. As a result, we expect that the CCRAA will significantly reduce and, combined with higher
financing costs, could possibly eliminate the profitability of new FFELP loan originations, while also
increasing our Risk Sharing in connection with our FFELP loan portfolio.

                                                        8
We plan to curtail less profitable student loan origination and acquisition activities that have less strategic
value, including originations of Private Education Loans for high default rate and lower-tier credit borrowers,
as well as spot purchases and Wholesale Consolidation Loan purchases, all of which will also reduce our
funding needs. We expect to minimize incremental FFELP Consolidation Loan volume as a result of
significant margin erosion for FFELP Consolidation Loans created by the combined effect of the CCRAA and
elevated funding costs. However, we will continue our efforts to protect select FFELP assets existing in our
portfolio. We expect to continue to aggressively pursue other FFELP-related fee income opportunities such as
FFELP loan servicing, guarantor servicing and collections. In addition, we plan to reduce and, over time, to no
longer offer certain borrower benefits in connection with both our FFELP loans and our Private Education
Loans.
     We expect to continue to focus on generally higher-margin Private Education Loans, originated both
through our school channel and our direct-to-consumer channel, with particular attention to upholding our
more stringent underwriting standards. In January 2008, we notified some of our school customers whose
students have non-traditional loans that we were curtailing certain high default rate lending programs and
reviewing the pricing of others. Actual credit performance at these programs was materially below our original
expectations. Charge-offs at these non-traditional schools are largely driven by low program completion and
graduation rates. The non-traditional portfolio is also particularly impacted by the weakening U.S. economy.
We also expect to adjust our Private Education Loan pricing at all schools to reflect the current financing and
market conditions.
     We expect to see lenders exit the student loan industry in response to the CCRAA and current conditions
in the credit markets and, as a result, expect to partially offset declining loan volumes caused by our more
selective lending policies with increased market share assumed from participants exiting the industry.
     The impacts of the CCRAA as well as the challenges we are facing in the capital markets are also
requiring us to rationalize our business operations and reduce our costs. We are undertaking a thorough review
of all of our business units with a goal of achieving appropriate risk-adjusted returns across all of our business
segments and providing cost-effective services. As a result, we aim to reduce our operating expenses by up to
20 percent as compared to 2007 operating expenses by year-end 2009, before adjusting for growth and other
investments. Since year-end 2007, we have reduced our work force by approximately three percent.

BUSINESS SEGMENTS
     We provide an array of credit products and related services to the higher education and consumer credit
communities and others through two primary business segments: our Lending business segment and our APG
business segment. These defined business segments operate in distinct business environments and have unique
characteristics and face different opportunities and challenges. They are considered reportable segments under
the Financial Accounting Standards Board’s (“FASB”) Statement of Financial Accounting Standards (“SFAS”)
No. 131, “Disclosures about Segments of an Enterprise and Related Information,” based on quantitative
thresholds applied to the Company’s financial statements. In addition, within our Corporate and Other business
segment, we provide a number of complementary products and services to guarantors and lender partners that
are managed within smaller operating segments, the most prominent being our Guarantor Servicing and Loan
Servicing businesses. Our Corporate and Other business segment also includes the activities of our Upromise
subsidiary. In accordance with SFAS No. 131, we include in Note 20 to our consolidated financial statements,
“Segment Reporting,” separate financial information about our operating segments.
      Management, including the Company’s chief operating decision makers, evaluates the performance of the
Company’s operating segments based on their profitability as measured by “Core Earnings.” Accordingly, we
provide information regarding the Company’s reportable segments in this report based on “Core Earnings.”
“Core Earnings” are the primary financial performance measures used by management to develop the
Company’s financial plans, track results, and establish corporate performance targets and incentive compensa-
tion. While “Core Earnings” are not a substitute for reported results under generally accepted accounting
principles in the United States (“GAAP”), the Company relies on “Core Earnings” in operating its business
because “Core Earnings” permit management to make meaningful period-to-period comparisons of the

                                                         9
operational and performance indicators that are most closely assessed by management. Management believes
this information provides additional insight into the financial performance of the core business activities of our
operating segments. (See “MANAGEMENT’S DISCUSSION AND ANALYSIS OF FINANCIAL CONDI-
TION AND RESULTS OF OPERATIONS — BUSINESS SEGMENTS” for a detailed discussion of our “Core
Earnings,” including a table that summarizes the pre-tax differences between “Core Earnings” and GAAP by
business segment and the limitations to this presentation. )
     We generate most of our “Core Earnings” earnings in our Lending business from the spread between the
yield we receive on our Managed portfolio of student loans and the cost of funding these loans less the
provisions for loan losses. We incur servicing, selling and administrative expenses in providing these products
and services, and provide for loan losses. On our consolidated statement of income, prepared in accordance
with GAAP, this spread income is reported as “net interest income” for on-balance sheet loans, and as “gains
on student loan securitizations” and “servicing and securitization revenue” for off-balance sheet loans for
which we have a Retained Interest. Total “Core Earnings” revenues for this segment were $1.4 billion in 2007.
     In our APG business segment, we provide a wide range of accounts receivable and collections services
including student loan default aversion services, defaulted student loan portfolio management services,
contingency collections services for student loans and other asset classes, and accounts receivable management
and collection for purchased portfolios of receivables that are delinquent or have been charged off by their
original creditors as well as sub-performing and non-performing mortgage loans. In the purchased receivables
business, we focus on a variety of consumer debt types with emphasis on charged-off credit card receivables
and distressed mortgage receivables. We purchase these portfolios at a discount to their face value, and then
use both our internal collection operations coupled with third-party collection agencies to maximize the
recovery on these receivables.

LENDING BUSINESS SEGMENT
     In our Lending business segment, we originate and acquire both federally guaranteed student loans
(FFELP loans), which are administered by the U.S. Department of Education (“ED”), and Private Education
Loans, which are not federally guaranteed. Borrowers use Private Education Loans primarily to supplement
federally guaranteed loans in meeting the cost of education. We manage the largest portfolio of FFELP and
Private Education Loans in the student loan industry, serving over 10 million student and parent customers
through our ownership and management of $163.6 billion in Managed student loans as of December 31, 2007,
of which $135.2 billion or 83 percent are federally insured. We serve a diverse range of clients that includes
over 6,000 educational and financial institutions and state agencies. We are the largest servicer of student
loans, servicing a portfolio of $127.4 billion of FFELP loans and $32.6 billion of Private Education Loans as
of December 31, 2007. We also market student loans, both federal and private, directly to the consumer. In
addition to education lending, we originate mortgage and consumer loans. In 2007 we originated $848 million
in mortgage and consumer loans. Our mortgage and consumer loan portfolio totaled $545 million at
December 31, 2007, of which $19 million are mortgages in the held-for-sale portfolio.


                                                       10
Student Lending Marketplace

     The following chart shows estimated sources of funding for attending two-year and four-year colleges for
the academic year (“AY”) ending June 30, 2008 (AY 2007-2008). Approximately 36 percent of the funding
comes from federally guaranteed student loans and Private Education Loans. Parent/student contributions
consist of savings/investments, current period earnings and other loans obtained through the normal financial
aid process.

                         Sources of Funding for College Attendance — AY 2007-2008(1)
                                          Total Projected Cost — $258 Billion
                                                  (dollars in billions)


                            Parent/Student
                                                                                            Federal Student
                            Contributions
                                                           $71                                   Loans
                                                                           $74


                                                                              $18
                                                               $95
                                                                                        Private Education
                                                                                              Loans
                         Scholarships, Grants, &
                                  Other


                   (1)
                         Source: Based on estimates by Octameron Associates, “Don’t Miss Out,” 32nd Edition; College Board, “2007
                         Trends in Student Aid”; and Sallie Mae. Includes tuition, room, board, transportation and miscellaneous costs
                         for two and four year college degree-granting programs.


  Federally Guaranteed Student Lending Programs

     There are two competing programs that provide student loans where the ultimate credit risk lies with the
federal government: the FFELP and the Federal Direct Lending Program (“FDLP”). FFELP loans are provided
by private sector institutions and are ultimately guaranteed by ED except for the Risk Sharing loss. FDLP
loans are funded by taxpayers and provided to borrowers directly by ED on terms similar to student loans in
the FFELP. In addition to these government guaranteed programs, financial institutions also make Private
Education Loans, where the lender or holder assumes the credit risk of the borrower.

     For the federal fiscal year (“FFY”) ended September 30, 2007 (FFY 2007), ED estimated that the
FFELP’s market share in federally guaranteed student loans was 80 percent, up from 79 percent in FFY 2006.
(See “LENDING BUSINESS SEGMENT — Competition.”) Total FFELP and FDLP volume for FFY 2007
grew by 7 percent, with the FFELP portion growing 8 percent.

     The Higher Education Act (the “HEA”) includes regulations that cover every aspect of the servicing of a
federally guaranteed student loan, including communications with borrowers, loan originations and default
aversion. Failure to service a student loan properly could jeopardize the guarantee on federal student loans.
This guarantee generally covers 98 and 97 percent (95 percent after 2012) of the student loan’s principal and
accrued interest for loans disbursed before and after July 1, 2006, respectively. In the case of death, disability
or bankruptcy of the borrower, the guarantee covers 100 percent of the student loan’s principal and accrued
interest.

                                                                 11
FFELP student loans are guaranteed by state agencies or non-profit companies called guarantors, with ED
providing reinsurance to the guarantor. Guarantors are responsible for performing certain functions necessary
to ensure the program’s soundness and accountability. These functions include reviewing loan application data
to detect and prevent fraud and abuse and to assist lenders in preventing default by providing counseling to
borrowers. Generally, the guarantor is responsible for ensuring that loans are being serviced in compliance
with the requirements of the HEA. When a borrower defaults on a FFELP loan, we submit a claim to the
guarantor who reimburses us for principal and accrued interest subject to the Risk Sharing (See APPENDIX A,
“FEDERAL FAMILY EDUCATION LOAN PROGRAM,” to this document for a more complete description
of the role of guarantors.)

  Private Education Loan Products
     In addition to federal loan programs, which have statutory limits on annual and total borrowing, we
sponsor a variety of Private Education Loan programs and purchase loans made under such programs to bridge
the gap between the cost of education and a student’s resources. The majority of our higher education Private
Education Loans are made in conjunction with a FFELP Stafford loan, and are marketed to schools through
the same marketing channels — and by the same sales force — as FFELP loans. In 2004, we expanded our
direct-to-consumer loan marketing channel with our Tuition AnswerSM loan program under which we originate
and purchase loans outside of the traditional financial aid process. We also originate and purchase Private
Education Loans marketed by our SLM Financial subsidiary to career training, technical and trade schools,
tutorial and learning centers, and private kindergarten through secondary education schools. These loans are
primarily made at schools not eligible for Title IV loans. Private Education Loans are discussed in more detail
below.

  Drivers of Growth in the Student Loan Industry
     The growth in our Managed student loan portfolio is driven by the growth in the overall student loan
marketplace, as well as by our own market share gains. Rising enrollment and college costs have resulted in
the size of the federally insured student loan market more than doubling over the last 10 years. Federally
insured student loan originations grew from $29.0 billion in FFY 1997 to $64.3 billion in FFY 2007.
      According to the College Board, tuition and fees at four-year public institutions and four-year private
institutions have increased 54 percent and 33 percent, respectively, in constant, inflation-adjusted dollars, since
AY 1997-1998. Under the FFELP, there are limits to the amount students can borrow each academic year. The
first loan limit increases since 1992 were implemented July 1, 2007 when freshman and sophomore limits
were increased to $3,500 and $4,500 from $2,625 and $3,500, respectively. The fact that guaranteed student
loan limits have not kept pace with tuition increases has driven more students and parents to Private Education
Loans to meet an increasing portion of their education financing needs. Loans — both federal and private — as
a percentage of total student aid were 53 percent of total student aid in AY 1996-1997 and 52 percent in AY
2006-2007. Private Education Loans accounted for 24 percent of total student loans — both federally
guaranteed and Private Education Loans — in AY 2006-2007, compared to 7 percent in AY 1997-1998.
     The National Center for Education Statistics predicts that the college-age population will increase
approximately 14 percent from 2007 to 2016. Demand for education credit will also increase due to the rise in
students not attending college directly from high school and adult education.


                                                        12
The following charts show the historical and projected enrollment and average tuition and fee growth for
four-year public and private colleges and universities.

                                                  Historical and Projected Enrollment
                                                              (in millions)
 Historical and Projected Enrollment Levels

                                                                                                                                                     20.4
                                                                                                                                         20.2
  21                                                                                                                              19.9
                                                                                                                          19.7
                                                                                                                   19.4
                                                                                                            19.1
                                                                                                18.8
                                                                                         18.6
                                                                             18.3
                                                                      18
                                                              17.7
                                                   17.5
                                         17.3
  18                             16.9
                          16.6
                  15.9
          15.3
  15

  12

   9

   6

   3

   0
          2000                   2003                        2006                        2009                      2012                  2015


                 Source: National Center for Education Statistics
                 Note: Total enrollment in all degree-granting institutions; middle alternative projections for 2006 onward.


                                                   Cost of Attendance(1)
                                         Cumulative % Increase from AY 1997-1998
100

 80

 60

 40

 20

   –
         98


                         99


                                    00


                                                    01


                                                                      02


                                                                                     03


                                                                                                       04


                                                                                                                     05


                                                                                                                                  06


                                                                                                                                                 07
       19


                     19


                                  20


                                                   20


                                                                     20


                                                                                    20


                                                                                                 20


                                                                                                                   20


                                                                                                                                 20


                                                                                                                                                20
                                                          Tuition & Fees 4-Year Private
                                                          Tuition & Fees 4-Year Public

                                           Source: The College Board
                                            (1)
                                                  Cost of attendance is in current dollars and includes
                                                  tuition, fees and on-campus room and board.


Sallie Mae’s Lending Business
     Our primary marketing point-of-contact is the school’s financial aid office where we focus on delivering
flexible and cost-effective products to the school and its students. Our sales force is the largest in the industry
and currently markets the following internal lender brands: Academic Management Services (“AMS”), Nellie
Mae, Sallie Mae Education Trust, SLM Financial, Student Loan Funding Resources (“SLFR”), Southwest
Student Services (“Southwest”) and Student Loan Finance Association (“SLFA”). We also actively market the
loan guarantee of United Student Aid Funds, Inc. (“USA Funds”) and its affiliate, Northwest Education Loan
Association (“NELA”), through a separate sales force.
       We acquire student loans from two principal sources: our Preferred Channel and strategic acquisitions.
     In 2007, we originated $25.5 billion in student loans through our Preferred Channel, of which a total of
$16.6 billion or 65 percent was originated through our internal lending brands. The mix of Preferred Channel
Originations marks a significant shift from the past, when our internal lending brands were the smallest
component of our Preferred Channel Originations. Internal lending brand growth is a key factor to our long-

                                                                           13
term market penetration. This positions us to control our future volume as well as the costs to originate new
assets. Our internal lending brand loans are our most valuable loans because we do not pay a premium other
than to ED to originate them. The adverse impact of the CCRAA on FFELP loan profitability has further
increased the importance of our internal lending brands as a vehicle for achieving appropriate risk-adjusted
returns.

     Preferred Channel Originations growth has been fueled by new business from schools leaving the FDLP
or other FFELP lending relationships, same school sales growth, and growth in the for-profit sector. Since
1999, we have partnered with over 300 schools that have chosen to return to the FFELP from the FDLP. Our
FFELP loan originations at these schools totaled over $2.4 billion in 2007. In addition to working with new
schools, we have also forged broader relationships with many of our existing school clients. Our FFELP and
private originations at for-profit schools have grown faster than at not-for-profit schools due to enrollment
trends as well as our increased market share of lending to these institutions. We expect that in 2008 and in
subsequent years this trend will be reversed. Many of our for-profit school customers have programs for which
we offer non-traditional loans. As we cut back on Private Education Loan programs to this non-traditional
segment of our customer base, we expect to lose FFELP loan volume originated through these schools as well.
Similarly, as we reduce premiums for lender partner and school-as-lender purchases, we expect to lose FFELP
volume. Accordingly, we expect volume in both FFELP loan and Private Education Loan originations to
decline in 2008 relative to 2007.

  Consolidation Loans

     Between 2003 and 2006, we experienced a surge in consolidation activity as a result of aggressive
marketing and historically low interest rates. This growth has contributed to the changing composition of our
student loan portfolio. FFELP Consolidation Loans earn a lower yield than FFELP Stafford Loans due
primarily to the Consolidation Loan Rebate Fee. The Consolidation Loan margin was 75 basis points lower
than a FFELP Stafford loan in repayment as a result of this fee. This negative impact is somewhat mitigated
by the longer average life of FFELP Consolidation Loans. FFELP Consolidation Loans now represent
67 percent of both our on-balance sheet federally guaranteed student loan portfolio and Managed federally
guaranteed portfolio, respectively.

     We expect the percentage of our portfolio consisting of Consolidation Loans will decline steadily over
time. The CCRAA dramatically reduced the margin on new FFELP Consolidation Loans and, as a result these
loans are only marginally profitable for high balance loans and are not profitable for lower loan balances.
Legislation passed in 2006 provided for all FFELP loans to bear a fixed rate to the borrower, thereby
eliminating the potential for the borrower to lock in a more beneficial interest rate on post-July 1, 2006 loans
in a low interest rate environment. This had a significant adverse impact on the Consolidation Loan industry
that developed as a result of the low interest rate environment that existed between 2000 and 2004.
Accordingly, we are no longer buying Wholesale Consolidation Loans or actively marketing Consolidation
Loans to our customer base. Finally, under the HEA, borrowers with loan balances exceeding $30,000 can
extend their repayment term without consolidating their loans. As a result of all of these factors, we believe
that FFELP loans will have a much lower propensity to consolidate in the future. We intend to accommodate
those borrowers who have high loan balances and who wish to consolidate their loans. We will also direct
borrowers wishing to extend their loan’s term to the FFELP extended repayment product, which we believe
will be an attractive alternative to a Consolidation Loan for borrowers seeking a lower monthly payment.

  GradPLUS

    The Deficit Reduction Act of 2005 expanded the existing Federal PLUS loan program to include graduate
and professional students (“GradPLUS Loans”). Previously, PLUS loans were restricted to parents of
dependent, undergraduate students.

    GradPLUS Loans generally have a lower rate of interest than our Private Education Loans and they allow
graduate and professional students to borrow up to the full cost of their education (tuition, room and board),

                                                       14
less other financial aid received. In 2007, we originated $606 million of GradPLUS loans which represented
two percent of our Preferred Channel Originations.


  Private Education Loans

     The rising cost of education has led students and their parents to seek additional private sources to
finance their education. Private Education Loans are often packaged as supplemental or companion products to
FFELP loans. Over the last several years, the growth of Private Education Loans has continued due to tuition
increasing faster than the rate of inflation coupled with stagnant FFELP lending limits. This growth combined
with the relatively higher spreads has led to Private Education Loans contributing a higher percentage of our
net interest margin in recent years. We expect this trend to continue in the foreseeable future in part due to
margin erosion for FFELP student loans. In 2007, Private Education Loans contributed 36 percent of our
overall “Core Earnings” net interest income before provisions for loan losses plus other income, up from
29 percent in 2006.

     The Higher Education Reconciliation Act of 2005 increased FFELP loan limits on July 1, 2007 for
freshman and sophomores. This, along with the introduction of GradPLUS Loans discussed above, will
somewhat offset the rate of growth in Private Education Loans in the future. We believe this loss of future
Private Education Loan volume for graduate students will be replaced by an increase in federally insured
loans.

     Since we bear the full credit risk for Private Education Loans, they are underwritten and priced according
to credit risk based upon customized consumer credit scoring criteria. We mitigate some of this credit risk by
providing price and eligibility incentives for students to obtain a credit-worthy cosigner, and 52 percent of our
Managed Private Education Loans have a cosigner. Due to their higher risk profile, Private Education Loans
earn higher spreads than their FFELP loan counterparts. In 2007, Private Education Loans earned an average
“Core Earnings” spread (before provisions for loan losses and the Interim ABCP Facility Fees) of 5.15 percent
versus an average “Core Earnings” spread of 1.04 percent for FFELP loans (before provisions for loan losses
and the Interim ABCP Facility Fees).

      Our largest Private Education Loan program is the Signature Student Loan», which is offered to
undergraduates and graduates through the financial aid offices of colleges and universities to supplement
traditional FFELP loans. We also offer specialized loan products to graduate and professional students
primarily through our MBA Loans», LAWLOANS» and, Sallie Mae Medical School Loans» and Sallie Mae
DENTALoans» programs. Generally, these loans do not require borrowers to begin repaying their loans until
after graduation and allow a grace period from six to nine months.

     In 2004 we began to offer Tuition Answer» loans directly to the consumer through targeted direct mail
campaigns and Web-based initiatives. Under the Tuition Answer loan program, creditworthy parents, sponsors
and students may borrow between $1,500 and $40,000 per year to cover any qualified higher education
expense, but now capped at the full cost of tuition and board at the school they attend. No school certification
is required, although a borrower must provide enrollment documentation. At December 31, 2007, we had
$3.3 billion of Tuition Answer loans outstanding in our Managed student loan portfolio.

     We also offer alternative Private Education Loans for information technology, cosmetology, mechanics,
medical/dental/lab, culinary and broadcasting education programs. On average, these career training programs
typically last fewer than 12 months. These loans require the borrower to begin repaying the loan immediately;
however, students can opt to make relatively small payments while enrolled. At December 31, 2007, we had
$2.4 billion of career training loans outstanding.


  Acquisitions

    We have acquired several companies in the student loan industry that have increased our sales and
marketing capabilities, added significant new brands and greatly enhanced our product offerings. The following

                                                       15
table provides a timeline of strategic acquisitions that have played a major role in the growth of our Lending
business.


                                         Lending Segment Timeline
            July
            1999                                                          October
                             July 2000
            Nellie                                                         2004
                            USA Group
            Mae                                                          Southwest


   1999              2000         2001   2002        2003         2004          2005       2006        2007


                            July 2000                       November      December
                             SLFR                             2003          2004
                                                              AMS          SLFA


Financing
     Prior to the announcement of the Merger, the Company funded its loan originations primarily with a
combination of term asset-backed securitizations and unsecured debt. Upon the announcement of the Merger
on April 17, 2007, credit spreads on our unsecured debt widened considerably, significantly increasing our
cost of accessing the unsecured debt markets. As a result, in the near term, we expect to fund our operations
primarily through the issuance of student loan asset-backed securities and borrowings under secured student
loan financing facilities, as further described below. We historically have been a regular issuer of term asset-
backed securities in the domestic and international capital markets. (See also “MANAGEMENT’S DISCUS-
SION AND ANALYSIS OF FINANCIAL CONDITION AND RESULTS OF OPERATIONS — LIQUIDITY
AND CAPITAL RESOURCES.”) For the reasons described above, securitization is currently and is likely to
continue to be our principal source of cost-effective financing. We expect approximately 90 percent or more of
our funding needs in 2008 will be satisfied through asset-backed securitizations.
     The Company has engaged J.P. Morgan Securities, Inc. (“JPMorgan”) and Banc of America Securities,
LLC (“BAS”) as Lead Arrangers and Joint Bookrunners along with Barclays Capital, The Royal Bank of
Scotland, plc and Deutsche Bank Securities, Inc. as Co-Lead Arrangers and Credit Suisse, New York Branch,
as Arranger to underwrite and arrange up to $28.0 billion of secured FFELP loan facilities and a $7.0 billion
secured private credit student loans facility (together, the “Facilities”).
      As of February 28, 2008, we anticipate closing on $23.4 billion of FFELP student loan ABCP conduit
facilities and $5.9 billion of Private Education Loan ABCP conduit facilities on February 29, 2008, or as soon
as practical thereafter. Also on that date, we anticipate closing on an additional $2.0 billion secured FFELP
loan facility. In addition, we anticipate closing on an additional $2.5 billion of student loan ABCP conduit
facilities by mid March 2008. The new $33.8 billion of financing facilities we expect to close on, which may
ultimately be increased to up to $35 billion in aggregate, will replace our $30 billion Interim ABCP Facility
and $6 billion ABCP facility. The initial term of each of the new facilities will be 364 days. These new
facilities will provide funding for certain of our FFELP loans and Private Education Loans until such time as
these loans are refinanced in the term ABS markets. In the event amounts outstanding under the Interim ABCP
Facility are not repaid by the Company in full, the Interim ABCP Facility will terminate on April 24, 2008.
     In connection with our financing programs, we undertake regular investor development efforts intended to
continually expand and diversify our pool of investors.
     One of our major objectives when financing our business is to minimize interest rate risk by matching the
interest rate and term characteristics of our Managed assets with our Managed liabilities, generally on a pooled

                                                      16
basis, to the extent practical. To achieve this objective, we use derivative financial instruments extensively to
reduce our interest rate and foreign currency exposure. Match funding and interest rate risk management also
help stabilize our student loan spread in various interest rate environments.
      On February 4, 2008, Standard & Poor’s Ratings Services announced that it lowered our credit ratings to
“BBB-/A-3” from “BBB+/A-2.” Standard & Poor’s also announced that our rating remains on CreditWatch
with negative implications, pending the closing of the new asset-backed commercial paper conduit discussed
above. Notwithstanding the lowering of our credit rating, we believe that we have taken several steps in the
last several months to further strengthen the company and position it for ratings improvement in the future.
These steps include raising more than $3.0 billion in equity capital, securing commitments for $33.8 billion in
financing from some of the world’s largest financial institutions, eliminating our equity forward positions and
curtailing certain private education lending programs to students attending schools where loan performance is
materially below our original expectations. We intend to continue to work with Standard & Poor’s and the
other rating agencies to demonstrate our financial strength and stability.

  Sallie Mae Bank
     On November 3, 2005, we announced that the Utah Department of Financial Institutions approved our
application for an industrial bank charter. Beginning in February and August 2006, Sallie Mae Bank (the
“Bank”) began funding and originating Private Education Loans and FFELP Consolidation Loans, respectively,
made by Sallie Mae to students and families nationwide. This allows us to capture the full economics of these
loans from origination. In addition, the industrial bank charter allows us to expand the products and services
we can offer to students and families. Funds received in connection with our tuition payment plan product are
deposited and held in escrow with the Bank. In addition, cash rebates that Upromise members earn from
qualifying purchases from Upromise’s participating companies are held by the Bank. These deposits are used
by the Bank for a low cost source of funding.

Competition
     Our primary competitor for federally guaranteed student loans is the FDLP, which in its first four years of
existence (FFYs 1994-1997) grew its market share of the total federally sponsored student loan market from
four percent in FFY 1994 to a peak of 34 percent in FFY 1997. The FDLP’s market share has steadily
declined since then to 20 percent in FFY 2007. Historically, we have also faced competition for both federally
guaranteed and non-guaranteed student loans from a variety of financial institutions including banks, thrifts
and state-supported secondary markets. However, as a result of the CCRAA and the dislocation in the capital
markets, the student loan industry is undergoing a significant transition. A number of student lenders have
ceased operations altogether or curtailed activity. The environment of aggressive price competition between
lenders has also decreased dramatically. Many of the lenders that remain in the business have been
rationalizing pricing by reducing borrower benefits. As a result of these factors, we believe that as the largest
student lender, we are well positioned to increase market share in the coming years. Our FFY 2007 FFELP
Preferred Channel Originations totaled $17 billion, representing a 27 percent market share.

ASSET PERFORMANCE GROUP BUSINESS SEGMENT
     In our APG segment, we provide a wide range of accounts receivable and collections services including
student loan default aversion services, defaulted student loan portfolio management services, and contingency
collections services for student loans and other asset classes. We also provide accounts receivable management and
collections services on consumer and mortgage receivable portfolios that we purchase. The table below presents a
timeline of key acquisitions that have fueled the growth of our APG business, including: General Revenue
Corporation (“GRC”) and Pioneer Credit Recovery (“PCR”), concentrated in the student loan industry; AFS
Holdings, LLC, the parent company of Arrow Financial Services, LLC (collectively, “AFS”), a debt management
company that purchases and services distressed debt in several industries including and outside of education
receivables; and GRP/AG Holdings, LLC (“GRP”), a debt management company that acquires and manages
portfolios of sub-performing and non-performing mortgage loans.

                                                        17
In recent years we have diversified our APG contingency revenue stream into the purchase of distressed
and defaulted receivables to complement our student loan business. We now have the expertise to acquire and
manage portfolios of sub-performing and non-performing mortgage loans, substantially all of which are
secured by one-to-four family residential real estate. We also have a servicing platform and a disciplined
portfolio pricing approach to several consumer debt asset classes.
                                             APG Segment Timeline

                                                 January                   September
                                                   2002
                        July 2000                                             2004
                                                  GRC
                       USA Group                                              AFS


   1999         2000         2001         2002             2003     2004         2005            2006     2007


                                                 January                                August
                                                   2002                                  2005
                                                   PCR                                   GRP


    In 2007, our APG business segment had revenues totaling $605 million and net income of $116 million.
Our largest customer, USA Funds, accounted for 28 percent of our revenue in 2007.

Products and Services
  Student Loan Default Aversion Services
     We provide default aversion services for five guarantors, including the nation’s largest, USA Funds. These
services are designed to prevent a default once a borrower’s loan has been placed in delinquency status.

  Defaulted Student Loan Portfolio Management Services
     Our APG business segment manages the defaulted student loan portfolios for six guarantors under long-
term contracts. APG’s largest customer, USA Funds, represents approximately 17 percent of defaulted student
loan portfolios in the market. Our portfolio management services include selecting collection agencies and
determining account placements to those agencies, processing loan consolidations and loan rehabilitations, and
managing federal and state offset programs.

  Contingency Collection Services
      Our APG business segment is also engaged in the collection of defaulted student loans and other debt on
behalf of various clients including guarantors, federal agencies, schools, credit card issuers, utilities, and other
retail clients. We earn fees that are contingent on the amounts collected. We provide collection services for
ED and now have approximately 11 percent of the total market for such services. We have relationships with
more than 900 colleges and universities to provide collection services for delinquent student loans and other
receivables from various campus-based programs.

  Collection of Purchased Receivables
      In our APG business, we also purchase delinquent and defaulted receivables from credit originators and
other holders of receivables at a significant discount from the face value of the debt instruments. In addition,
we purchase sub-performing and non-performing mortgage receivables at a discount usually calculated as a
percentage of the underlying collateral. We use a combination of internal collectors and outside collection
agencies to collect on these portfolios, seeking to attain the highest cost/benefit for our overall collection
strategy. We recognize revenue primarily using the effective yield method, though we use the cost recovery

                                                            18
method when appropriate, in certain circumstances. A major success factor in the purchased receivables
business is the ability to effectively price the portfolios. We conduct both quantitative and qualitative analysis
to appropriately price each portfolio to yield a return consistent with our APG financial targets.

Competition
      The private sector collections industry is highly fragmented with few large companies and a large number
of small scale companies. The APG businesses that provide third-party collections services for ED, FFELP
guarantors and other federal holders of defaulted debt are highly competitive. In addition to competing with
other collection enterprises, we also compete with credit grantors who each have unique mixes of internal
collections, outsourced collections, and debt sales. Although the scale, diversification, and performance of our
APG business has been a competitive advantage, the trend in the collections industry is for credit grantors to
sell portfolios rather than to manage contingency collections.
     In the purchased paper business, the marketplace is trending more toward open market competitive
bidding rather than solicitation by sellers to a select group of potential buyers. Price inflation and the
availability of capital in the sector contribute to this trend. Unlike many of our competitors, our APG business
does not rely solely on purchased portfolio revenue. This enables us to maintain pricing discipline and
purchase only those portfolios that are expected to meet our profitability and strategic goals. Portfolios are
purchased individually on a spot basis or through contractual relationships with sellers to periodically purchase
portfolios at set prices. We compete primarily on price, and additionally on the basis of our reputation and
industry experience.

CORPORATE AND OTHER BUSINESS SEGMENT
     The Company’s Corporate and Other business segment includes the aggregate activity of its smaller
operating segments, primarily its Guarantor Servicing, Loan Servicing, and Upromise operating segments.
Corporate and Other also includes several smaller products and services, including comprehensive financing
and loan delivery solutions to college financial aid offices and students to streamline the financial aid process.

Guarantor Services
     We earn fees for providing a full complement of administrative services to FFELP guarantors. FFELP
student loans are guaranteed by these agencies, with ED providing reinsurance to the guarantor. The guarantors
are non-profit institutions or state agencies that, in addition to providing the primary guarantee on FFELP
loans, are responsible for other activities, including:
     • guarantee issuance — the initial approval of loan terms and guarantee eligibility;
     • account maintenance — the maintaining, updating and reporting on records of guaranteed loans;
     • default aversion services — these services are designed to prevent a default once a borrower’s loan has
       been placed in delinquency status (we perform these activities within our APG segment);
     • guarantee fulfillment — the review and processing of guarantee claims;
     • post claim assistance — assisting borrowers in determining the best way to pay off a defaulted loan; and
     • systems development and maintenance — the development of automated systems to maintain compli-
       ance and accountability with ED regulations.
     Currently, we provide a variety of these services to nine guarantors and, in AY 2006-2007, we processed
$17.9 billion in new FFELP loan guarantees, of which $14.2 billion was for USA Funds, the nation’s largest
guarantor. We processed guarantees for approximately 32 percent of the FFELP loan market in AY 2006-2007.
    Guarantor servicing fee revenue, which includes guarantee issuance and account maintenance fees, was
$156 million for the year ended December 31, 2007, 86 percent of which we earned from services performed
on behalf of USA Funds. Under some of our guarantee services agreements, including our agreement with
USA Funds, we receive certain scheduled fees for the services that we provide under such agreements. The

                                                        19
payment for these services includes a contractually agreed upon set percentage of the account maintenance
fees that the guarantors receive from ED.

     The Company’s guarantee services agreement with USA Funds has a five-year term that will be
automatically increased by an additional year on October 1 of each year unless a prior notice is given by
either party.

     Our primary non-profit competitors in guarantor servicing are state and non-profit guarantee agencies that
provide third-party outsourcing to other guarantors.

     (See APPENDIX A, “FEDERAL FAMILY EDUCATION LOAN PROGRAM — Guarantor Funding” for
details of the fees paid to guarantors.)


Upromise

     Upromise has a number of programs that encourage consumers to save for the cost of college education.
Upromise has established an affinity marketing program which is designed to increase consumer purchases of
merchant goods and services and to promote saving for college by consumers who are members of this
program. Merchant partners generally pay Upromise transaction fees based on member purchase volume,
either online or in stores depending on the contractual arrangement with the merchant partner. A percentage of
the consumer members’ purchases is set aside in an account maintained by Upromise on the members’ behalf.

    Upromise, through its wholly owned subsidiaries, Upromise Investments, Inc. (“UII”), a registered
broker-dealer, and Upromise Investment Advisors, LLC (“UIA”), provides transfer and servicing agent services
and program management associated with various 529 college-savings plans. Upromise manages $19 billion in
529 college-savings plans.


REGULATION

      Like other participants in the FFELP, the Company is subject to the HEA and, from time to time, to
review of its student loan operations by ED and guarantee agencies. ED is authorized under its regulations to
limit, suspend or terminate lenders from participating in the FFELP, as well as impose civil penalties if lenders
violate program regulations. The laws relating to the FFELP are subject to revision. In addition, Sallie Mae,
Inc., as a servicer of federal student loans, is subject to certain ED regulations regarding financial responsibil-
ity and administrative capability that govern all third-party servicers of insured student loans. Failure to satisfy
such standards may result in the loss of the government guarantee of the payment of principal and accrued
interest on defaulted FFELP loans. Also, in connection with our guarantor servicing operations, the Company
must comply with, on behalf of its guarantor servicing customers, certain ED regulations that govern guarantor
activities as well as agreements for reimbursement between the Secretary of Education and the Company’s
guarantor servicing customers. Failure to comply with these regulations or the provisions of these agreements
may result in the termination of the Secretary of Education’s reimbursement obligation.

      The Company’s originating or servicing of federal and private student loans also subjects it to federal and
state consumer protection, privacy and related laws and regulations. Some of the more significant federal laws
and regulations that are applicable to our student loan business include:

     • the Truth-In-Lending Act;

     • the Fair Credit Reporting Act;

     • the Equal Credit Opportunity Act;

     • the Gramm-Leach Bliley Act; and

     • the U.S. Bankruptcy Code.

                                                        20
APG’s debt collection and receivables management activities are subject to federal and state consumer
protection, privacy and related laws and regulations. Some of the more significant federal laws and regulations
that are applicable to our APG business include:
    • the Fair Debt Collection Practices Act;
    • the Fair Credit Reporting Act;
    • the Gramm-Leach-Bliley Act; and
    • the U.S. Bankruptcy Code.
     In addition, our APG business is subject to state laws and regulations similar to the federal laws and
regulations listed above. Finally, certain APG subsidiaries are subject to regulation under the HEA and under
the various laws and regulations that govern government contractors.
    Sallie Mae Bank is subject to Utah banking regulations as well as regulations issued by the Federal
Deposit Insurance Corporation, and undergoes periodic regulatory examinations.
    Finally, Upromise’s affiliates, which administer 529 college-savings plans, are subject to regulation by the
Municipal Securities Rulemaking Board, the National Association of Securities Dealers, Inc. and the Securities
and Exchange Commission (“SEC”) through the Investment Advisers Act of 1940.

AVAILABLE INFORMATION
     The SEC maintains an Internet site (http://www. sec. gov) that contains periodic and other reports such as
annual, quarterly and current reports on Forms 10-K, 10-Q and 8-K, respectively, as well as proxy and
information statements regarding SLM Corporation and other companies that file electronically with the SEC.
Copies of our annual reports on Form 10-K and our quarterly reports on Form 10-Q are available on our
website as soon as reasonably practicable after we electronically file such reports with the SEC. Investors and
other interested parties can also access these reports at www. salliemae.com/about/investors.
    Our Code of Business Conduct, which applies to Board members and all employees, including our Chief
Executive Officer and Chief Financial Officer, is also available, free of charge, on our website at
www.salliemae.com/about/business_code. htm. We intend to disclose any amendments to or waivers from our
Code of Business Conduct (to the extent applicable to our Chief Executive Officer or Chief Financial Officer)
by posting such information on our website.
     In 2007, the Company submitted the annual certification of its Chief Executive Officer regarding the
Company’s compliance with the NYSE’s corporate governance listing standards, pursuant to Section 303A.12(a)
of the NYSE Listed Company Manual.
     In addition, we filed as exhibits to the Company’s Annual Report on Form 10-K for the year ended
December 31, 2006 and to this Annual Report on Form 10-K, the certifications required under Section 302 of
the Sarbanes-Oxley Act of 2002.


                                                      21
Item 1A. Risk Factors
LENDING BUSINESS SEGMENT — FFELP STUDENT LOANS
Because of the new FFELP economics resulting from the College Cost Reduction and Access Act of 2007
and the increased funding spreads in the current capital markets, we have made significant changes to our
business strategy, but there can be no assurance that such changes will be effective in meeting these
challenges.
     On September 27, 2007, the College Cost Reduction and Access Act of 2007 (“CCRAA”) was signed
into law by the President. The CCRAA substantially reduced the profitability of our FFELP business,
including a reduction in Special Allowance Payments, the elimination of the Exceptional Performer designa-
tion and the corresponding reduction in default payments to 97 percent through 2012 and 95 percent thereafter,
an increase in the lender paid origination fees for certain loan types, and reduction in default collections
retention fees and account maintenance fees related to guaranty agency activities. As a result, assuming no
reductions to borrower benefits or to our operating and servicing costs, we expect that the CCRAA will reduce
substantially our pre-tax yield on FFELP loans. This reduction combined with higher financing costs resulting
from the severe dislocations in the global capital markets, could possibly eliminate the profitability of new
FFELP loan originations, while increasing our Risk Sharing in connection with our FFELP loan portfolio. We
also expect that low-balance FFELP Consolidation Loans will no longer be profitable.
    As a result of these developments, management has revised its business strategy to:
    • Focus on origination and acquisition activities for both FFELP loans and Private Education Loans that
      generate acceptable returns under the new FFELP economics;
    • Curtail unprofitable originations that have less strategic value, including:
       • Education loans made to certain borrowers that have or are expected to have a high default rate
         (see “GLOSSARY — Private Education Loans”); and
       • Wholesale Consolidation Loan acquisitions and low-balance FFELP Consolidation Loan originations.
    • Adjust the pricing of Private Education Loan products to reflect market conditions; and
    • Reduce or, over time, eliminate borrower benefits on FFELP loans.
     In addition, we have reduced the premium that we pay for FFELP loan volume at certain school-as-lender
clients. We also anticipate reducing the premium that we pay for FFELP loan volume with certain of our
lender partners. These actions are likely to effectively end our school-as-lender relationships and to result in
certain of our lender partners either exiting the FFELP business or seeking others with whom to partner. These
actions could also adversely affect the growth in our guarantee and APG collection businesses.
      We also will undertake a comprehensive review of all of our business units with a goal of achieving
appropriate risk-adjusted returns across all of our business segments and providing cost-effective services. In
addition, we aim to reduce our operating expenses by up to 20 percent as compared to 2007 operating
expenses by year-end 2009, before adjusting for growth and other investments. Since year-end 2007, as part of
this expense reduction effort, we have reduced our work force by approximately three percent. Accordingly,
we could lose management that are key to managing operational risk.
     There can be no assurance that changes we are making or may make in the future to address these
developments will be successful in meeting the significant challenges of the new FFELP economics and the
increased funding spreads in the current capital markets.

A larger than expected increase in third-party consolidation activity may reduce our loan spreads, materially
impair our Retained Interest, reduce our interest earning assets and otherwise materially adversely affect
our results of operations.
     If third-party consolidation activity increases beyond management’s expectations, our student loan spread
may be adversely affected; our Retained Interest may be materially impaired; our future earnings may be
reduced from the loss of interest earning assets; and our results of operations may be adversely affected. Our
student loan spread may be adversely affected because third-party consolidators generally target our highest
yielding FFELP Loans and an increased run-off of Private Education Loans, which generally have higher

                                                       22
yields than our FFELP loans, would change the overall mix within our portfolio resulting in a reduction to our
weighted-average loan spread. Our Retained Interest may be materially impaired if consolidation activity
reaches levels not anticipated by management. We may also incur impairment charges if we increase our
expected future Constant Prepayment Rate (“CPR”) assumptions used to value the Residual Interest as a result
of such unanticipated levels of consolidation. The potentially material adverse affect on our operating results
related to FFELP loans also relates to our hedging activities in connection with Floor Income. We enter into
certain Floor Income Contracts under which we receive an upfront fee in exchange for our payment of the
Floor Income earned on a notional amount of underlying FFELP Loans over the life of the Floor Income
Contract. If third-party consolidation activity that involves refinancing a Sallie Mae managed existing FFELP
Loan with a new third-party owned FFELP Loan increases substantially, then the Floor Income that we are
obligated to pay under such Floor Income Contracts may exceed the Floor Income actually generated from the
underlying FFELP loans, possibly to a material extent. In such a scenario, we would either close out the
related Floor Income Contracts or purchase an offsetting hedge. In either case, the adverse impact on both our
GAAP and “Core Earnings” could be material. (See “MANAGEMENT’S DISCUSSION AND ANALYSIS OF
FINANCIAL CONDITION AND RESULTS OF OPERATIONS — LENDING BUSINESS SEGMENT —
Floor Income — Managed Basis.”)

Incorrect estimates and assumptions by management in connection with the preparation of our consolidated
financial statements could adversely affect the reported amounts of assets and liabilities and the reported
amounts of income and expenses.
      The preparation of our consolidated financial statements requires management to make certain critical
accounting estimates and assumptions that could affect the reported amounts of assets and liabilities and the
reported amounts of income and expense during the reporting periods. (See “MANAGEMENT’S DISCUS-
SION AND ANALYSIS OF FINANCIAL CONDITION AND RESULTS OF OPERATIONS — CRITICAL
ACCOUNTING POLICIES AND ESTIMATES.”) For example, for both our federally insured and Private
Education Loans, the unamortized portion of premiums and discounts is included in the carrying value of the
student loan on the consolidated balance sheet. We recognize income on our student loan portfolio based on
the expected yield of the student loan after giving effect to the amortization of purchase premiums and
accretion of student loan income discounts, as well as the impact of Repayment Borrower Benefits. In arriving
at the expected yield, we make a number of estimates that when changed are reflected as a cumulative
catch-up from the inception of the student loan. The most sensitive estimate for premium and discount
amortization is the estimate of the CPR, which measures the rate at which loans in the portfolio pay before
their stated maturity. The CPR is used in calculating the average life of the portfolio. A number of factors can
affect the CPR estimate such as the rate of consolidation activity and default rates. If we make an incorrect
CPR estimate, the previously recognized income on our student loan portfolio based on the expected yield of
the student loan will need to be adjusted in the current period.
     The amount of loan loss reserves also depends on estimates. We maintain an allowance for loan losses at
an amount believed to be sufficient to absorb losses incurred in our FFELP loan and Private Education Loan
portfolios based on estimated probable net credit losses as of the reporting date. We analyze those portfolios to
determine the effects that the various stages of delinquency have on borrower default behavior and ultimate
charge-off. When calculating the allowance for loan losses on Private Education Loans, we divide the portfolio
into categories of similar risk characteristics based on loan program type, loan status (in-school, grace,
repayment, forbearance, delinquency), underwriting criteria, existence or absence of a cosigner, and aging. We
use historical experience coupled with qualitative factors regarding changes in portfolio mix, macroeconomic
indicators, policies, procedures, laws, regulations, underwriting, and other factors to estimate default and
collection rate projections. We then apply these default and collection rate projections to each category of loan
to estimate the necessary allowance balance. Because the process relies on historical experience, if current or
future loan loss experience varies significantly from the past, our allowance could be deemed inadequate to
cover incurred losses in the portfolio. Additionally, since the allowance estimate is also reliant on other
qualitative factors, management’s ability to determine which qualitative factors are relevant to the allowance
and our ability to accurately incorporate these factors into our estimates can have a material impact on the
allowance.


                                                       23
slm 200710KBOW49222BOW014_BITS_NFeb292008

Weitere ähnliche Inhalte

Was ist angesagt?

dover 2002%2010K
dover 2002%2010Kdover 2002%2010K
dover 2002%2010Kfinance30
 
xcel energy 3_2_07SPS
xcel energy 3_2_07SPSxcel energy 3_2_07SPS
xcel energy 3_2_07SPSfinance26
 
Dollar general 10k
Dollar general 10kDollar general 10k
Dollar general 10kdddqwe123
 
xcel energy SPS_2005_10K
xcel energy SPS_2005_10Kxcel energy SPS_2005_10K
xcel energy SPS_2005_10Kfinance26
 
NYSE:PRO 2008 Annual Report
NYSE:PRO 2008 Annual ReportNYSE:PRO 2008 Annual Report
NYSE:PRO 2008 Annual ReportMatthew Balfour
 
Realogy8-KFiling11_13_08
Realogy8-KFiling11_13_08Realogy8-KFiling11_13_08
Realogy8-KFiling11_13_08finance35
 
xcel energy 10k SPS_rev
xcel energy 10k SPS_revxcel energy 10k SPS_rev
xcel energy 10k SPS_revfinance26
 
toll brothers 200810K
toll brothers 200810Ktoll brothers 200810K
toll brothers 200810Kfinance50
 
xcel energy 2001 10-k
xcel energy 2001 10-kxcel energy 2001 10-k
xcel energy 2001 10-kfinance26
 
micron technollogy 10k_2008
micron technollogy 10k_2008micron technollogy 10k_2008
micron technollogy 10k_2008finance36
 
257 clearchanne
257  clearchanne257  clearchanne
257 clearchannefinance31
 
starbucks 10K_A_10K
starbucks  10K_A_10Kstarbucks  10K_A_10K
starbucks 10K_A_10Kfinance41
 

Was ist angesagt? (14)

dover 2002%2010K
dover 2002%2010Kdover 2002%2010K
dover 2002%2010K
 
xcel energy 3_2_07SPS
xcel energy 3_2_07SPSxcel energy 3_2_07SPS
xcel energy 3_2_07SPS
 
Dollar general 10k
Dollar general 10kDollar general 10k
Dollar general 10k
 
xcel energy SPS_2005_10K
xcel energy SPS_2005_10Kxcel energy SPS_2005_10K
xcel energy SPS_2005_10K
 
NYSE:PRO 2008 Annual Report
NYSE:PRO 2008 Annual ReportNYSE:PRO 2008 Annual Report
NYSE:PRO 2008 Annual Report
 
Realogy8-KFiling11_13_08
Realogy8-KFiling11_13_08Realogy8-KFiling11_13_08
Realogy8-KFiling11_13_08
 
Q2 2009 Earning Report of Crown Crafts, Inc.
Q2 2009 Earning Report of Crown Crafts, Inc.Q2 2009 Earning Report of Crown Crafts, Inc.
Q2 2009 Earning Report of Crown Crafts, Inc.
 
xcel energy 10k SPS_rev
xcel energy 10k SPS_revxcel energy 10k SPS_rev
xcel energy 10k SPS_rev
 
toll brothers 200810K
toll brothers 200810Ktoll brothers 200810K
toll brothers 200810K
 
xcel energy 2001 10-k
xcel energy 2001 10-kxcel energy 2001 10-k
xcel energy 2001 10-k
 
Masco8K
Masco8KMasco8K
Masco8K
 
micron technollogy 10k_2008
micron technollogy 10k_2008micron technollogy 10k_2008
micron technollogy 10k_2008
 
257 clearchanne
257  clearchanne257  clearchanne
257 clearchanne
 
starbucks 10K_A_10K
starbucks  10K_A_10Kstarbucks  10K_A_10K
starbucks 10K_A_10K
 

Andere mochten auch

slm annrpt_2003
slm annrpt_2003slm annrpt_2003
slm annrpt_2003finance42
 
tenet healthcare QuarterEndedDecember312008PreparedRemarks
tenet healthcare QuarterEndedDecember312008PreparedRemarkstenet healthcare QuarterEndedDecember312008PreparedRemarks
tenet healthcare QuarterEndedDecember312008PreparedRemarksfinance42
 
KBR2007AnnualReport
KBR2007AnnualReportKBR2007AnnualReport
KBR2007AnnualReportfinance42
 
04_Fetter_Final
04_Fetter_Final04_Fetter_Final
04_Fetter_Finalfinance42
 
tenet healthcare QuarterEndedDecember312008PreparedRemarks
tenet healthcare QuarterEndedDecember312008PreparedRemarkstenet healthcare QuarterEndedDecember312008PreparedRemarks
tenet healthcare QuarterEndedDecember312008PreparedRemarksfinance42
 
pulte homes BCF65EEF-0BFE-4C58-8C84-345ECA968DBA_phm_Q42008WebcastSlides
pulte homes BCF65EEF-0BFE-4C58-8C84-345ECA968DBA_phm_Q42008WebcastSlidespulte homes BCF65EEF-0BFE-4C58-8C84-345ECA968DBA_phm_Q42008WebcastSlides
pulte homes BCF65EEF-0BFE-4C58-8C84-345ECA968DBA_phm_Q42008WebcastSlidesfinance42
 
dana holdings NominatingCommitteeCharter_013108
dana holdings NominatingCommitteeCharter_013108dana holdings NominatingCommitteeCharter_013108
dana holdings NominatingCommitteeCharter_013108finance42
 
dana holdings Bylaws2_Dec08
dana holdings Bylaws2_Dec08dana holdings Bylaws2_Dec08
dana holdings Bylaws2_Dec08finance42
 
terex BofA091708
terex BofA091708terex BofA091708
terex BofA091708finance42
 
dana holdings BusinessConduct_BOD_013108
dana holdings BusinessConduct_BOD_013108dana holdings BusinessConduct_BOD_013108
dana holdings BusinessConduct_BOD_013108finance42
 
14_Brown_InformationTechnology_Final
14_Brown_InformationTechnology_Final14_Brown_InformationTechnology_Final
14_Brown_InformationTechnology_Finalfinance42
 
tenet healthcare Earn_Rel_2007_Q4_FINAL2
tenet healthcare Earn_Rel_2007_Q4_FINAL2tenet healthcare Earn_Rel_2007_Q4_FINAL2
tenet healthcare Earn_Rel_2007_Q4_FINAL2finance42
 
dana holdings AuditCommitteeCharter_013108
dana holdings AuditCommitteeCharter_013108dana holdings AuditCommitteeCharter_013108
dana holdings AuditCommitteeCharter_013108finance42
 
tenet healthcare Q208Slides_FINAL
tenet healthcare Q208Slides_FINALtenet healthcare Q208Slides_FINAL
tenet healthcare Q208Slides_FINALfinance42
 
tenet healthcare CY0810KFinal
tenet healthcare CY0810KFinaltenet healthcare CY0810KFinal
tenet healthcare CY0810KFinalfinance42
 
tenet healthcare Form10QQtrEndedSeptember2003
tenet healthcare Form10QQtrEndedSeptember2003tenet healthcare Form10QQtrEndedSeptember2003
tenet healthcare Form10QQtrEndedSeptember2003finance42
 
terex Sanford053008
terex Sanford053008terex Sanford053008
terex Sanford053008finance42
 
slm 2001proxy
slm 2001proxyslm 2001proxy
slm 2001proxyfinance42
 

Andere mochten auch (18)

slm annrpt_2003
slm annrpt_2003slm annrpt_2003
slm annrpt_2003
 
tenet healthcare QuarterEndedDecember312008PreparedRemarks
tenet healthcare QuarterEndedDecember312008PreparedRemarkstenet healthcare QuarterEndedDecember312008PreparedRemarks
tenet healthcare QuarterEndedDecember312008PreparedRemarks
 
KBR2007AnnualReport
KBR2007AnnualReportKBR2007AnnualReport
KBR2007AnnualReport
 
04_Fetter_Final
04_Fetter_Final04_Fetter_Final
04_Fetter_Final
 
tenet healthcare QuarterEndedDecember312008PreparedRemarks
tenet healthcare QuarterEndedDecember312008PreparedRemarkstenet healthcare QuarterEndedDecember312008PreparedRemarks
tenet healthcare QuarterEndedDecember312008PreparedRemarks
 
pulte homes BCF65EEF-0BFE-4C58-8C84-345ECA968DBA_phm_Q42008WebcastSlides
pulte homes BCF65EEF-0BFE-4C58-8C84-345ECA968DBA_phm_Q42008WebcastSlidespulte homes BCF65EEF-0BFE-4C58-8C84-345ECA968DBA_phm_Q42008WebcastSlides
pulte homes BCF65EEF-0BFE-4C58-8C84-345ECA968DBA_phm_Q42008WebcastSlides
 
dana holdings NominatingCommitteeCharter_013108
dana holdings NominatingCommitteeCharter_013108dana holdings NominatingCommitteeCharter_013108
dana holdings NominatingCommitteeCharter_013108
 
dana holdings Bylaws2_Dec08
dana holdings Bylaws2_Dec08dana holdings Bylaws2_Dec08
dana holdings Bylaws2_Dec08
 
terex BofA091708
terex BofA091708terex BofA091708
terex BofA091708
 
dana holdings BusinessConduct_BOD_013108
dana holdings BusinessConduct_BOD_013108dana holdings BusinessConduct_BOD_013108
dana holdings BusinessConduct_BOD_013108
 
14_Brown_InformationTechnology_Final
14_Brown_InformationTechnology_Final14_Brown_InformationTechnology_Final
14_Brown_InformationTechnology_Final
 
tenet healthcare Earn_Rel_2007_Q4_FINAL2
tenet healthcare Earn_Rel_2007_Q4_FINAL2tenet healthcare Earn_Rel_2007_Q4_FINAL2
tenet healthcare Earn_Rel_2007_Q4_FINAL2
 
dana holdings AuditCommitteeCharter_013108
dana holdings AuditCommitteeCharter_013108dana holdings AuditCommitteeCharter_013108
dana holdings AuditCommitteeCharter_013108
 
tenet healthcare Q208Slides_FINAL
tenet healthcare Q208Slides_FINALtenet healthcare Q208Slides_FINAL
tenet healthcare Q208Slides_FINAL
 
tenet healthcare CY0810KFinal
tenet healthcare CY0810KFinaltenet healthcare CY0810KFinal
tenet healthcare CY0810KFinal
 
tenet healthcare Form10QQtrEndedSeptember2003
tenet healthcare Form10QQtrEndedSeptember2003tenet healthcare Form10QQtrEndedSeptember2003
tenet healthcare Form10QQtrEndedSeptember2003
 
terex Sanford053008
terex Sanford053008terex Sanford053008
terex Sanford053008
 
slm 2001proxy
slm 2001proxyslm 2001proxy
slm 2001proxy
 

Ähnlich wie slm 200710KBOW49222BOW014_BITS_NFeb292008

urs Form 10-K 2007
urs Form 10-K 2007urs Form 10-K 2007
urs Form 10-K 2007finance38
 
urs Form 10-K 2006
urs Form 10-K 2006urs Form 10-K 2006
urs Form 10-K 2006finance38
 
GNW 2005 AR 10K
GNW 2005 AR 10KGNW 2005 AR 10K
GNW 2005 AR 10Kfinance24
 
GNW 2005 AR 10K
GNW 2005 AR 10KGNW 2005 AR 10K
GNW 2005 AR 10Kfinance24
 
toll brothers 200710K
toll brothers 200710Ktoll brothers 200710K
toll brothers 200710Kfinance50
 
Q3 2009 Earning Report of Craftmade International
Q3 2009 Earning Report of Craftmade InternationalQ3 2009 Earning Report of Craftmade International
Q3 2009 Earning Report of Craftmade Internationalearningreport earningreport
 
UNITED STATES SECURITIES AND EXCHANGE COMMISSION Was.docx
UNITED STATES SECURITIES AND EXCHANGE COMMISSION Was.docxUNITED STATES SECURITIES AND EXCHANGE COMMISSION Was.docx
UNITED STATES SECURITIES AND EXCHANGE COMMISSION Was.docxouldparis
 
xcel energy 3_2_07SPS
xcel energy 3_2_07SPSxcel energy 3_2_07SPS
xcel energy 3_2_07SPSfinance26
 
c.h. robinson worldwide10K_2007
c.h. robinson worldwide10K_2007c.h. robinson worldwide10K_2007
c.h. robinson worldwide10K_2007finance31
 
yrc worldwide 2007_AR
yrc worldwide 2007_ARyrc worldwide 2007_AR
yrc worldwide 2007_ARfinance41
 
yrc worldwide 2007_AR
yrc worldwide 2007_ARyrc worldwide 2007_AR
yrc worldwide 2007_ARfinance41
 
celanese _ar_2006
celanese  _ar_2006celanese  _ar_2006
celanese _ar_2006finance44
 
starwood hotels & resorts annual reports 2005
starwood hotels & resorts   annual reports 2005starwood hotels & resorts   annual reports 2005
starwood hotels & resorts annual reports 2005finance47
 
dover 10K_2006
dover 10K_2006dover 10K_2006
dover 10K_2006finance30
 
visteon 2005 Form 10-K
visteon 	2005 Form 10-Kvisteon 	2005 Form 10-K
visteon 2005 Form 10-Kfinance24
 
clearchannel 320
clearchannel  320clearchannel  320
clearchannel 320finance31
 
Realogy8-KFiling11_13_08
Realogy8-KFiling11_13_08Realogy8-KFiling11_13_08
Realogy8-KFiling11_13_08finance35
 
celanese 48011_celanese_cvr_text_156pg
celanese  48011_celanese_cvr_text_156pgcelanese  48011_celanese_cvr_text_156pg
celanese 48011_celanese_cvr_text_156pgfinance44
 

Ähnlich wie slm 200710KBOW49222BOW014_BITS_NFeb292008 (20)

2007_10k
2007_10k2007_10k
2007_10k
 
urs Form 10-K 2007
urs Form 10-K 2007urs Form 10-K 2007
urs Form 10-K 2007
 
urs Form 10-K 2006
urs Form 10-K 2006urs Form 10-K 2006
urs Form 10-K 2006
 
GNW 2005 AR 10K
GNW 2005 AR 10KGNW 2005 AR 10K
GNW 2005 AR 10K
 
GNW 2005 AR 10K
GNW 2005 AR 10KGNW 2005 AR 10K
GNW 2005 AR 10K
 
toll brothers 200710K
toll brothers 200710Ktoll brothers 200710K
toll brothers 200710K
 
Q3 2009 Earning Report of Craftmade International
Q3 2009 Earning Report of Craftmade InternationalQ3 2009 Earning Report of Craftmade International
Q3 2009 Earning Report of Craftmade International
 
UNITED STATES SECURITIES AND EXCHANGE COMMISSION Was.docx
UNITED STATES SECURITIES AND EXCHANGE COMMISSION Was.docxUNITED STATES SECURITIES AND EXCHANGE COMMISSION Was.docx
UNITED STATES SECURITIES AND EXCHANGE COMMISSION Was.docx
 
xcel energy 3_2_07SPS
xcel energy 3_2_07SPSxcel energy 3_2_07SPS
xcel energy 3_2_07SPS
 
c.h. robinson worldwide10K_2007
c.h. robinson worldwide10K_2007c.h. robinson worldwide10K_2007
c.h. robinson worldwide10K_2007
 
yrc worldwide 2007_AR
yrc worldwide 2007_ARyrc worldwide 2007_AR
yrc worldwide 2007_AR
 
yrc worldwide 2007_AR
yrc worldwide 2007_ARyrc worldwide 2007_AR
yrc worldwide 2007_AR
 
celanese _ar_2006
celanese  _ar_2006celanese  _ar_2006
celanese _ar_2006
 
cel_ar_2006
cel_ar_2006cel_ar_2006
cel_ar_2006
 
starwood hotels & resorts annual reports 2005
starwood hotels & resorts   annual reports 2005starwood hotels & resorts   annual reports 2005
starwood hotels & resorts annual reports 2005
 
dover 10K_2006
dover 10K_2006dover 10K_2006
dover 10K_2006
 
visteon 2005 Form 10-K
visteon 	2005 Form 10-Kvisteon 	2005 Form 10-K
visteon 2005 Form 10-K
 
clearchannel 320
clearchannel  320clearchannel  320
clearchannel 320
 
Realogy8-KFiling11_13_08
Realogy8-KFiling11_13_08Realogy8-KFiling11_13_08
Realogy8-KFiling11_13_08
 
celanese 48011_celanese_cvr_text_156pg
celanese  48011_celanese_cvr_text_156pgcelanese  48011_celanese_cvr_text_156pg
celanese 48011_celanese_cvr_text_156pg
 

Mehr von finance42

saic annual reports 2003
saic annual reports 2003saic annual reports 2003
saic annual reports 2003finance42
 
saic annual reports 2004
saic annual reports 2004saic annual reports 2004
saic annual reports 2004finance42
 
saic annual reports 2005
saic annual reports 2005saic annual reports 2005
saic annual reports 2005finance42
 
saic annual reports 2006
saic annual reports 2006saic annual reports 2006
saic annual reports 2006finance42
 
saic annual reports 2007
saic annual reports 2007saic annual reports 2007
saic annual reports 2007finance42
 
saic annual reports 2008
saic annual reports 2008saic annual reports 2008
saic annual reports 2008finance42
 
terex Merrill050808
terex Merrill050808terex Merrill050808
terex Merrill050808finance42
 
terex BofA050808
terex BofA050808terex BofA050808
terex BofA050808finance42
 
terex Merrill050808
terex Merrill050808terex Merrill050808
terex Merrill050808finance42
 
terex BofA050808
terex BofA050808terex BofA050808
terex BofA050808finance42
 
terex Sanford053008
terex Sanford053008terex Sanford053008
terex Sanford053008finance42
 
terex Shareholders0508
terex Shareholders0508terex Shareholders0508
terex Shareholders0508finance42
 
terex Shareholders0508
terex Shareholders0508terex Shareholders0508
terex Shareholders0508finance42
 
terex 08_06_04_JP_Morgan_Conf
terex 08_06_04_JP_Morgan_Confterex 08_06_04_JP_Morgan_Conf
terex 08_06_04_JP_Morgan_Conffinance42
 
terex 08_06_04_JP_Morgan_Conf
terex 08_06_04_JP_Morgan_Confterex 08_06_04_JP_Morgan_Conf
terex 08_06_04_JP_Morgan_Conffinance42
 
terex KeyBanc060508
terex KeyBanc060508terex KeyBanc060508
terex KeyBanc060508finance42
 
terex KeyBanc060508
terex KeyBanc060508terex KeyBanc060508
terex KeyBanc060508finance42
 
terex Wachovia062508
terex Wachovia062508terex Wachovia062508
terex Wachovia062508finance42
 
terex Wachovia062508
terex Wachovia062508terex Wachovia062508
terex Wachovia062508finance42
 
terex Citi072508
terex Citi072508terex Citi072508
terex Citi072508finance42
 

Mehr von finance42 (20)

saic annual reports 2003
saic annual reports 2003saic annual reports 2003
saic annual reports 2003
 
saic annual reports 2004
saic annual reports 2004saic annual reports 2004
saic annual reports 2004
 
saic annual reports 2005
saic annual reports 2005saic annual reports 2005
saic annual reports 2005
 
saic annual reports 2006
saic annual reports 2006saic annual reports 2006
saic annual reports 2006
 
saic annual reports 2007
saic annual reports 2007saic annual reports 2007
saic annual reports 2007
 
saic annual reports 2008
saic annual reports 2008saic annual reports 2008
saic annual reports 2008
 
terex Merrill050808
terex Merrill050808terex Merrill050808
terex Merrill050808
 
terex BofA050808
terex BofA050808terex BofA050808
terex BofA050808
 
terex Merrill050808
terex Merrill050808terex Merrill050808
terex Merrill050808
 
terex BofA050808
terex BofA050808terex BofA050808
terex BofA050808
 
terex Sanford053008
terex Sanford053008terex Sanford053008
terex Sanford053008
 
terex Shareholders0508
terex Shareholders0508terex Shareholders0508
terex Shareholders0508
 
terex Shareholders0508
terex Shareholders0508terex Shareholders0508
terex Shareholders0508
 
terex 08_06_04_JP_Morgan_Conf
terex 08_06_04_JP_Morgan_Confterex 08_06_04_JP_Morgan_Conf
terex 08_06_04_JP_Morgan_Conf
 
terex 08_06_04_JP_Morgan_Conf
terex 08_06_04_JP_Morgan_Confterex 08_06_04_JP_Morgan_Conf
terex 08_06_04_JP_Morgan_Conf
 
terex KeyBanc060508
terex KeyBanc060508terex KeyBanc060508
terex KeyBanc060508
 
terex KeyBanc060508
terex KeyBanc060508terex KeyBanc060508
terex KeyBanc060508
 
terex Wachovia062508
terex Wachovia062508terex Wachovia062508
terex Wachovia062508
 
terex Wachovia062508
terex Wachovia062508terex Wachovia062508
terex Wachovia062508
 
terex Citi072508
terex Citi072508terex Citi072508
terex Citi072508
 

Kürzlich hochgeladen

Dharavi Russian callg Girls, { 09892124323 } || Call Girl In Mumbai ...
Dharavi Russian callg Girls, { 09892124323 } || Call Girl In Mumbai ...Dharavi Russian callg Girls, { 09892124323 } || Call Girl In Mumbai ...
Dharavi Russian callg Girls, { 09892124323 } || Call Girl In Mumbai ...Pooja Nehwal
 
20240417-Calibre-April-2024-Investor-Presentation.pdf
20240417-Calibre-April-2024-Investor-Presentation.pdf20240417-Calibre-April-2024-Investor-Presentation.pdf
20240417-Calibre-April-2024-Investor-Presentation.pdfAdnet Communications
 
Call Girls Service Nagpur Maya Call 7001035870 Meet With Nagpur Escorts
Call Girls Service Nagpur Maya Call 7001035870 Meet With Nagpur EscortsCall Girls Service Nagpur Maya Call 7001035870 Meet With Nagpur Escorts
Call Girls Service Nagpur Maya Call 7001035870 Meet With Nagpur Escortsranjana rawat
 
The Economic History of the U.S. Lecture 30.pdf
The Economic History of the U.S. Lecture 30.pdfThe Economic History of the U.S. Lecture 30.pdf
The Economic History of the U.S. Lecture 30.pdfGale Pooley
 
The Economic History of the U.S. Lecture 18.pdf
The Economic History of the U.S. Lecture 18.pdfThe Economic History of the U.S. Lecture 18.pdf
The Economic History of the U.S. Lecture 18.pdfGale Pooley
 
Malad Call Girl in Services 9892124323 | ₹,4500 With Room Free Delivery
Malad Call Girl in Services  9892124323 | ₹,4500 With Room Free DeliveryMalad Call Girl in Services  9892124323 | ₹,4500 With Room Free Delivery
Malad Call Girl in Services 9892124323 | ₹,4500 With Room Free DeliveryPooja Nehwal
 
00_Main ppt_MeetupDORA&CyberSecurity.pptx
00_Main ppt_MeetupDORA&CyberSecurity.pptx00_Main ppt_MeetupDORA&CyberSecurity.pptx
00_Main ppt_MeetupDORA&CyberSecurity.pptxFinTech Belgium
 
Dividend Policy and Dividend Decision Theories.pptx
Dividend Policy and Dividend Decision Theories.pptxDividend Policy and Dividend Decision Theories.pptx
Dividend Policy and Dividend Decision Theories.pptxanshikagoel52
 
The Economic History of the U.S. Lecture 20.pdf
The Economic History of the U.S. Lecture 20.pdfThe Economic History of the U.S. Lecture 20.pdf
The Economic History of the U.S. Lecture 20.pdfGale Pooley
 
TEST BANK For Corporate Finance, 13th Edition By Stephen Ross, Randolph Weste...
TEST BANK For Corporate Finance, 13th Edition By Stephen Ross, Randolph Weste...TEST BANK For Corporate Finance, 13th Edition By Stephen Ross, Randolph Weste...
TEST BANK For Corporate Finance, 13th Edition By Stephen Ross, Randolph Weste...ssifa0344
 
High Class Call Girls Nashik Maya 7001305949 Independent Escort Service Nashik
High Class Call Girls Nashik Maya 7001305949 Independent Escort Service NashikHigh Class Call Girls Nashik Maya 7001305949 Independent Escort Service Nashik
High Class Call Girls Nashik Maya 7001305949 Independent Escort Service NashikCall Girls in Nagpur High Profile
 
Interimreport1 January–31 March2024 Elo Mutual Pension Insurance Company
Interimreport1 January–31 March2024 Elo Mutual Pension Insurance CompanyInterimreport1 January–31 March2024 Elo Mutual Pension Insurance Company
Interimreport1 January–31 March2024 Elo Mutual Pension Insurance CompanyTyöeläkeyhtiö Elo
 
Quarter 4- Module 3 Principles of Marketing
Quarter 4- Module 3 Principles of MarketingQuarter 4- Module 3 Principles of Marketing
Quarter 4- Module 3 Principles of MarketingMaristelaRamos12
 
OAT_RI_Ep19 WeighingTheRisks_Apr24_TheYellowMetal.pptx
OAT_RI_Ep19 WeighingTheRisks_Apr24_TheYellowMetal.pptxOAT_RI_Ep19 WeighingTheRisks_Apr24_TheYellowMetal.pptx
OAT_RI_Ep19 WeighingTheRisks_Apr24_TheYellowMetal.pptxhiddenlevers
 
06_Joeri Van Speybroek_Dell_MeetupDora&Cybersecurity.pdf
06_Joeri Van Speybroek_Dell_MeetupDora&Cybersecurity.pdf06_Joeri Van Speybroek_Dell_MeetupDora&Cybersecurity.pdf
06_Joeri Van Speybroek_Dell_MeetupDora&Cybersecurity.pdfFinTech Belgium
 
VIP Kolkata Call Girl Serampore 👉 8250192130 Available With Room
VIP Kolkata Call Girl Serampore 👉 8250192130  Available With RoomVIP Kolkata Call Girl Serampore 👉 8250192130  Available With Room
VIP Kolkata Call Girl Serampore 👉 8250192130 Available With Roomdivyansh0kumar0
 
02_Fabio Colombo_Accenture_MeetupDora&Cybersecurity.pptx
02_Fabio Colombo_Accenture_MeetupDora&Cybersecurity.pptx02_Fabio Colombo_Accenture_MeetupDora&Cybersecurity.pptx
02_Fabio Colombo_Accenture_MeetupDora&Cybersecurity.pptxFinTech Belgium
 
Solution Manual for Principles of Corporate Finance 14th Edition by Richard B...
Solution Manual for Principles of Corporate Finance 14th Edition by Richard B...Solution Manual for Principles of Corporate Finance 14th Edition by Richard B...
Solution Manual for Principles of Corporate Finance 14th Edition by Richard B...ssifa0344
 
Russian Call Girls In Gtb Nagar (Delhi) 9711199012 💋✔💕😘 Naughty Call Girls Se...
Russian Call Girls In Gtb Nagar (Delhi) 9711199012 💋✔💕😘 Naughty Call Girls Se...Russian Call Girls In Gtb Nagar (Delhi) 9711199012 💋✔💕😘 Naughty Call Girls Se...
Russian Call Girls In Gtb Nagar (Delhi) 9711199012 💋✔💕😘 Naughty Call Girls Se...shivangimorya083
 

Kürzlich hochgeladen (20)

Dharavi Russian callg Girls, { 09892124323 } || Call Girl In Mumbai ...
Dharavi Russian callg Girls, { 09892124323 } || Call Girl In Mumbai ...Dharavi Russian callg Girls, { 09892124323 } || Call Girl In Mumbai ...
Dharavi Russian callg Girls, { 09892124323 } || Call Girl In Mumbai ...
 
Veritas Interim Report 1 January–31 March 2024
Veritas Interim Report 1 January–31 March 2024Veritas Interim Report 1 January–31 March 2024
Veritas Interim Report 1 January–31 March 2024
 
20240417-Calibre-April-2024-Investor-Presentation.pdf
20240417-Calibre-April-2024-Investor-Presentation.pdf20240417-Calibre-April-2024-Investor-Presentation.pdf
20240417-Calibre-April-2024-Investor-Presentation.pdf
 
Call Girls Service Nagpur Maya Call 7001035870 Meet With Nagpur Escorts
Call Girls Service Nagpur Maya Call 7001035870 Meet With Nagpur EscortsCall Girls Service Nagpur Maya Call 7001035870 Meet With Nagpur Escorts
Call Girls Service Nagpur Maya Call 7001035870 Meet With Nagpur Escorts
 
The Economic History of the U.S. Lecture 30.pdf
The Economic History of the U.S. Lecture 30.pdfThe Economic History of the U.S. Lecture 30.pdf
The Economic History of the U.S. Lecture 30.pdf
 
The Economic History of the U.S. Lecture 18.pdf
The Economic History of the U.S. Lecture 18.pdfThe Economic History of the U.S. Lecture 18.pdf
The Economic History of the U.S. Lecture 18.pdf
 
Malad Call Girl in Services 9892124323 | ₹,4500 With Room Free Delivery
Malad Call Girl in Services  9892124323 | ₹,4500 With Room Free DeliveryMalad Call Girl in Services  9892124323 | ₹,4500 With Room Free Delivery
Malad Call Girl in Services 9892124323 | ₹,4500 With Room Free Delivery
 
00_Main ppt_MeetupDORA&CyberSecurity.pptx
00_Main ppt_MeetupDORA&CyberSecurity.pptx00_Main ppt_MeetupDORA&CyberSecurity.pptx
00_Main ppt_MeetupDORA&CyberSecurity.pptx
 
Dividend Policy and Dividend Decision Theories.pptx
Dividend Policy and Dividend Decision Theories.pptxDividend Policy and Dividend Decision Theories.pptx
Dividend Policy and Dividend Decision Theories.pptx
 
The Economic History of the U.S. Lecture 20.pdf
The Economic History of the U.S. Lecture 20.pdfThe Economic History of the U.S. Lecture 20.pdf
The Economic History of the U.S. Lecture 20.pdf
 
TEST BANK For Corporate Finance, 13th Edition By Stephen Ross, Randolph Weste...
TEST BANK For Corporate Finance, 13th Edition By Stephen Ross, Randolph Weste...TEST BANK For Corporate Finance, 13th Edition By Stephen Ross, Randolph Weste...
TEST BANK For Corporate Finance, 13th Edition By Stephen Ross, Randolph Weste...
 
High Class Call Girls Nashik Maya 7001305949 Independent Escort Service Nashik
High Class Call Girls Nashik Maya 7001305949 Independent Escort Service NashikHigh Class Call Girls Nashik Maya 7001305949 Independent Escort Service Nashik
High Class Call Girls Nashik Maya 7001305949 Independent Escort Service Nashik
 
Interimreport1 January–31 March2024 Elo Mutual Pension Insurance Company
Interimreport1 January–31 March2024 Elo Mutual Pension Insurance CompanyInterimreport1 January–31 March2024 Elo Mutual Pension Insurance Company
Interimreport1 January–31 March2024 Elo Mutual Pension Insurance Company
 
Quarter 4- Module 3 Principles of Marketing
Quarter 4- Module 3 Principles of MarketingQuarter 4- Module 3 Principles of Marketing
Quarter 4- Module 3 Principles of Marketing
 
OAT_RI_Ep19 WeighingTheRisks_Apr24_TheYellowMetal.pptx
OAT_RI_Ep19 WeighingTheRisks_Apr24_TheYellowMetal.pptxOAT_RI_Ep19 WeighingTheRisks_Apr24_TheYellowMetal.pptx
OAT_RI_Ep19 WeighingTheRisks_Apr24_TheYellowMetal.pptx
 
06_Joeri Van Speybroek_Dell_MeetupDora&Cybersecurity.pdf
06_Joeri Van Speybroek_Dell_MeetupDora&Cybersecurity.pdf06_Joeri Van Speybroek_Dell_MeetupDora&Cybersecurity.pdf
06_Joeri Van Speybroek_Dell_MeetupDora&Cybersecurity.pdf
 
VIP Kolkata Call Girl Serampore 👉 8250192130 Available With Room
VIP Kolkata Call Girl Serampore 👉 8250192130  Available With RoomVIP Kolkata Call Girl Serampore 👉 8250192130  Available With Room
VIP Kolkata Call Girl Serampore 👉 8250192130 Available With Room
 
02_Fabio Colombo_Accenture_MeetupDora&Cybersecurity.pptx
02_Fabio Colombo_Accenture_MeetupDora&Cybersecurity.pptx02_Fabio Colombo_Accenture_MeetupDora&Cybersecurity.pptx
02_Fabio Colombo_Accenture_MeetupDora&Cybersecurity.pptx
 
Solution Manual for Principles of Corporate Finance 14th Edition by Richard B...
Solution Manual for Principles of Corporate Finance 14th Edition by Richard B...Solution Manual for Principles of Corporate Finance 14th Edition by Richard B...
Solution Manual for Principles of Corporate Finance 14th Edition by Richard B...
 
Russian Call Girls In Gtb Nagar (Delhi) 9711199012 💋✔💕😘 Naughty Call Girls Se...
Russian Call Girls In Gtb Nagar (Delhi) 9711199012 💋✔💕😘 Naughty Call Girls Se...Russian Call Girls In Gtb Nagar (Delhi) 9711199012 💋✔💕😘 Naughty Call Girls Se...
Russian Call Girls In Gtb Nagar (Delhi) 9711199012 💋✔💕😘 Naughty Call Girls Se...
 

slm 200710KBOW49222BOW014_BITS_NFeb292008

  • 1. UNITED STATES SECURITIES AND EXCHANGE COMMISSION Washington, D.C. 20549 Form 10-K (Mark One) ¥ ANNUAL REPORT PURSUANT TO SECTION 13 OR 15(d) OF THE SECURITIES EXCHANGE ACT OF 1934 For the fiscal year ended December 31, 2007 or n TRANSITION REPORT PURSUANT TO SECTION 13 or 15(d) OF THE SECURITIES EXCHANGE ACT OF 1934 For the transition period from to Commission file numbers 001-13251 SLM Corporation (Exact Name of Registrant as Specified in Its Charter) Delaware 52-2013874 (State of Other Jurisdiction of (I.R.S. Employer Incorporation or Organization) Identification No.) 12061 Bluemont Way, Reston, Virginia 20190 (Zip Code) (Address of Principal Executive Offices) (703) 810-3000 (Registrant’s Telephone Number, Including Area Code) Securities registered pursuant to Section 12(b) of the Act Common Stock, par value $.20 per share. Name of Exchange on which Listed: New York Stock Exchange 6.97% Cumulative Redeemable Preferred Stock, Series A, par value $.20 per share Floating Rate Non-Cumulative Preferred Stock, Series B, par value $.20 per share Name of Exchange on which Listed: New York Stock Exchange Medium Term Notes, Series A, CPI-Linked Notes due 2017 Medium Term Notes, Series A, CPI-Linked Notes due 2018 6% Senior Notes due December 15, 2043 Name of Exchange on which Listed: New York Stock Exchange Securities registered pursuant to Section 12(g) of the Act: None. Indicate by check mark whether the registrant is a well-known seasoned issuer, as defined in Rule 405 of the Securities Yes ¥ No n Act. Indicate by check mark if the registrant is not required to file reports pursuant to Section 13 or 15(d) of the Act. Yes n No ¥ Indicate by check mark whether the registrant: (1) has filed all reports required to be filed by Section 13 or 15(d) of the Securities Exchange Act of 1934 during the preceding 12 months (or for such shorter period that the registrant was required to file such reports), and (2) has been subject to such filing requirements for the past 90 days. Yes ¥ No n Indicate by check mark if disclosure of delinquent filers pursuant to Item 405 of Regulation S-K is not contained herein, and will not be contained, to the best of registrant’s knowledge, in definitive proxy or information statements incorporated by reference in Part III of this Form 10-K or any amendment to this Form 10-K. ¥ Indicate by check mark whether the registrant is a large accelerated filer, an accelerated filer, a non-accelerated filer, or a smaller reporting company. See definitions of “large accelerated filer,” “accelerated filer” and “smaller reporting company” in Rule 12b-2 of the Exchange Act. (Check one): Large accelerated filer ¥ Accelerated filer n Non-accelerated filer n Smaller reporting company n (Do not check if a smaller reporting company) Indicate by check mark whether the registrant is a shell company (as defined in Rule 12b-2 of the Exchange Act). Yes n No ¥ The aggregate market value of voting stock held by non-affiliates of the registrant as of June 30, 2007 was $23.6 billion (based on closing sale price of $57.58 per share as reported for the New York Stock Exchange — Composite Transactions). As of January 31, 2008, there were 466,570,624 shares of voting common stock outstanding. DOCUMENTS INCORPORATED BY REFERENCE Portions of the Proxy Statement relating to the registrant’s Annual Meeting of Shareholders scheduled to be held May 8, 2008 are incorporated by reference into Part III of this Report.
  • 2. FORWARD-LOOKING AND CAUTIONARY STATEMENTS This report contains forward-looking statements and information that are based on management’s current expectations as of the date of this document. Statements that are not historical facts, including statements about our beliefs or expectations and statements that assume or are dependent upon future events are forward- looking statements, and are contained throughout this Annual Report on Form 10-K, including under the sections entitled “Business” and “Management’s Discussion and Analysis of Financial Condition and Results of Operations.” These forward-looking statements are subject to risks, uncertainties, assumptions and other factors that may cause the actual results to be materially different from those reflected in such forward-looking statements. These factors include, among others, the occurrence of any event, change or other circumstances that could give rise to our ability to cost-effectively refinance the aggregate interim $30 billion asset-backed commercial paper conduit facilities (collectively, the “Interim ABCP Facility”) extended to SLM Corporation, more commonly known as Sallie Mae, and its subsidiaries (collectively, “the Company”) by Bank of America, N.A. and JPMorgan Chase, N.A. in connection with the Merger Agreement (defined in the Glossary below), including any potential foreclosure on the student loans under those facilities following their termination, increased financing costs and more limited liquidity; any adverse outcomes in any significant litigation to which we are a party; our derivative counterparties may terminate their positions with the Company if its credit ratings fall to certain levels and the Company could incur substantial additional costs to replace any terminated positions; changes in the terms of student loans and the educational credit marketplace arising from the implementation of applicable laws and regulations and from changes in these laws and regulations, which, among other things, may reduce the volume, average term and yields on student loans under the Federal Family Education Loan Program (“FFELP”) or result in loans being originated or refinanced under non-FFELP programs or may affect the terms upon which banks and others agree to sell FFELP loans to the Company. In addition, a larger than expected increase in third-party consolidations of our FFELP loans could materially adversely affect our results of operations. The Company could also be affected by changes in the demand for educational financing or in financing preferences of lenders, educational institutions, students and their families; incorrect estimates or assumptions by management in connection with the preparation of our consolidated financial statements; changes in the composition of our Managed FFELP and Private Education Loan portfolios; changes in the general interest rate environment and in the securitization markets for education loans, which may increase the costs or limit the availability of financings necessary to initiate, purchase or carry education loans; changes in projections of losses from loan defaults; changes in general economic conditions; changes in prepayment rates and credit spreads; and changes in the demand for debt management services and new laws or changes in existing laws that govern debt management services. All forward-looking statements contained in this report are qualified by these cautionary statements and are made only as of the date this Annual Report on Form 10-K is filed. The Company does not undertake any obligation to update or revise these forward-looking statements to conform the statement to actual results or changes in the Company’s expectations. 1
  • 3. GLOSSARY Listed below are definitions of key terms that are used throughout this document. See also APPENDIX A, “FEDERAL FAMILY EDUCATION LOAN PROGRAM,” for a further discussion of the FFELP and The College Cost Reduction and Access Act of 2007. CCRAA — The College Cost Reduction and Access Act of 2007. Consolidation Loan Rebate Fee — All holders of FFELP Consolidation Loans are required to pay to the U.S. Department of Education (“ED”) an annual 105 basis point Consolidation Loan Rebate Fee on all outstanding principal and accrued interest balances of FFELP Consolidation Loans purchased or originated after October 1, 1993, except for loans for which consolidation applications were received between October 1, 1998 and January 31, 1999, where the Consolidation Loan Rebate Fee is 62 basis points. Constant Prepayment Rate (“CPR”) — A variable in life of loan estimates that measures the rate at which loans in the portfolio pay before their stated maturity. The CPR is directly correlated to the average life of the portfolio. CPR equals the percentage of loans that prepay annually as a percentage of the beginning of period balance. “Core Earnings” — In accordance with the Rules and Regulations of the Securities and Exchange Commission (“SEC”), we prepare financial statements in accordance with generally accepted accounting principles in the United States of America (“GAAP”). In addition to evaluating the Company’s GAAP-based financial information, management evaluates the Company’s business segments on a basis that, as allowed under the Financial Accounting Standards Board’s (“FASB”) Statement of Financial Accounting Standards (“SFAS”) No. 131, “Disclosures about Segments of an Enterprise and Related Information,” differs from GAAP. We refer to management’s basis of evaluating our segment results as “Core Earnings” presentations for each business segment and we refer to these performance measures in our presentations with credit rating agencies and lenders. While “Core Earnings” results are not a substitute for reported results under GAAP, we rely on “Core Earnings” performance measures in operating each business segment because we believe these measures provide additional information regarding the operational and performance indicators that are most closely assessed by management. Our “Core Earnings” performance measures are the primary financial performance measures used by management to evaluate performance and to allocate resources. Accordingly, financial information is reported to management on a “Core Earnings” basis by reportable segment, as these are the measures used regularly by our chief operating decision makers. Our “Core Earnings” performance measures are used in developing our financial plans and tracking results, and also in establishing corporate performance targets and determining incentive compensation. Management believes this information provides additional insight into the financial performance of the Company’s core business activities. Our “Core Earnings” performance measures are not defined terms within GAAP and may not be comparable to similarly titled measures reported by other companies. “Core Earnings” net income reflects only current period adjustments to GAAP net income. Accordingly, the Company’s “Core Earnings” presentation does not represent another comprehensive basis of accounting. See Note 20 to the consolidated financial statements,“Segment Reporting,” and “MANAGEMENT’S DISCUSSION AND ANALYSIS OF FINANCIAL CONDITION AND RESULTS OF OPERATIONS — BUSINESS SEGMENTS — Limitations of ‘Core Earnings’” for further discussion of the differences between “Core Earnings” and GAAP, as well as reconciliations between “Core Earnings” and GAAP. In prior filings with the SEC of SLM Corporation’s Annual Report on Form 10-K and quarterly report on Form 10-Q, “Core Earnings” has been labeled as “‘Core’ net income” or “Managed net income” in certain instances. Direct Loans — Student loans originated directly by ED under the FDLP. ED — The U.S. Department of Education. 2
  • 4. Embedded Fixed Rate/Variable Rate Floor Income — Embedded Floor Income is Floor Income (see definition below) that is earned on off-balance sheet student loans that are in securitization trusts sponsored by us. At the time of the securitization, the value of Embedded Fixed Rate Floor Income is included in the initial valuation of the Residual Interest (see definition below) and the gain or loss on sale of the student loans. Embedded Floor Income is also included in the quarterly fair value adjustments of the Residual Interest. Exceptional Performer (“EP”) Designation — The EP designation is determined by ED in recognition of a servicer meeting certain performance standards set by ED in servicing FFELP Loans. Upon receiving the EP designation, the EP servicer receives reimbursement on default claims higher than the legislated Risk Sharing (see definition below) levels on federally guaranteed student loans for all loans serviced for a period of at least 270 days before the date of default. The EP servicer is entitled to receive this benefit as long as it remains in compliance with the required servicing standards, which are assessed on an annual and quarterly basis through compliance audits and other criteria. The annual assessment is in part based upon subjective factors which alone may form the basis for an ED determination to withdraw the designation. If the designation is withdrawn, Risk Sharing may be applied retroactively to the date of the occurrence that resulted in noncompliance. The College Cost Reduction Act of 2007 eliminated the EP designation effective October 1, 2007. See also Appendix A, “FEDERAL FAMILY EDUCATION LOAN PROGRAM.” FDLP — The William D. Ford Federal Direct Student Loan Program. FFELP — The Federal Family Education Loan Program, formerly the Guaranteed Student Loan Program. FFELP Consolidation Loans — Under the Federal Family Education Loan Program (“FFELP”), borrow- ers with multiple eligible student loans may consolidate them into a single student loan with one lender at a fixed rate for the life of the loan. The new note is considered a FFELP Consolidation Loan. Typically a borrower may consolidate his student loans only once unless the borrower has another eligible loan to consolidate with the existing FFELP Consolidation Loan. The borrower rate on a FFELP Consolidation Loan is fixed for the term of the loan and is set by the weighted average interest rate of the loans being consolidated, rounded up to the nearest 1/8th of a percent, not to exceed 8.25 percent. In low interest rate environments, FFELP Consolidation Loans provide an attractive refinancing opportunity to certain borrowers because they allow borrowers to consolidate variable rate loans into a long-term fixed rate loan. Holders of FFELP Consolidation Loans are eligible to earn interest under the Special Allowance Payment (“SAP”) formula (see definition below). FFELP Stafford and Other Student Loans — Education loans to students or parents of students that are guaranteed or reinsured under the FFELP. The loans are primarily Stafford loans but also include PLUS and HEAL loans. Fixed Rate Floor Income — We refer to Floor Income (see definition below) associated with student loans whose borrower rate is fixed to term (primarily FFELP Consolidation Loans and Stafford Loans originated on or after July 1, 2006) as Fixed Rate Floor Income. Floor Income — FFELP student loans generally earn interest at the higher of a floating rate based on the Special Allowance Payment or SAP formula (see definition below) set by ED and the borrower rate, which is fixed over a period of time. We generally finance our student loan portfolio with floating rate debt over all interest rate levels. In low and/or declining interest rate environments, when the fixed borrower rate is higher than the rate produced by the SAP formula, our student loans earn at a fixed rate while the interest on our floating rate debt continues to decline. In these interest rate environments, we earn additional spread income that we refer to as Floor Income. Depending on the type of the student loan and when it was originated, the borrower rate is either fixed to term or is reset to a market rate each July 1. As a result, for loans where the borrower rate is fixed to term, we may earn Floor Income for an extended period of time, and for those loans where the borrower interest rate is reset annually on July 1, we may earn Floor Income to the next reset date. 3
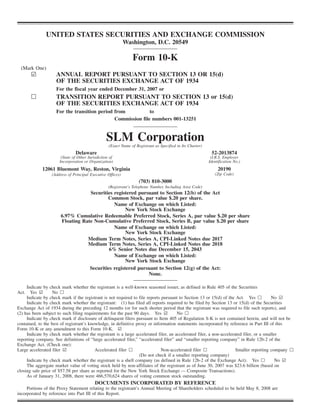
  • 5. In accordance with new legislation enacted in 2006, lenders are required to rebate Floor Income to ED for all new FFELP loans disbursed on or after April 1, 2006. The following example shows the mechanics of Floor Income for a typical fixed rate FFELP Consolida- tion Loan (with a commercial paper-based SAP spread of 2.64 percent): Fixed Borrower Rate . . . . . . . . . . . . . . . . . . . . . . . . . . . . . . . . . . . . . . . . . . . . . . . . . . . . . . 7.25% SAP Spread over Commercial Paper Rate . . . . . . . . . . . . . . . . . . . . . . . . . . . . . . . . . . . . . . . (2.64)% Floor Strike Rate(1) . . . . . . . . . . . . . . . . . . . . . . . . . . . . . . . . . . . . . . . . . . . . . . . . . . . . . . . . 4.61% (1) The interest rate at which the underlying index (Treasury bill or commercial paper) plus the fixed SAP spread equals the fixed borrower rate. Floor Income is earned anytime the interest rate of the underlying index declines below this rate. Based on this example, if the quarterly average commercial paper rate is over 4.61 percent, the holder of the student loan will earn at a floating rate based on the SAP formula, which in this example is a fixed spread to commercial paper of 2.64 percent. On the other hand, if the quarterly average commercial paper rate is below 4.61 percent, the SAP formula will produce a rate below the fixed borrower rate of 7.25 percent and the loan holder earns at the borrower rate of 7.25 percent. The difference between the fixed borrower rate and the lender’s expected yield based on the SAP formula is referred to as Floor Income. Our student loan assets are generally funded with floating rate debt, so when student loans are earning at the fixed borrower rate, decreases in interest rates may increase Floor Income. Graphic Depiction of Floor Income: 10.00% Fixed Borrower Rate = 7.25% Special Allowance Payment (SAP) Rate = 2.64% 9.00% 8.00% Lender Yield Yield Fixed Borrower Rate 7.00% 6.00% Floor Income Floating Debt Rate 5.00% Floor Strike Rate @ 4.61% 4.00% 4.00% 5.00% 6.00% 7.00% Commercial Paper Rate Floor Income Contracts — We enter into contracts with counterparties under which, in exchange for an upfront fee representing the present value of the Floor Income that we expect to earn on a notional amount of underlying student loans being economically hedged, we will pay the counterparties the Floor Income earned on that notional amount over the life of the Floor Income Contract. Specifically, we agree to pay the counterparty the difference, if positive, between the fixed borrower rate less the SAP (see definition below) spread and the average of the applicable interest rate index on that notional amount, regardless of the actual balance of underlying student loans, over the life of the contract. The contracts generally do not extend over the life of the underlying student loans. This contract effectively locks in the amount of Floor Income we will earn over the period of the contract. Floor Income Contracts are not considered effective hedges under SFAS No. 133, “Accounting for Derivative Instruments and Hedging Activities,” and each quarter we must record the change in fair value of these contracts through income. 4
  • 6. Front-End Borrower Benefits — Financial incentives offered to borrowers at origination. Front-End Borrower Benefits primarily represent our payment on behalf of borrowers for required FFELP fees, including the federal origination fee and federal default fee. We account for these Front-End Borrower Benefits as loan premiums amortized over the estimated life of the loans as an adjustment to the loan’s yield. Gross Floor Income — Floor Income earned before payments on Floor Income Contracts. GSE — The Student Loan Marketing Association was a federally chartered government-sponsored enterprise and wholly owned subsidiary of SLM Corporation that was dissolved under the terms of the Privatization Act (see definition below) on December 29, 2004. Guarantors — State agencies or non-profit companies that guarantee (or insure) FFELP student loans made by eligible lenders under the HEA. HEA — The Higher Education Act of 1965, as amended. Interim ABCP Facility — An aggregate of $30 billion asset-backed commercial paper conduit facilities that we entered into on April 30, 2007 in connection with the Merger (defined below under “Merger Agreement”). Lender Partners — Lender Partners are lenders who originate loans under forward purchase commit- ments to Sallie Mae where we own the loans from inception or, in most cases, acquire the loans soon after origination. Managed Basis — We generally analyze the performance of our student loan portfolio on a Managed Basis, under which we view both on-balance sheet student loans and off-balance sheet student loans owned by the securitization trusts as a single portfolio, and the related on-balance sheet financings are combined with off- balance sheet debt. When the term Managed is capitalized in this document, it is referring to Managed Basis. Merger Agreement — On April 16, 2007, the Company announced that a buyer group (“Buyer Group”) led by J.C. Flowers & Co. (“J.C. Flowers”), Bank of America, N.A. and JPMorgan Chase, N.A. (the “Merger”) signed a definitive agreement (“Merger Agreement”) to acquire the Company for approximately $25.3 billion or $60.00 per share of common stock. (See also “Merger Agreement” filed with the SEC on the Company’s Current Report on Form 8-K, dated April 18, 2007.) On January 25, 2008, the Company, Mustang Holding Company Inc. (“Mustang Holding”), Mustang Merger Sub, Inc. (“Mustang Sub”), J.C. Flowers, Bank of America, N.A. and JPMorgan Chase Bank, N.A. entered into a Settlement, Termination and Release Agreement (the “Agreement”). Under the Agreement, a lawsuit filed by the Company related to the Merger, as well as all counterclaims, was dismissed. Preferred Lender List — Most higher education institutions select a small number of lenders to recommend to their students and parents. This recommended list is referred to as the Preferred Lender List. Preferred Channel Originations — Preferred Channel Originations are comprised of: 1) loans that are originated by internally marketed Sallie Mae brands, and 2) student loans that are originated by lenders with forward purchase commitment agreements with Sallie Mae and are committed for sale to Sallie Mae, such that we either own them from inception or, in most cases, acquire them soon after origination. Private Education Consolidation Loans — Borrowers with multiple Private Education Loans (defined below) may consolidate them into a single loan with Sallie Mae (Private Consolidation Loans@). The interest rate on the new loan is variable rate with the spread set at the lower of the average weighted spread of the underlying loans (available only to Sallie Mae customers) or a new spread as a result of favorable underwriting criteria. 5
  • 7. Private Education Loans — Education loans to students or parents of students that are not guaranteed or reinsured under the FFELP or any other federal or private student loan program. Private Education Loans include loans for higher education (undergraduate and graduate degrees) and for alternative education, such as career training, private kindergarten through secondary education schools and tutorial schools. Higher education loans have repayment terms similar to FFELP loans, whereby repayments begin after the borrower leaves school. Our higher education Private Education Loans to students attending Title IV Schools are not dischargeable in bankruptcy, except in certain limited circumstances. Repayment for alternative education generally begins immediately. In the context of our Private Education Loan business, we use the term “non-traditional loans” to describe education loans made to certain borrowers that have or are expected to have a high default rate as a result of a number of factors, including having a lower tier credit rating, low program completion and graduation rates or, where the borrower is expected to graduate, a low expected income relative to the borrower’s cost of attendance. Privatization Act — The Student Loan Marketing Association Reorganization Act of 1996. Reconciliation Legislation — The Higher Education Reconciliation Act of 2005, which reauthorized the student loan programs of the HEA and generally became effective as of July 1, 2006. Repayment Borrower Benefits — Financial incentives offered to borrowers based on pre-determined qualifying factors, which are generally tied directly to making on-time monthly payments. The impact of Repayment Borrower Benefits is dependent on the estimate of the number of borrowers who will eventually qualify for these benefits and the amount of the financial benefit offered to the borrower. We occasionally change Repayment Borrower Benefits programs in both amount and qualification factors. These programmatic changes must be reflected in the estimate of the Repayment Borrower Benefits discount when made. Residual Interest — When we securitize student loans, we retain the right to receive cash flows from the student loans sold to trusts we sponsor in excess of amounts needed to pay servicing, derivative costs (if any), other fees, and the principal and interest on the bonds backed by the student loans. The Residual Interest, which may also include reserve and other cash accounts, is the present value of these future expected cash flows, which includes the present value of Embedded Fixed Rate Floor Income described above. We value the Residual Interest at the time of sale of the student loans to the trust and at the end of each subsequent quarter. Retained Interest — The Retained Interest includes the Residual Interest (defined above) and servicing rights (as the Company retains the servicing responsibilities). Risk Sharing — When a FFELP loan defaults, the federal government guarantees 97 percent of the principal balance plus accrued interest (98 percent on loans disbursed before July 1, 2006) and the holder of the loan is at risk for the remaining amount not guaranteed as a Risk Sharing loss on the loan. FFELP student loans originated after October 1, 1993 are subject to Risk Sharing on loan default claim payments unless the default results from the borrower’s death, disability or bankruptcy. FFELP loans serviced by a servicer that has EP designation (see definition above) from ED are subject to one-percent Risk Sharing for claims filed on or after July 1, 2006 and before October 1, 2007. Special Allowance Payment (“SAP”) — FFELP student loans originated prior to April 1, 2006 (with the exception of certain PLUS and SLS loans discussed below) generally earn interest at the greater of the borrower rate or a floating rate determined by reference to the average of the applicable floating rates (91-day Treasury bill rate or commercial paper) in a calendar quarter, plus a fixed spread that is dependent upon when the loan was originated and the loan’s repayment status. If the resulting floating rate exceeds the borrower rate, ED pays the difference directly to us. This payment is referred to as the Special Allowance Payment or SAP and the formula used to determine the floating rate is the SAP formula. We refer to the fixed spread to the underlying index as the SAP spread. For loans disbursed after April 1, 2006, FFELP loans effectively only 6
  • 8. earn at the SAP rate, as the excess interest earned when the borrower rate exceeds the SAP rate (Floor Income) must be refunded to ED. Variable rate PLUS Loans and SLS Loans earn SAP only if the variable rate, which is reset annually, exceeds the applicable maximum borrower rate. For PLUS loans disbursed on or after January 1, 2000, this limitation on SAP was repealed effective April 1, 2006. Title IV Programs and Title IV Loans — Student loan programs created under Title IV of the HEA, including the FFELP and the FDLP, and student loans originated under those programs, respectively. Variable Rate Floor Income — For FFELP Stafford student loans whose borrower interest rate resets annually on July 1, we may earn Floor Income or Embedded Floor Income (see definitions above) based on a calculation of the difference between the borrower rate and the then current interest rate. We refer to this as Variable Rate Floor Income because Floor Income is earned only through the next reset date. Wholesale Consolidation Loans — During 2006, we implemented a loan acquisition strategy under which we began purchasing a significant amount of FFELP Consolidation Loans, primarily via the spot market, which augments our in-house FFELP Consolidation Loan origination process. Wholesale Consolida- tion Loans are considered incremental volume to our core acquisition channels, which are focused on the retail marketplace with an emphasis on our brand strategy. 7
  • 9. PART I. Item 1. Business INTRODUCTION TO SLM CORPORATION SLM Corporation, more commonly known as Sallie Mae, is the market leader in education finance. SLM Corporation is a holding company that operates through a number of subsidiaries. (References in this Annual Report to the “Company” refer to SLM Corporation and its subsidiaries). Our primary business is to originate and hold student loans. We provide funding, delivery and servicing support for education loans in the United States through our participation in the Federal Family Education Loan Program (“FFELP”) and through our own non-federally guaranteed Private Education Loan programs. We primarily market our FFELP Stafford loans and Private Education Loans through on-campus financial aid offices. We have also expanded into direct-to-consumer marketing, primarily for Private Education Loans, to reach those students and families that choose not to consult with the financial aid office. We have used both internal growth and strategic acquisitions to attain our leadership position in the education finance marketplace. Our sales force, which delivers our products on campuses across the country, is the largest in the student loan industry. The core of our marketing strategy is to promote our on-campus brands, which generate student loan originations through our Preferred Channel. Loans generated through our Preferred Channel are more profitable than loans acquired through other acquisition channels because we own them earlier in the student loan’s life and generally incur lower costs to acquire such loans. We have built brand leadership through the Sallie Mae name, the brands of our subsidiaries and those of our lender partners. These sales and marketing efforts are supported by the largest and most diversified servicing capabilities in the industry. We have expanded into a number of fee-based businesses, most notably, our Asset Performance Group (“APG”) business (formerly, Debt Management Operations (“DMO”)). We also earn fees for a number of services including student loan and guarantee servicing, 529 college-savings plan administration services, and for providing processing capabilities and information technology to educational institutions. We also operate an affinity marketing program through Upromise, Inc. (“Upromise”). References in this Annual Report to “Upromise” refer to Upromise and its subsidiaries. At December 31, 2007, we had approximately 11,000 employees. CURRENT BUSINESS STRATEGY On September 27, 2007, the College Cost Reduction and Access Act of 2007 (“CCRAA”) was signed into law by the President, resulting in, among other things, a reduction in the yield received by the Company on FFELP loans originated on or after October 1, 2007. In the summer of 2007, the global capital markets began to experience a severe dislocation that has persisted to present. This dislocation, along with a reduction in the Company’s unsecured debt ratings caused by the proposed Merger, resulted in more limited access to the capital markets than the Company has enjoyed in the past and a substantial increase in its cost of newly obtained funding. Our management team is evaluating certain aspects of our business in light of the impact of the CCRAA and the current challenges in the capital markets. The CCRAA has a number of important implications for the profitability of our FFELP loan business, including a reduction in Special Allowance Payments, the elimination of the Exceptional Performer designation and the corresponding reduction in default payments to 97 percent through 2012 and 95 percent thereafter, an increase in the lender paid origination fees for certain loan types and a reduction in default collection retention fees and account maintenance fees related to guaranty agency activities. As a result, we expect that the CCRAA will significantly reduce and, combined with higher financing costs, could possibly eliminate the profitability of new FFELP loan originations, while also increasing our Risk Sharing in connection with our FFELP loan portfolio. 8
  • 10. We plan to curtail less profitable student loan origination and acquisition activities that have less strategic value, including originations of Private Education Loans for high default rate and lower-tier credit borrowers, as well as spot purchases and Wholesale Consolidation Loan purchases, all of which will also reduce our funding needs. We expect to minimize incremental FFELP Consolidation Loan volume as a result of significant margin erosion for FFELP Consolidation Loans created by the combined effect of the CCRAA and elevated funding costs. However, we will continue our efforts to protect select FFELP assets existing in our portfolio. We expect to continue to aggressively pursue other FFELP-related fee income opportunities such as FFELP loan servicing, guarantor servicing and collections. In addition, we plan to reduce and, over time, to no longer offer certain borrower benefits in connection with both our FFELP loans and our Private Education Loans. We expect to continue to focus on generally higher-margin Private Education Loans, originated both through our school channel and our direct-to-consumer channel, with particular attention to upholding our more stringent underwriting standards. In January 2008, we notified some of our school customers whose students have non-traditional loans that we were curtailing certain high default rate lending programs and reviewing the pricing of others. Actual credit performance at these programs was materially below our original expectations. Charge-offs at these non-traditional schools are largely driven by low program completion and graduation rates. The non-traditional portfolio is also particularly impacted by the weakening U.S. economy. We also expect to adjust our Private Education Loan pricing at all schools to reflect the current financing and market conditions. We expect to see lenders exit the student loan industry in response to the CCRAA and current conditions in the credit markets and, as a result, expect to partially offset declining loan volumes caused by our more selective lending policies with increased market share assumed from participants exiting the industry. The impacts of the CCRAA as well as the challenges we are facing in the capital markets are also requiring us to rationalize our business operations and reduce our costs. We are undertaking a thorough review of all of our business units with a goal of achieving appropriate risk-adjusted returns across all of our business segments and providing cost-effective services. As a result, we aim to reduce our operating expenses by up to 20 percent as compared to 2007 operating expenses by year-end 2009, before adjusting for growth and other investments. Since year-end 2007, we have reduced our work force by approximately three percent. BUSINESS SEGMENTS We provide an array of credit products and related services to the higher education and consumer credit communities and others through two primary business segments: our Lending business segment and our APG business segment. These defined business segments operate in distinct business environments and have unique characteristics and face different opportunities and challenges. They are considered reportable segments under the Financial Accounting Standards Board’s (“FASB”) Statement of Financial Accounting Standards (“SFAS”) No. 131, “Disclosures about Segments of an Enterprise and Related Information,” based on quantitative thresholds applied to the Company’s financial statements. In addition, within our Corporate and Other business segment, we provide a number of complementary products and services to guarantors and lender partners that are managed within smaller operating segments, the most prominent being our Guarantor Servicing and Loan Servicing businesses. Our Corporate and Other business segment also includes the activities of our Upromise subsidiary. In accordance with SFAS No. 131, we include in Note 20 to our consolidated financial statements, “Segment Reporting,” separate financial information about our operating segments. Management, including the Company’s chief operating decision makers, evaluates the performance of the Company’s operating segments based on their profitability as measured by “Core Earnings.” Accordingly, we provide information regarding the Company’s reportable segments in this report based on “Core Earnings.” “Core Earnings” are the primary financial performance measures used by management to develop the Company’s financial plans, track results, and establish corporate performance targets and incentive compensa- tion. While “Core Earnings” are not a substitute for reported results under generally accepted accounting principles in the United States (“GAAP”), the Company relies on “Core Earnings” in operating its business because “Core Earnings” permit management to make meaningful period-to-period comparisons of the 9
  • 11. operational and performance indicators that are most closely assessed by management. Management believes this information provides additional insight into the financial performance of the core business activities of our operating segments. (See “MANAGEMENT’S DISCUSSION AND ANALYSIS OF FINANCIAL CONDI- TION AND RESULTS OF OPERATIONS — BUSINESS SEGMENTS” for a detailed discussion of our “Core Earnings,” including a table that summarizes the pre-tax differences between “Core Earnings” and GAAP by business segment and the limitations to this presentation. ) We generate most of our “Core Earnings” earnings in our Lending business from the spread between the yield we receive on our Managed portfolio of student loans and the cost of funding these loans less the provisions for loan losses. We incur servicing, selling and administrative expenses in providing these products and services, and provide for loan losses. On our consolidated statement of income, prepared in accordance with GAAP, this spread income is reported as “net interest income” for on-balance sheet loans, and as “gains on student loan securitizations” and “servicing and securitization revenue” for off-balance sheet loans for which we have a Retained Interest. Total “Core Earnings” revenues for this segment were $1.4 billion in 2007. In our APG business segment, we provide a wide range of accounts receivable and collections services including student loan default aversion services, defaulted student loan portfolio management services, contingency collections services for student loans and other asset classes, and accounts receivable management and collection for purchased portfolios of receivables that are delinquent or have been charged off by their original creditors as well as sub-performing and non-performing mortgage loans. In the purchased receivables business, we focus on a variety of consumer debt types with emphasis on charged-off credit card receivables and distressed mortgage receivables. We purchase these portfolios at a discount to their face value, and then use both our internal collection operations coupled with third-party collection agencies to maximize the recovery on these receivables. LENDING BUSINESS SEGMENT In our Lending business segment, we originate and acquire both federally guaranteed student loans (FFELP loans), which are administered by the U.S. Department of Education (“ED”), and Private Education Loans, which are not federally guaranteed. Borrowers use Private Education Loans primarily to supplement federally guaranteed loans in meeting the cost of education. We manage the largest portfolio of FFELP and Private Education Loans in the student loan industry, serving over 10 million student and parent customers through our ownership and management of $163.6 billion in Managed student loans as of December 31, 2007, of which $135.2 billion or 83 percent are federally insured. We serve a diverse range of clients that includes over 6,000 educational and financial institutions and state agencies. We are the largest servicer of student loans, servicing a portfolio of $127.4 billion of FFELP loans and $32.6 billion of Private Education Loans as of December 31, 2007. We also market student loans, both federal and private, directly to the consumer. In addition to education lending, we originate mortgage and consumer loans. In 2007 we originated $848 million in mortgage and consumer loans. Our mortgage and consumer loan portfolio totaled $545 million at December 31, 2007, of which $19 million are mortgages in the held-for-sale portfolio. 10
  • 12. Student Lending Marketplace The following chart shows estimated sources of funding for attending two-year and four-year colleges for the academic year (“AY”) ending June 30, 2008 (AY 2007-2008). Approximately 36 percent of the funding comes from federally guaranteed student loans and Private Education Loans. Parent/student contributions consist of savings/investments, current period earnings and other loans obtained through the normal financial aid process. Sources of Funding for College Attendance — AY 2007-2008(1) Total Projected Cost — $258 Billion (dollars in billions) Parent/Student Federal Student Contributions $71 Loans $74 $18 $95 Private Education Loans Scholarships, Grants, & Other (1) Source: Based on estimates by Octameron Associates, “Don’t Miss Out,” 32nd Edition; College Board, “2007 Trends in Student Aid”; and Sallie Mae. Includes tuition, room, board, transportation and miscellaneous costs for two and four year college degree-granting programs. Federally Guaranteed Student Lending Programs There are two competing programs that provide student loans where the ultimate credit risk lies with the federal government: the FFELP and the Federal Direct Lending Program (“FDLP”). FFELP loans are provided by private sector institutions and are ultimately guaranteed by ED except for the Risk Sharing loss. FDLP loans are funded by taxpayers and provided to borrowers directly by ED on terms similar to student loans in the FFELP. In addition to these government guaranteed programs, financial institutions also make Private Education Loans, where the lender or holder assumes the credit risk of the borrower. For the federal fiscal year (“FFY”) ended September 30, 2007 (FFY 2007), ED estimated that the FFELP’s market share in federally guaranteed student loans was 80 percent, up from 79 percent in FFY 2006. (See “LENDING BUSINESS SEGMENT — Competition.”) Total FFELP and FDLP volume for FFY 2007 grew by 7 percent, with the FFELP portion growing 8 percent. The Higher Education Act (the “HEA”) includes regulations that cover every aspect of the servicing of a federally guaranteed student loan, including communications with borrowers, loan originations and default aversion. Failure to service a student loan properly could jeopardize the guarantee on federal student loans. This guarantee generally covers 98 and 97 percent (95 percent after 2012) of the student loan’s principal and accrued interest for loans disbursed before and after July 1, 2006, respectively. In the case of death, disability or bankruptcy of the borrower, the guarantee covers 100 percent of the student loan’s principal and accrued interest. 11
  • 13. FFELP student loans are guaranteed by state agencies or non-profit companies called guarantors, with ED providing reinsurance to the guarantor. Guarantors are responsible for performing certain functions necessary to ensure the program’s soundness and accountability. These functions include reviewing loan application data to detect and prevent fraud and abuse and to assist lenders in preventing default by providing counseling to borrowers. Generally, the guarantor is responsible for ensuring that loans are being serviced in compliance with the requirements of the HEA. When a borrower defaults on a FFELP loan, we submit a claim to the guarantor who reimburses us for principal and accrued interest subject to the Risk Sharing (See APPENDIX A, “FEDERAL FAMILY EDUCATION LOAN PROGRAM,” to this document for a more complete description of the role of guarantors.) Private Education Loan Products In addition to federal loan programs, which have statutory limits on annual and total borrowing, we sponsor a variety of Private Education Loan programs and purchase loans made under such programs to bridge the gap between the cost of education and a student’s resources. The majority of our higher education Private Education Loans are made in conjunction with a FFELP Stafford loan, and are marketed to schools through the same marketing channels — and by the same sales force — as FFELP loans. In 2004, we expanded our direct-to-consumer loan marketing channel with our Tuition AnswerSM loan program under which we originate and purchase loans outside of the traditional financial aid process. We also originate and purchase Private Education Loans marketed by our SLM Financial subsidiary to career training, technical and trade schools, tutorial and learning centers, and private kindergarten through secondary education schools. These loans are primarily made at schools not eligible for Title IV loans. Private Education Loans are discussed in more detail below. Drivers of Growth in the Student Loan Industry The growth in our Managed student loan portfolio is driven by the growth in the overall student loan marketplace, as well as by our own market share gains. Rising enrollment and college costs have resulted in the size of the federally insured student loan market more than doubling over the last 10 years. Federally insured student loan originations grew from $29.0 billion in FFY 1997 to $64.3 billion in FFY 2007. According to the College Board, tuition and fees at four-year public institutions and four-year private institutions have increased 54 percent and 33 percent, respectively, in constant, inflation-adjusted dollars, since AY 1997-1998. Under the FFELP, there are limits to the amount students can borrow each academic year. The first loan limit increases since 1992 were implemented July 1, 2007 when freshman and sophomore limits were increased to $3,500 and $4,500 from $2,625 and $3,500, respectively. The fact that guaranteed student loan limits have not kept pace with tuition increases has driven more students and parents to Private Education Loans to meet an increasing portion of their education financing needs. Loans — both federal and private — as a percentage of total student aid were 53 percent of total student aid in AY 1996-1997 and 52 percent in AY 2006-2007. Private Education Loans accounted for 24 percent of total student loans — both federally guaranteed and Private Education Loans — in AY 2006-2007, compared to 7 percent in AY 1997-1998. The National Center for Education Statistics predicts that the college-age population will increase approximately 14 percent from 2007 to 2016. Demand for education credit will also increase due to the rise in students not attending college directly from high school and adult education. 12
  • 14. The following charts show the historical and projected enrollment and average tuition and fee growth for four-year public and private colleges and universities. Historical and Projected Enrollment (in millions) Historical and Projected Enrollment Levels 20.4 20.2 21 19.9 19.7 19.4 19.1 18.8 18.6 18.3 18 17.7 17.5 17.3 18 16.9 16.6 15.9 15.3 15 12 9 6 3 0 2000 2003 2006 2009 2012 2015 Source: National Center for Education Statistics Note: Total enrollment in all degree-granting institutions; middle alternative projections for 2006 onward. Cost of Attendance(1) Cumulative % Increase from AY 1997-1998 100 80 60 40 20 – 98 99 00 01 02 03 04 05 06 07 19 19 20 20 20 20 20 20 20 20 Tuition & Fees 4-Year Private Tuition & Fees 4-Year Public Source: The College Board (1) Cost of attendance is in current dollars and includes tuition, fees and on-campus room and board. Sallie Mae’s Lending Business Our primary marketing point-of-contact is the school’s financial aid office where we focus on delivering flexible and cost-effective products to the school and its students. Our sales force is the largest in the industry and currently markets the following internal lender brands: Academic Management Services (“AMS”), Nellie Mae, Sallie Mae Education Trust, SLM Financial, Student Loan Funding Resources (“SLFR”), Southwest Student Services (“Southwest”) and Student Loan Finance Association (“SLFA”). We also actively market the loan guarantee of United Student Aid Funds, Inc. (“USA Funds”) and its affiliate, Northwest Education Loan Association (“NELA”), through a separate sales force. We acquire student loans from two principal sources: our Preferred Channel and strategic acquisitions. In 2007, we originated $25.5 billion in student loans through our Preferred Channel, of which a total of $16.6 billion or 65 percent was originated through our internal lending brands. The mix of Preferred Channel Originations marks a significant shift from the past, when our internal lending brands were the smallest component of our Preferred Channel Originations. Internal lending brand growth is a key factor to our long- 13
  • 15. term market penetration. This positions us to control our future volume as well as the costs to originate new assets. Our internal lending brand loans are our most valuable loans because we do not pay a premium other than to ED to originate them. The adverse impact of the CCRAA on FFELP loan profitability has further increased the importance of our internal lending brands as a vehicle for achieving appropriate risk-adjusted returns. Preferred Channel Originations growth has been fueled by new business from schools leaving the FDLP or other FFELP lending relationships, same school sales growth, and growth in the for-profit sector. Since 1999, we have partnered with over 300 schools that have chosen to return to the FFELP from the FDLP. Our FFELP loan originations at these schools totaled over $2.4 billion in 2007. In addition to working with new schools, we have also forged broader relationships with many of our existing school clients. Our FFELP and private originations at for-profit schools have grown faster than at not-for-profit schools due to enrollment trends as well as our increased market share of lending to these institutions. We expect that in 2008 and in subsequent years this trend will be reversed. Many of our for-profit school customers have programs for which we offer non-traditional loans. As we cut back on Private Education Loan programs to this non-traditional segment of our customer base, we expect to lose FFELP loan volume originated through these schools as well. Similarly, as we reduce premiums for lender partner and school-as-lender purchases, we expect to lose FFELP volume. Accordingly, we expect volume in both FFELP loan and Private Education Loan originations to decline in 2008 relative to 2007. Consolidation Loans Between 2003 and 2006, we experienced a surge in consolidation activity as a result of aggressive marketing and historically low interest rates. This growth has contributed to the changing composition of our student loan portfolio. FFELP Consolidation Loans earn a lower yield than FFELP Stafford Loans due primarily to the Consolidation Loan Rebate Fee. The Consolidation Loan margin was 75 basis points lower than a FFELP Stafford loan in repayment as a result of this fee. This negative impact is somewhat mitigated by the longer average life of FFELP Consolidation Loans. FFELP Consolidation Loans now represent 67 percent of both our on-balance sheet federally guaranteed student loan portfolio and Managed federally guaranteed portfolio, respectively. We expect the percentage of our portfolio consisting of Consolidation Loans will decline steadily over time. The CCRAA dramatically reduced the margin on new FFELP Consolidation Loans and, as a result these loans are only marginally profitable for high balance loans and are not profitable for lower loan balances. Legislation passed in 2006 provided for all FFELP loans to bear a fixed rate to the borrower, thereby eliminating the potential for the borrower to lock in a more beneficial interest rate on post-July 1, 2006 loans in a low interest rate environment. This had a significant adverse impact on the Consolidation Loan industry that developed as a result of the low interest rate environment that existed between 2000 and 2004. Accordingly, we are no longer buying Wholesale Consolidation Loans or actively marketing Consolidation Loans to our customer base. Finally, under the HEA, borrowers with loan balances exceeding $30,000 can extend their repayment term without consolidating their loans. As a result of all of these factors, we believe that FFELP loans will have a much lower propensity to consolidate in the future. We intend to accommodate those borrowers who have high loan balances and who wish to consolidate their loans. We will also direct borrowers wishing to extend their loan’s term to the FFELP extended repayment product, which we believe will be an attractive alternative to a Consolidation Loan for borrowers seeking a lower monthly payment. GradPLUS The Deficit Reduction Act of 2005 expanded the existing Federal PLUS loan program to include graduate and professional students (“GradPLUS Loans”). Previously, PLUS loans were restricted to parents of dependent, undergraduate students. GradPLUS Loans generally have a lower rate of interest than our Private Education Loans and they allow graduate and professional students to borrow up to the full cost of their education (tuition, room and board), 14
  • 16. less other financial aid received. In 2007, we originated $606 million of GradPLUS loans which represented two percent of our Preferred Channel Originations. Private Education Loans The rising cost of education has led students and their parents to seek additional private sources to finance their education. Private Education Loans are often packaged as supplemental or companion products to FFELP loans. Over the last several years, the growth of Private Education Loans has continued due to tuition increasing faster than the rate of inflation coupled with stagnant FFELP lending limits. This growth combined with the relatively higher spreads has led to Private Education Loans contributing a higher percentage of our net interest margin in recent years. We expect this trend to continue in the foreseeable future in part due to margin erosion for FFELP student loans. In 2007, Private Education Loans contributed 36 percent of our overall “Core Earnings” net interest income before provisions for loan losses plus other income, up from 29 percent in 2006. The Higher Education Reconciliation Act of 2005 increased FFELP loan limits on July 1, 2007 for freshman and sophomores. This, along with the introduction of GradPLUS Loans discussed above, will somewhat offset the rate of growth in Private Education Loans in the future. We believe this loss of future Private Education Loan volume for graduate students will be replaced by an increase in federally insured loans. Since we bear the full credit risk for Private Education Loans, they are underwritten and priced according to credit risk based upon customized consumer credit scoring criteria. We mitigate some of this credit risk by providing price and eligibility incentives for students to obtain a credit-worthy cosigner, and 52 percent of our Managed Private Education Loans have a cosigner. Due to their higher risk profile, Private Education Loans earn higher spreads than their FFELP loan counterparts. In 2007, Private Education Loans earned an average “Core Earnings” spread (before provisions for loan losses and the Interim ABCP Facility Fees) of 5.15 percent versus an average “Core Earnings” spread of 1.04 percent for FFELP loans (before provisions for loan losses and the Interim ABCP Facility Fees). Our largest Private Education Loan program is the Signature Student Loan», which is offered to undergraduates and graduates through the financial aid offices of colleges and universities to supplement traditional FFELP loans. We also offer specialized loan products to graduate and professional students primarily through our MBA Loans», LAWLOANS» and, Sallie Mae Medical School Loans» and Sallie Mae DENTALoans» programs. Generally, these loans do not require borrowers to begin repaying their loans until after graduation and allow a grace period from six to nine months. In 2004 we began to offer Tuition Answer» loans directly to the consumer through targeted direct mail campaigns and Web-based initiatives. Under the Tuition Answer loan program, creditworthy parents, sponsors and students may borrow between $1,500 and $40,000 per year to cover any qualified higher education expense, but now capped at the full cost of tuition and board at the school they attend. No school certification is required, although a borrower must provide enrollment documentation. At December 31, 2007, we had $3.3 billion of Tuition Answer loans outstanding in our Managed student loan portfolio. We also offer alternative Private Education Loans for information technology, cosmetology, mechanics, medical/dental/lab, culinary and broadcasting education programs. On average, these career training programs typically last fewer than 12 months. These loans require the borrower to begin repaying the loan immediately; however, students can opt to make relatively small payments while enrolled. At December 31, 2007, we had $2.4 billion of career training loans outstanding. Acquisitions We have acquired several companies in the student loan industry that have increased our sales and marketing capabilities, added significant new brands and greatly enhanced our product offerings. The following 15
  • 17. table provides a timeline of strategic acquisitions that have played a major role in the growth of our Lending business. Lending Segment Timeline July 1999 October July 2000 Nellie 2004 USA Group Mae Southwest 1999 2000 2001 2002 2003 2004 2005 2006 2007 July 2000 November December SLFR 2003 2004 AMS SLFA Financing Prior to the announcement of the Merger, the Company funded its loan originations primarily with a combination of term asset-backed securitizations and unsecured debt. Upon the announcement of the Merger on April 17, 2007, credit spreads on our unsecured debt widened considerably, significantly increasing our cost of accessing the unsecured debt markets. As a result, in the near term, we expect to fund our operations primarily through the issuance of student loan asset-backed securities and borrowings under secured student loan financing facilities, as further described below. We historically have been a regular issuer of term asset- backed securities in the domestic and international capital markets. (See also “MANAGEMENT’S DISCUS- SION AND ANALYSIS OF FINANCIAL CONDITION AND RESULTS OF OPERATIONS — LIQUIDITY AND CAPITAL RESOURCES.”) For the reasons described above, securitization is currently and is likely to continue to be our principal source of cost-effective financing. We expect approximately 90 percent or more of our funding needs in 2008 will be satisfied through asset-backed securitizations. The Company has engaged J.P. Morgan Securities, Inc. (“JPMorgan”) and Banc of America Securities, LLC (“BAS”) as Lead Arrangers and Joint Bookrunners along with Barclays Capital, The Royal Bank of Scotland, plc and Deutsche Bank Securities, Inc. as Co-Lead Arrangers and Credit Suisse, New York Branch, as Arranger to underwrite and arrange up to $28.0 billion of secured FFELP loan facilities and a $7.0 billion secured private credit student loans facility (together, the “Facilities”). As of February 28, 2008, we anticipate closing on $23.4 billion of FFELP student loan ABCP conduit facilities and $5.9 billion of Private Education Loan ABCP conduit facilities on February 29, 2008, or as soon as practical thereafter. Also on that date, we anticipate closing on an additional $2.0 billion secured FFELP loan facility. In addition, we anticipate closing on an additional $2.5 billion of student loan ABCP conduit facilities by mid March 2008. The new $33.8 billion of financing facilities we expect to close on, which may ultimately be increased to up to $35 billion in aggregate, will replace our $30 billion Interim ABCP Facility and $6 billion ABCP facility. The initial term of each of the new facilities will be 364 days. These new facilities will provide funding for certain of our FFELP loans and Private Education Loans until such time as these loans are refinanced in the term ABS markets. In the event amounts outstanding under the Interim ABCP Facility are not repaid by the Company in full, the Interim ABCP Facility will terminate on April 24, 2008. In connection with our financing programs, we undertake regular investor development efforts intended to continually expand and diversify our pool of investors. One of our major objectives when financing our business is to minimize interest rate risk by matching the interest rate and term characteristics of our Managed assets with our Managed liabilities, generally on a pooled 16
  • 18. basis, to the extent practical. To achieve this objective, we use derivative financial instruments extensively to reduce our interest rate and foreign currency exposure. Match funding and interest rate risk management also help stabilize our student loan spread in various interest rate environments. On February 4, 2008, Standard & Poor’s Ratings Services announced that it lowered our credit ratings to “BBB-/A-3” from “BBB+/A-2.” Standard & Poor’s also announced that our rating remains on CreditWatch with negative implications, pending the closing of the new asset-backed commercial paper conduit discussed above. Notwithstanding the lowering of our credit rating, we believe that we have taken several steps in the last several months to further strengthen the company and position it for ratings improvement in the future. These steps include raising more than $3.0 billion in equity capital, securing commitments for $33.8 billion in financing from some of the world’s largest financial institutions, eliminating our equity forward positions and curtailing certain private education lending programs to students attending schools where loan performance is materially below our original expectations. We intend to continue to work with Standard & Poor’s and the other rating agencies to demonstrate our financial strength and stability. Sallie Mae Bank On November 3, 2005, we announced that the Utah Department of Financial Institutions approved our application for an industrial bank charter. Beginning in February and August 2006, Sallie Mae Bank (the “Bank”) began funding and originating Private Education Loans and FFELP Consolidation Loans, respectively, made by Sallie Mae to students and families nationwide. This allows us to capture the full economics of these loans from origination. In addition, the industrial bank charter allows us to expand the products and services we can offer to students and families. Funds received in connection with our tuition payment plan product are deposited and held in escrow with the Bank. In addition, cash rebates that Upromise members earn from qualifying purchases from Upromise’s participating companies are held by the Bank. These deposits are used by the Bank for a low cost source of funding. Competition Our primary competitor for federally guaranteed student loans is the FDLP, which in its first four years of existence (FFYs 1994-1997) grew its market share of the total federally sponsored student loan market from four percent in FFY 1994 to a peak of 34 percent in FFY 1997. The FDLP’s market share has steadily declined since then to 20 percent in FFY 2007. Historically, we have also faced competition for both federally guaranteed and non-guaranteed student loans from a variety of financial institutions including banks, thrifts and state-supported secondary markets. However, as a result of the CCRAA and the dislocation in the capital markets, the student loan industry is undergoing a significant transition. A number of student lenders have ceased operations altogether or curtailed activity. The environment of aggressive price competition between lenders has also decreased dramatically. Many of the lenders that remain in the business have been rationalizing pricing by reducing borrower benefits. As a result of these factors, we believe that as the largest student lender, we are well positioned to increase market share in the coming years. Our FFY 2007 FFELP Preferred Channel Originations totaled $17 billion, representing a 27 percent market share. ASSET PERFORMANCE GROUP BUSINESS SEGMENT In our APG segment, we provide a wide range of accounts receivable and collections services including student loan default aversion services, defaulted student loan portfolio management services, and contingency collections services for student loans and other asset classes. We also provide accounts receivable management and collections services on consumer and mortgage receivable portfolios that we purchase. The table below presents a timeline of key acquisitions that have fueled the growth of our APG business, including: General Revenue Corporation (“GRC”) and Pioneer Credit Recovery (“PCR”), concentrated in the student loan industry; AFS Holdings, LLC, the parent company of Arrow Financial Services, LLC (collectively, “AFS”), a debt management company that purchases and services distressed debt in several industries including and outside of education receivables; and GRP/AG Holdings, LLC (“GRP”), a debt management company that acquires and manages portfolios of sub-performing and non-performing mortgage loans. 17
  • 19. In recent years we have diversified our APG contingency revenue stream into the purchase of distressed and defaulted receivables to complement our student loan business. We now have the expertise to acquire and manage portfolios of sub-performing and non-performing mortgage loans, substantially all of which are secured by one-to-four family residential real estate. We also have a servicing platform and a disciplined portfolio pricing approach to several consumer debt asset classes. APG Segment Timeline January September 2002 July 2000 2004 GRC USA Group AFS 1999 2000 2001 2002 2003 2004 2005 2006 2007 January August 2002 2005 PCR GRP In 2007, our APG business segment had revenues totaling $605 million and net income of $116 million. Our largest customer, USA Funds, accounted for 28 percent of our revenue in 2007. Products and Services Student Loan Default Aversion Services We provide default aversion services for five guarantors, including the nation’s largest, USA Funds. These services are designed to prevent a default once a borrower’s loan has been placed in delinquency status. Defaulted Student Loan Portfolio Management Services Our APG business segment manages the defaulted student loan portfolios for six guarantors under long- term contracts. APG’s largest customer, USA Funds, represents approximately 17 percent of defaulted student loan portfolios in the market. Our portfolio management services include selecting collection agencies and determining account placements to those agencies, processing loan consolidations and loan rehabilitations, and managing federal and state offset programs. Contingency Collection Services Our APG business segment is also engaged in the collection of defaulted student loans and other debt on behalf of various clients including guarantors, federal agencies, schools, credit card issuers, utilities, and other retail clients. We earn fees that are contingent on the amounts collected. We provide collection services for ED and now have approximately 11 percent of the total market for such services. We have relationships with more than 900 colleges and universities to provide collection services for delinquent student loans and other receivables from various campus-based programs. Collection of Purchased Receivables In our APG business, we also purchase delinquent and defaulted receivables from credit originators and other holders of receivables at a significant discount from the face value of the debt instruments. In addition, we purchase sub-performing and non-performing mortgage receivables at a discount usually calculated as a percentage of the underlying collateral. We use a combination of internal collectors and outside collection agencies to collect on these portfolios, seeking to attain the highest cost/benefit for our overall collection strategy. We recognize revenue primarily using the effective yield method, though we use the cost recovery 18
  • 20. method when appropriate, in certain circumstances. A major success factor in the purchased receivables business is the ability to effectively price the portfolios. We conduct both quantitative and qualitative analysis to appropriately price each portfolio to yield a return consistent with our APG financial targets. Competition The private sector collections industry is highly fragmented with few large companies and a large number of small scale companies. The APG businesses that provide third-party collections services for ED, FFELP guarantors and other federal holders of defaulted debt are highly competitive. In addition to competing with other collection enterprises, we also compete with credit grantors who each have unique mixes of internal collections, outsourced collections, and debt sales. Although the scale, diversification, and performance of our APG business has been a competitive advantage, the trend in the collections industry is for credit grantors to sell portfolios rather than to manage contingency collections. In the purchased paper business, the marketplace is trending more toward open market competitive bidding rather than solicitation by sellers to a select group of potential buyers. Price inflation and the availability of capital in the sector contribute to this trend. Unlike many of our competitors, our APG business does not rely solely on purchased portfolio revenue. This enables us to maintain pricing discipline and purchase only those portfolios that are expected to meet our profitability and strategic goals. Portfolios are purchased individually on a spot basis or through contractual relationships with sellers to periodically purchase portfolios at set prices. We compete primarily on price, and additionally on the basis of our reputation and industry experience. CORPORATE AND OTHER BUSINESS SEGMENT The Company’s Corporate and Other business segment includes the aggregate activity of its smaller operating segments, primarily its Guarantor Servicing, Loan Servicing, and Upromise operating segments. Corporate and Other also includes several smaller products and services, including comprehensive financing and loan delivery solutions to college financial aid offices and students to streamline the financial aid process. Guarantor Services We earn fees for providing a full complement of administrative services to FFELP guarantors. FFELP student loans are guaranteed by these agencies, with ED providing reinsurance to the guarantor. The guarantors are non-profit institutions or state agencies that, in addition to providing the primary guarantee on FFELP loans, are responsible for other activities, including: • guarantee issuance — the initial approval of loan terms and guarantee eligibility; • account maintenance — the maintaining, updating and reporting on records of guaranteed loans; • default aversion services — these services are designed to prevent a default once a borrower’s loan has been placed in delinquency status (we perform these activities within our APG segment); • guarantee fulfillment — the review and processing of guarantee claims; • post claim assistance — assisting borrowers in determining the best way to pay off a defaulted loan; and • systems development and maintenance — the development of automated systems to maintain compli- ance and accountability with ED regulations. Currently, we provide a variety of these services to nine guarantors and, in AY 2006-2007, we processed $17.9 billion in new FFELP loan guarantees, of which $14.2 billion was for USA Funds, the nation’s largest guarantor. We processed guarantees for approximately 32 percent of the FFELP loan market in AY 2006-2007. Guarantor servicing fee revenue, which includes guarantee issuance and account maintenance fees, was $156 million for the year ended December 31, 2007, 86 percent of which we earned from services performed on behalf of USA Funds. Under some of our guarantee services agreements, including our agreement with USA Funds, we receive certain scheduled fees for the services that we provide under such agreements. The 19
  • 21. payment for these services includes a contractually agreed upon set percentage of the account maintenance fees that the guarantors receive from ED. The Company’s guarantee services agreement with USA Funds has a five-year term that will be automatically increased by an additional year on October 1 of each year unless a prior notice is given by either party. Our primary non-profit competitors in guarantor servicing are state and non-profit guarantee agencies that provide third-party outsourcing to other guarantors. (See APPENDIX A, “FEDERAL FAMILY EDUCATION LOAN PROGRAM — Guarantor Funding” for details of the fees paid to guarantors.) Upromise Upromise has a number of programs that encourage consumers to save for the cost of college education. Upromise has established an affinity marketing program which is designed to increase consumer purchases of merchant goods and services and to promote saving for college by consumers who are members of this program. Merchant partners generally pay Upromise transaction fees based on member purchase volume, either online or in stores depending on the contractual arrangement with the merchant partner. A percentage of the consumer members’ purchases is set aside in an account maintained by Upromise on the members’ behalf. Upromise, through its wholly owned subsidiaries, Upromise Investments, Inc. (“UII”), a registered broker-dealer, and Upromise Investment Advisors, LLC (“UIA”), provides transfer and servicing agent services and program management associated with various 529 college-savings plans. Upromise manages $19 billion in 529 college-savings plans. REGULATION Like other participants in the FFELP, the Company is subject to the HEA and, from time to time, to review of its student loan operations by ED and guarantee agencies. ED is authorized under its regulations to limit, suspend or terminate lenders from participating in the FFELP, as well as impose civil penalties if lenders violate program regulations. The laws relating to the FFELP are subject to revision. In addition, Sallie Mae, Inc., as a servicer of federal student loans, is subject to certain ED regulations regarding financial responsibil- ity and administrative capability that govern all third-party servicers of insured student loans. Failure to satisfy such standards may result in the loss of the government guarantee of the payment of principal and accrued interest on defaulted FFELP loans. Also, in connection with our guarantor servicing operations, the Company must comply with, on behalf of its guarantor servicing customers, certain ED regulations that govern guarantor activities as well as agreements for reimbursement between the Secretary of Education and the Company’s guarantor servicing customers. Failure to comply with these regulations or the provisions of these agreements may result in the termination of the Secretary of Education’s reimbursement obligation. The Company’s originating or servicing of federal and private student loans also subjects it to federal and state consumer protection, privacy and related laws and regulations. Some of the more significant federal laws and regulations that are applicable to our student loan business include: • the Truth-In-Lending Act; • the Fair Credit Reporting Act; • the Equal Credit Opportunity Act; • the Gramm-Leach Bliley Act; and • the U.S. Bankruptcy Code. 20
  • 22. APG’s debt collection and receivables management activities are subject to federal and state consumer protection, privacy and related laws and regulations. Some of the more significant federal laws and regulations that are applicable to our APG business include: • the Fair Debt Collection Practices Act; • the Fair Credit Reporting Act; • the Gramm-Leach-Bliley Act; and • the U.S. Bankruptcy Code. In addition, our APG business is subject to state laws and regulations similar to the federal laws and regulations listed above. Finally, certain APG subsidiaries are subject to regulation under the HEA and under the various laws and regulations that govern government contractors. Sallie Mae Bank is subject to Utah banking regulations as well as regulations issued by the Federal Deposit Insurance Corporation, and undergoes periodic regulatory examinations. Finally, Upromise’s affiliates, which administer 529 college-savings plans, are subject to regulation by the Municipal Securities Rulemaking Board, the National Association of Securities Dealers, Inc. and the Securities and Exchange Commission (“SEC”) through the Investment Advisers Act of 1940. AVAILABLE INFORMATION The SEC maintains an Internet site (http://www. sec. gov) that contains periodic and other reports such as annual, quarterly and current reports on Forms 10-K, 10-Q and 8-K, respectively, as well as proxy and information statements regarding SLM Corporation and other companies that file electronically with the SEC. Copies of our annual reports on Form 10-K and our quarterly reports on Form 10-Q are available on our website as soon as reasonably practicable after we electronically file such reports with the SEC. Investors and other interested parties can also access these reports at www. salliemae.com/about/investors. Our Code of Business Conduct, which applies to Board members and all employees, including our Chief Executive Officer and Chief Financial Officer, is also available, free of charge, on our website at www.salliemae.com/about/business_code. htm. We intend to disclose any amendments to or waivers from our Code of Business Conduct (to the extent applicable to our Chief Executive Officer or Chief Financial Officer) by posting such information on our website. In 2007, the Company submitted the annual certification of its Chief Executive Officer regarding the Company’s compliance with the NYSE’s corporate governance listing standards, pursuant to Section 303A.12(a) of the NYSE Listed Company Manual. In addition, we filed as exhibits to the Company’s Annual Report on Form 10-K for the year ended December 31, 2006 and to this Annual Report on Form 10-K, the certifications required under Section 302 of the Sarbanes-Oxley Act of 2002. 21
  • 23. Item 1A. Risk Factors LENDING BUSINESS SEGMENT — FFELP STUDENT LOANS Because of the new FFELP economics resulting from the College Cost Reduction and Access Act of 2007 and the increased funding spreads in the current capital markets, we have made significant changes to our business strategy, but there can be no assurance that such changes will be effective in meeting these challenges. On September 27, 2007, the College Cost Reduction and Access Act of 2007 (“CCRAA”) was signed into law by the President. The CCRAA substantially reduced the profitability of our FFELP business, including a reduction in Special Allowance Payments, the elimination of the Exceptional Performer designa- tion and the corresponding reduction in default payments to 97 percent through 2012 and 95 percent thereafter, an increase in the lender paid origination fees for certain loan types, and reduction in default collections retention fees and account maintenance fees related to guaranty agency activities. As a result, assuming no reductions to borrower benefits or to our operating and servicing costs, we expect that the CCRAA will reduce substantially our pre-tax yield on FFELP loans. This reduction combined with higher financing costs resulting from the severe dislocations in the global capital markets, could possibly eliminate the profitability of new FFELP loan originations, while increasing our Risk Sharing in connection with our FFELP loan portfolio. We also expect that low-balance FFELP Consolidation Loans will no longer be profitable. As a result of these developments, management has revised its business strategy to: • Focus on origination and acquisition activities for both FFELP loans and Private Education Loans that generate acceptable returns under the new FFELP economics; • Curtail unprofitable originations that have less strategic value, including: • Education loans made to certain borrowers that have or are expected to have a high default rate (see “GLOSSARY — Private Education Loans”); and • Wholesale Consolidation Loan acquisitions and low-balance FFELP Consolidation Loan originations. • Adjust the pricing of Private Education Loan products to reflect market conditions; and • Reduce or, over time, eliminate borrower benefits on FFELP loans. In addition, we have reduced the premium that we pay for FFELP loan volume at certain school-as-lender clients. We also anticipate reducing the premium that we pay for FFELP loan volume with certain of our lender partners. These actions are likely to effectively end our school-as-lender relationships and to result in certain of our lender partners either exiting the FFELP business or seeking others with whom to partner. These actions could also adversely affect the growth in our guarantee and APG collection businesses. We also will undertake a comprehensive review of all of our business units with a goal of achieving appropriate risk-adjusted returns across all of our business segments and providing cost-effective services. In addition, we aim to reduce our operating expenses by up to 20 percent as compared to 2007 operating expenses by year-end 2009, before adjusting for growth and other investments. Since year-end 2007, as part of this expense reduction effort, we have reduced our work force by approximately three percent. Accordingly, we could lose management that are key to managing operational risk. There can be no assurance that changes we are making or may make in the future to address these developments will be successful in meeting the significant challenges of the new FFELP economics and the increased funding spreads in the current capital markets. A larger than expected increase in third-party consolidation activity may reduce our loan spreads, materially impair our Retained Interest, reduce our interest earning assets and otherwise materially adversely affect our results of operations. If third-party consolidation activity increases beyond management’s expectations, our student loan spread may be adversely affected; our Retained Interest may be materially impaired; our future earnings may be reduced from the loss of interest earning assets; and our results of operations may be adversely affected. Our student loan spread may be adversely affected because third-party consolidators generally target our highest yielding FFELP Loans and an increased run-off of Private Education Loans, which generally have higher 22
  • 24. yields than our FFELP loans, would change the overall mix within our portfolio resulting in a reduction to our weighted-average loan spread. Our Retained Interest may be materially impaired if consolidation activity reaches levels not anticipated by management. We may also incur impairment charges if we increase our expected future Constant Prepayment Rate (“CPR”) assumptions used to value the Residual Interest as a result of such unanticipated levels of consolidation. The potentially material adverse affect on our operating results related to FFELP loans also relates to our hedging activities in connection with Floor Income. We enter into certain Floor Income Contracts under which we receive an upfront fee in exchange for our payment of the Floor Income earned on a notional amount of underlying FFELP Loans over the life of the Floor Income Contract. If third-party consolidation activity that involves refinancing a Sallie Mae managed existing FFELP Loan with a new third-party owned FFELP Loan increases substantially, then the Floor Income that we are obligated to pay under such Floor Income Contracts may exceed the Floor Income actually generated from the underlying FFELP loans, possibly to a material extent. In such a scenario, we would either close out the related Floor Income Contracts or purchase an offsetting hedge. In either case, the adverse impact on both our GAAP and “Core Earnings” could be material. (See “MANAGEMENT’S DISCUSSION AND ANALYSIS OF FINANCIAL CONDITION AND RESULTS OF OPERATIONS — LENDING BUSINESS SEGMENT — Floor Income — Managed Basis.”) Incorrect estimates and assumptions by management in connection with the preparation of our consolidated financial statements could adversely affect the reported amounts of assets and liabilities and the reported amounts of income and expenses. The preparation of our consolidated financial statements requires management to make certain critical accounting estimates and assumptions that could affect the reported amounts of assets and liabilities and the reported amounts of income and expense during the reporting periods. (See “MANAGEMENT’S DISCUS- SION AND ANALYSIS OF FINANCIAL CONDITION AND RESULTS OF OPERATIONS — CRITICAL ACCOUNTING POLICIES AND ESTIMATES.”) For example, for both our federally insured and Private Education Loans, the unamortized portion of premiums and discounts is included in the carrying value of the student loan on the consolidated balance sheet. We recognize income on our student loan portfolio based on the expected yield of the student loan after giving effect to the amortization of purchase premiums and accretion of student loan income discounts, as well as the impact of Repayment Borrower Benefits. In arriving at the expected yield, we make a number of estimates that when changed are reflected as a cumulative catch-up from the inception of the student loan. The most sensitive estimate for premium and discount amortization is the estimate of the CPR, which measures the rate at which loans in the portfolio pay before their stated maturity. The CPR is used in calculating the average life of the portfolio. A number of factors can affect the CPR estimate such as the rate of consolidation activity and default rates. If we make an incorrect CPR estimate, the previously recognized income on our student loan portfolio based on the expected yield of the student loan will need to be adjusted in the current period. The amount of loan loss reserves also depends on estimates. We maintain an allowance for loan losses at an amount believed to be sufficient to absorb losses incurred in our FFELP loan and Private Education Loan portfolios based on estimated probable net credit losses as of the reporting date. We analyze those portfolios to determine the effects that the various stages of delinquency have on borrower default behavior and ultimate charge-off. When calculating the allowance for loan losses on Private Education Loans, we divide the portfolio into categories of similar risk characteristics based on loan program type, loan status (in-school, grace, repayment, forbearance, delinquency), underwriting criteria, existence or absence of a cosigner, and aging. We use historical experience coupled with qualitative factors regarding changes in portfolio mix, macroeconomic indicators, policies, procedures, laws, regulations, underwriting, and other factors to estimate default and collection rate projections. We then apply these default and collection rate projections to each category of loan to estimate the necessary allowance balance. Because the process relies on historical experience, if current or future loan loss experience varies significantly from the past, our allowance could be deemed inadequate to cover incurred losses in the portfolio. Additionally, since the allowance estimate is also reliant on other qualitative factors, management’s ability to determine which qualitative factors are relevant to the allowance and our ability to accurately incorporate these factors into our estimates can have a material impact on the allowance. 23