1. Financial Data 2006 – 1996
Leggett & Platt, Incorporated
10-Year
CAGR(7) 2006 2005 2004 2003(1)
(Dollar amounts in millions, except per share data)
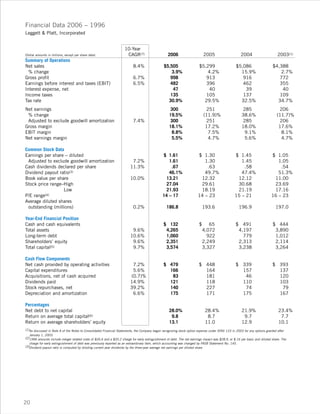
Summary of Operations
Net sales 8.4% $5,505 $5,299 $5,086 $4,388
% change 3.9% 4.2% 15.9% 2.7%
Gross profit 6.7% 998 913 916 772
Earnings before interest and taxes (EBIT) 6.5% 482 396 462 355
Interest expense, net 47 40 39 40
Income taxes 135 105 137 109
Tax rate 30.9% 29.5% 32.5% 34.7%
Net earnings 300 251 285 206
% change 19.5% (11.9)% 38.6% (11.7)%
Adjusted to exclude goodwill amortization 7.4% 300 251 285 206
Gross margin 18.1% 17.2% 18.0% 17.6%
EBIT margin 8.8% 7.5% 9.1% 8.1%
Net earnings margin 5.5% 4.7% 5.6% 4.7%
Common Stock Data
Earnings per share – diluted $ 1.61 $ 1.30 $ 1.45 $ 1.05
Adjusted to exclude goodwill amortization 7.2% 1.61 1.30 1.45 1.05
Cash dividends declared per share 11.3% .67 .63 .58 .54
Dividend payout ratio(3) 46.1% 49.7% 47.4% 51.3%
Book value per share 10.0% 13.21 12.32 12.12 11.00
Stock price range–High 27.04 29.61 30.68 23.69
Low 21.93 18.19 21.19 17.16
P/E range(4) 14 – 17 14 – 23 15 – 21 16 – 23
Average diluted shares
outstanding (millions) 0.2% 186.8 193.6 196.9 197.0
Year-End Financial Position
Cash and cash equivalents $ 132 $ 65 $ 491 $ 444
Total assets 9.6% 4,265 4,072 4,197 3,890
Long-term debt 10.6% 1,060 922 779 1,012
Shareholders’ equity 9.6% 2,351 2,249 2,313 2,114
Total capital(5) 9.7% 3,574 3,327 3,238 3,264
Cash Flow Components
Net cash provided by operating activities 7.2% $ 479 $ 448 $ 339 $ 393
Capital expenditures 5.6% 166 164 157 137
Acquisitions, net of cash acquired (0.7)% 83 181 46 120
Dividends paid 14.9% 121 118 110 103
Stock repurchases, net 39.2% 140 227 74 79
Depreciation and amortization 6.6% 175 171 175 167
Percentages
Net debt to net capital 28.0% 28.4% 21.9% 23.4%
Return on average total capital(6) 9.8 8.7 9.7 7.7
Return on average shareholders’ equity 13.1 11.0 12.9 10.1
(1)As discussed in Note A of the Notes to Consolidated Financial Statements, the Company began recognizing stock option expense under SFAS 123 in 2003 for any options granted after
January 1, 2003.
(2)1996 amounts include merger related costs of $26.6 and a $20.2 charge for early extinguishment of debt. The net earnings impact was $28.9, or $.16 per basic and diluted share. The
charge for early extinguishment of debt was previously reported as an extraordinary item, which accounting was changed by FASB Statement No. 145.
(3)Dividend payout ratio is computed by dividing current year dividends by the three-year average net earnings per diluted share.
20
3. Management’s Discussion and Analysis of Financial Condition and Results of Operations
Leggett & Platt, Incorporated
2006 HIGHLIGHTS Commercial 2006 Sales
Commercial 17%
We posted record sales and earnings in 2006. Sales Fixturing &
increased primarily from acquisitions. Inflation, offset by unit Components:
volume declines in certain businesses, resulted in modest Operations in this Aluminum 10%
internal sales growth. Full year earnings benefited from the segment produce:
Residential
net impact of several unusual items. a) store fixtures,
47% Industrial 13%
The restructuring plan launched in the third quarter of point-of-purchase
2005 was completed in 2006. We began realizing the displays, and
Specialized 13%
anticipated earnings benefits in the last half of 2006, and storage products
should see the full impact in 2007 and subsequent years. used by retailers;
Our use of cash in 2006 was consistent with our b) chair controls, bases, and other components for office
stated priorities: furniture manufacturers; and c) injection molded plastic
• We funded capital expenditures at levels in line with components used in a variety of end products.
those of 2005. Aluminum Products: This segment provides die cast
• We spent $83 million on acquisitions. aluminum components for customers that manufacture many
• We raised our dividend for the 35th consecutive year. products including motorcycles, diesel and small engines,
• As planned, excess cash (after funding growth and outdoor lighting fixtures, appliances, power tools, and
dividends) was used for share repurchases. consumer electronics.
Cash from operations, our primary source of funds, Industrial Materials: These operations primarily supply
increased versus 2005. In addition, our debt remained steel rod, drawn steel wire, and welded steel tubing to other
slightly below the lower end of our long-term, targeted range. Leggett operations and to external customers. Our wire and
These topics are discussed in more detail in the sections tubing is used to make bedding, furniture, automotive seats,
that follow. retail store fixtures and displays, mechanical springs, and
many other end products.
INTRODUCTION Specialized Products: From this segment we supply lumbar
What We Do systems and wire components used by automotive seating
Leggett & Platt is a FORTUNE 500 diversified manufacturers. We design, produce, and sell van interiors (the
manufacturer that conceives, designs, and produces a wide racks, shelving, and cabinets installed in service vans) and
range of engineered components and products found in many truck bodies (for cargo vans, flatbed trucks, service trucks,
homes, retail stores, offices, and automobiles. We make and dump trucks) used in light-to-medium duty commercial
components that are often hidden within, but integral to, our trucks. We also design and produce machinery, both for our
customers’ products. own use and for others, including bedding manufacturers.
We are North America’s leading independent manufacturer
of: components for residential furniture and bedding, Customers
adjustable beds, carpet underlay, retail store fixtures and We serve a broad suite of customers, with no single one
point-of-purchase displays, components for office furniture, representing even 5% of our sales. Many are companies whose
non-automotive aluminum die castings, drawn steel wire, names are widely recognized; they include most manufacturers
automotive seat support and lumbar systems, and machinery of furniture and bedding, a variety of other manufacturers, and
used by the bedding industry for wire forming, sewing, many major retailers.
and quilting. We primarily sell our products through our own sales
employees, although we also use independent sales
Our Segments representatives and distributors in some of our businesses.
Our 124-year-old company is composed of 29 business
units under five reportable segments, with approximately Major Factors That Impact Our Business
33,000 employee-partners, and more than 300 facilities Many factors impact our business, but those that generally
located in over 20 countries around the world. Our five have the greatest impact are: market demand for our products,
segments are Residential Furnishings, Commercial Fixturing raw material cost trends, energy costs, and competition.
& Components, Aluminum Products, Industrial Materials, and
Specialized Products. Market Demand
Residential Furnishings: This segment supplies a variety Market demand (including product mix) is impacted by
of components mainly used by bedding and upholstered several economic factors, with consumer confidence being
furniture manufacturers in the assembly of their finished most significant. Other important factors include disposable
products. We also sell adjustable beds, bed frames, income levels, employment levels, housing turnover, and
ornamental beds, carpet cushion, geo components (includes interest rates. All these factors influence consumer spending
synthetic fabrics and various other products used in ground on durable goods, and therefore affect demand for our
stabilization, drainage protection, and erosion and weed components and products. Some of these factors also
control, as well as silt fencing, chemicals, seed, and influence business spending on facilities and equipment,
fertilizer), and other finished products. which impacts approximately one-quarter of our sales.
22
4. Despite generally favorable economic conditions in recent manufacturing operations are heavy users of natural gas and
years, demand in some of our markets has been weak. In electricity. Our ability to respond to these cost increases by
2006, a decrease in bedding market demand led to lower raising selling prices affects our operating results.
volume in our businesses serving that industry. In addition, We continuously monitor natural gas price trends and have
North American automotive production declined in 2006, and locked in prices on a portion of our natural gas requirements
this also had an adverse affect on some of our operations. for the next three years. The details of those arrangements
are discussed in Note P to the financial statements on
Raw Material Costs page 56.
In many of our businesses, we enjoy a cost advantage from Higher energy prices can also impact consumer demand in
buying large quantities of raw materials. This purchasing certain markets. As consumers pay more for fuel and utilities,
leverage is a benefit that many of our competitors do not they have less disposable income to purchase products that
have. Still, our costs can vary significantly as market prices contain our components. We believe consumers purchased
for raw materials (many of which are commodities) fluctuate. fewer mattresses during 2006 in part due to the impact
Purchasing arrangements vary considerably across the higher energy prices had on disposable income.
company. We typically have short-term commitments from our
suppliers; accordingly our raw material costs generally move Competition
with the market. In certain of our businesses, we have longer- Many of our markets are highly competitive, with the
term purchase contracts with pricing terms that provide number of competitors varying by product line. In general,
stability under reasonable market conditions. However, when our competitors tend to be smaller, private companies.
commodities experience extreme inflation, vendors do not We believe we gain competitive advantage in our global
always honor those contracts. markets through low cost operations, significant internal
Our ability to recover higher costs (through selling price production of key raw materials, superior manufacturing
increases) is crucial. We have few long-term, fixed-pricing expertise and product innovation, higher quality products,
contracts with customers. When we experience significant extensive customer service capabilities, long-lived
increases in raw material costs, we typically implement price relationships with customers, and greater financial strength.
increases to recover the higher costs. Although we are Many of our competitors, both domestic and foreign, compete
generally able to pass through most cost increases, we primarily on the basis of price. Our success has stemmed
encounter greater difficulty (i) in businesses where we have from the ability to remain price competitive, while delivering
a smaller market share, and (ii) in products that are of a product quality, innovation, and customer service.
commodity nature. Inability to recover cost increases (or a We face increasing pressure from foreign competitors as
delay in the recovery time) can impact our earnings. some of our customers source a portion of their components
Steel is our most significant raw material. During 2004, and finished products from Asia. When prices for key materials
the price of certain types of steel nearly doubled, but we were (such as steel, aluminum, and chemicals) are comparable
able to recover most of these higher costs through selling throughout the world, it is generally cheaper to produce our
price increases. Steel costs were more stable (at high levels) components in the U.S. because of our products’ low
in 2005 and 2006, although there were some quarter-to- labor content. However, in instances where our customers
quarter fluctuations in those years. Unusual market move production of their finished products overseas, our
conditions in 2004 and early 2005 resulted in unsustainably operations must be located nearby to supply them efficiently.
high profit margins on our steel rod production. In 2006, the Accordingly, at the end of 2006, Leggett operated 12 facilities
market began returning to more normal levels. in China.
In 2005, we experienced significant inflation in In recent years, we have experienced increased price
chemicals, fibers, and resins (generally driven by changes in competition in the U.S. from Chinese bedding component
oil prices). These costs remained relatively flat (at high levels) manufacturers. This has primarily occurred with lower-end
in 2006, and the majority of the 2005 cost increases are now commodity products in geographic markets easily served by
reflected in our selling prices. major ocean ports. We reacted to this competition in 2006
In addition to steel and oil-based materials, we also use by selectively adjusting prices, and also by developing
significant amounts of aluminum, but we are generally less new proprietary products that help reduce our customers’
exposed to cost changes in this commodity because of the total costs.
pricing arrangements we have with our customers. The increased price competition for bedding components
When we raise our prices to recover higher raw material is partially due to lower wire costs in China. Asian
costs, this sometimes causes customers to modify their manufacturers currently benefit from lower costs for
product designs and replace higher cost components with commodities such as steel and chemicals. We believe these
lower cost components. We experienced this de-contenting commodities are subsidized at times by Asian governments.
effect during 2005 and 2006, as our customers changed the When there is a cost imbalance in global commodities, this
quantity and mix of components in their finished goods to can impact pricing and demand for our products. Asian
address the significant steel and chemical inflation from manufacturers also benefit from lenient attitudes toward
recent years. Our profit margins were negatively impacted as safety and environmental matters, as well as currency rates
a result of this de-contenting. that are pegged to the U.S. dollar rather than free floating.
However, when exporting to the U.S., they must overcome
Energy Costs higher transportation costs, increased working capital needs,
Higher prices for natural gas, electricity, and fuel increase and difficulty matching U.S. manufacturers’ levels of service,
our production and delivery costs. Many of our large flexibility, and logistics.
23
5. Restructuring and Asset Impairments process improvements, and are evaluating others aimed at
In the third quarter of 2005, we launched a significant reducing operating costs and increasing speed to market.
broad-based restructuring project to reduce excess capacity We expect our renewed emphasis on innovation and product
and improve performance in a number of our businesses. development to result in new product introductions that will
That restructuring was completed in 2006 (except for some allow us to expand our customer base, as well as increase
remaining asset sales). sales to existing customers. In addition, we are continuing
As part of the restructuring our efforts to maximize capacity utilization and will
Net Restructuring-
plan, we identified 36 consolidate or close additional operations if necessary.
Related charges
underutilized or underperforming Millions of dollars
facilities that were subsequently RESULTS OF OPERATIONS – 2006 VS. 2005
55
closed, consolidated, or sold (the During 2006, we attained record sales and earnings.
2005 Closure and Consolidation Sales grew 4% for the year, primarily from acquisitions.
Initiative). We also took a Earnings increased due to several factors, including lower
more critical look at other restructuring-related expenses, absence of 2005’s higher
underperforming operations; as a workers’ compensation costs, and reimbursement of
result, we modified or accelerated Canadian lumber duties. We also realized benefits from
12
9
restructuring activities that were the restructuring, as expected, in the later part of the year.
previously underway, and Further details about these items and our consolidated and
0
04 05 06
identified other operations with segment results are discussed below.
impaired assets.
Net costs associated with all 2005 and 2006 restructuring- Consolidated Results
related activities were approximately $67 million, of which The following table shows the changes in sales and
$55 million were recognized in 2005 and $12 million were earnings from 2005 to 2006, and identifies the major factors
recognized in 2006. These charges include the cost of plant contributing to the changes:
closures (building cleanup and repair), equipment relocation,
employee severance pay, asset impairment, inventory (Dollar amounts in millions
except per share data) Amount %
obsolescence, and similar items, partially offset by gains from
Net sales:
asset sales. Of these net costs, about two-thirds were non-cash
Year ended December 31, 2005 $5,299
items. We estimate future gains from asset sales in the range
Acquisition sales growth 279 5.3%
of $10 million to $20 million, but the timing of these gains
Restructuring-related closures & divestitures (92) (1.7)%
is uncertain and actual amounts could fall outside this Internal sales growth 19 0.3%
estimated range. Year ended December 31, 2006 $5,505 3.9%
Of the 36 facilities under the Closure and Consolidation
Net earnings:
Initiative, about half were in Residential Furnishings, one- Year ended December 31, 2005 $ 251
quarter were in Commercial Fixturing & Components, and Lower restructuring-related charges 29
the remainder were in Industrial Materials and Specialized Lower workers’ compensation expense 14
Products. These operations had total revenue of roughly Reimbursement of Canadian Lumer Duty 10
$400 million per year. Most of this volume shifted to other Other offsetting factors including restructuring
facilities, but as anticipated, we reduced sales by $92 million benefits, income from recent acquisitions,
product mix, price competition, and
per year as we divested small, non-core operations and
higher interest expense (4)
walked away from unprofitable business. The majority of
Year ended December 31, 2006 $ 300
this volume reduction occurred in the Residential and
Earnings Per Share December 31, 2005 $ 1.30
Commercial segments.
Earnings Per Share December 31, 2006 $ 1.61
We expect an ongoing annual pre-tax earnings benefit from
the restructuring plan of approximately $30-$35 million. We
Acquisitions contributed most of the full year sales gains,
realized about half of these benefits in 2006, and should see
but this increase was partially offset by declines, as expected,
the full impact in 2007 and subsequent years. The benefits
from restructuring and divestitures. The restructuring-related
result primarily from the elimination of fixed costs associated
sales decrease occurred as we chose to walk away from
with closed facilities, and a reduction in the number of
business that was marginally profitable, or in some instances,
employees. We provide additional details about restructuring
unprofitable. Internal sales (i.e., excluding acquisitions and
and asset impairment in Note N to the financial statements
divestitures) were roughly flat for the year. Lower volume in
on page 55.
certain businesses offset inflation-related sales growth (from
price increases we implemented to recover higher raw material
Fixture & Display Performance
costs). The price increases related primarily to higher costs for
Sales volume in our Fixture & Display business declined
chemicals and other oil-based raw materials early in the year
slightly in 2006. While overall demand in this business has
(versus lower levels in early 2005) and higher aluminum costs.
been difficult to predict, we are not expecting a significant
In the North American bedding market, volume was weak
near-term change in the market.
for most of the year and softened further beginning in
Although we are realizing the expected restructuring
September. Automotive demand, and to a lesser extent,
benefits, margins for this business are still not at desired
custom store fixture demand was also soft for most of the year.
levels. Efforts to improve performance are continuing on a
In contrast, our residential furniture components, office
number of fronts. We are implementing certain production
24
6. furniture components, machinery, and foam businesses Residential Furnishings sales increased in 2006, primarily
performed very well. These trends are discussed in the from acquisitions. Internal sales grew slightly during the year,
segment results below. mainly due to inflation in our foam businesses and unit growth
Net earnings and earnings per share increased versus 2005 in upholstered furniture components. However, weak demand
primarily due to: and price competition in the U.S. bedding market, in addition
• Lower restructuring-related charges: Costs associated with to de-contenting by some of our customers (those who have
the restructuring plan, discussed on page 55, decreased chosen to replace higher cost components with lower cost
in 2006. components) has offset much of the internal sales gains.
• Lower workers’ compensation expense: In 2005, we EBIT and EBIT margins increased versus 2005 due to
significantly increased our reserves for workers’ several factors:
compensation to reflect higher costs of medical care and • Lower restructuring-related charges, net of gains from
longer durations of claims. Workers’ compensation costs asset sales ($16 million)
returned to normal levels in 2006. • Reimbursement of Canadian lumber duty ($14 million)
• Reimbursement of Canadian lumber duty: In late 2006, • Lower workers’ compensation expense ($11 million)
we received a refund of duties that we had paid to the • Operational benefits from the restructuring
U.S. Customs Department over the previous four years on • Improved market conditions in our foam and fiber
imports of softwood lumber from Canada. businesses
Earnings benefited as expected from restructuring-related • Income from recent acquisitions
operating improvements during the last half of 2006. These improvements were partially offset by lower bedding
Acquisitions completed over the past several months volume, increased price competition, and higher energy and
(including those completed in late 2005) also contributed to transportation costs.
the 2006 earnings increase. In addition, a lower share count We aggressively protected our bedding market share during
drove a portion of the increase in earnings per share. These 2006 as we dealt with price competition and de-contenting
earnings improvements were partially offset by: by our customers. Product development plays a key role
• Product mix: Higher raw material costs in recent years in improving margins and increasing market share in our
have led some customers to modify their product design bedding component business. New product designs for both
and replace higher cost components with lower cost (and innersprings and box springs have recently been introduced
lower margin) components. and are being well received by the market.
• Price competition: In 2006, we experienced price
competition in certain markets, and we responded by Commercial Fixturing & Components
selectively reducing prices of certain of our products. EBIT
(Dollar amounts in millions) Sales EBIT Margins
• Higher net interest expense ($5 million)
Year ended December 31, 2006 $1,033 $64 6.2%
Year ended December 31, 2005 1,069 40 3.7%
Segment Results
Increase (decrease) $ (36) $24
In the following section we discuss 2006 sales and
% increase (decrease) (3)% 60%
earnings before interest and taxes (EBIT) for each of our
Internal sales growth (2)%
segments. Reported amounts for 2004 and 2005 in the
Acquisitions (net of restructuring
Commercial Fixturing & Components segment and the & divestitures) (1)%
Specialized Products segment have been restated for an
organizational change effective January 1, 2006. This change Sales decreased in 2006 from a combination of lower unit
moved Commercial Vehicle Products operations from volume and the impact, as expected, of restructuring activity.
Commercial Fixturing & Components to Specialized Products, Demand for custom fixtures and displays softened in the
and also moved a small office components operation from latter part of the year, but this decrease was partially offset
Specialized Products to Commercial Fixturing & Components. by continued growth in our businesses supplying office
We provide additional detail on our restated segment results furniture components.
and a reconciliation of segment EBIT to consolidated EBIT in Despite lower sales, EBIT and EBIT margins increased
Note L to the financial statements on page 52. versus 2005 primarily due to:
• Lower restructuring-related charges, net of gains from
Residential Furnishings asset sales ($14 million)
EBIT
• Lower workers’ compensation expense ($5 million)
(Dollar amounts in millions) Sales EBIT Margins
• Operational benefits from the restructuring
Year ended December 31, 2006 $2,768 $277 10.0%
Segment margins improved during 2006, but are still
Year ended December 31, 2005 2,622 170 6.5%
below targeted levels. Further margin gains should come from
Increase (decrease) $ 146 $107
the restructuring benefits and additional volume, but other
% increase (decrease) 6% 63%
operating initiatives (that are underway) should contribute
Internal sales growth 1%
about two-thirds of the remaining improvement needed to
Acquisitions (net of restructuring
reach targeted levels.
& divestitures) 5%
25
7. Aluminum Products Specialized Products
EBIT EBIT
(Dollar amounts in millions) Sales EBIT Margins (Dollar amounts in millions) Sales EBIT Margins
Year ended December 31, 2006 $558 $42 7.5% Year ended December 31, 2006 $754 $43 5.7%
Year ended December 31, 2005 531 31 5.8% Year ended December 31, 2005 661 33 4.9%
Increase (decrease) $ 27 $11 Increase (decrease) $ 93 $10
% increase (decrease) 5% 35% % increase (decrease) 14% 30%
Internal sales growth 5% Internal sales growth –
Acquisitions (net of restructuring Acquisitions (net of restructuring
& divestitures) – & divestitures) 14%
Sales increased in 2006 solely from internal growth. Sales growth in 2006 resulted entirely from acquisitions
Inflation was the main driver (we passed through higher raw completed in late 2005. Internal sales were essentially flat for
material costs) but was partially offset by slight declines in the year. In our automotive business, market weakness in
unit volumes. Small engine sales were weak during the last North America, particularly in larger vehicles that contain
half of 2006, in part due to the absence of significant weather more seats with higher-end features, has been offset by growth
events that drive generator and snow blower sales; outdoor grill in Asia and Europe. Machinery volume was stronger in 2006,
volume also declined, offsetting gains in several of our other reflecting improved demand for bedding related equipment in
markets during the year. certain international markets. In the Commercial Vehicle
EBIT and EBIT margins increased versus 2005 from: Products business, demand for fleet van interiors (racks,
• Higher sales shelving, and cabinets installed in service vans) grew in 2006,
• Benefits from the restructuring and other operational but we experienced market softness for commercial truck
progress over the past year equipment (truck bodies for cargo vans, flatbed trucks, service
• Lower restructuring-related costs ($3 million) trucks, and dump trucks), caused in part by production cuts at
These benefits were partially offset by start-up costs at the auto and truck manufacturers, and associated shortages of
our new facility in Auburn, Alabama, and higher energy costs. commercial truck chassis. This situation was corrected late in
EBIT margins in 2006 were also negatively impacted by 2006, and truck chassis are now available.
the pass-through of higher raw material costs with little EBIT and EBIT margins increased versus 2005 in part
incremental profit. due to:
• Lower restructuring-related costs ($6 million)
Industrial Materials • Earnings from recently acquired companies
• Lower workers’ compensation expense ($2 million)
EBIT
(Dollar amounts in millions) Sales EBIT Margins • Operational benefits from the restructuring
Year ended December 31, 2006 $751 $ 62 8.2% Currency factors ($6 million) offset some of these gains.
Year ended December 31, 2005 844 104 12.3%
Although segment margins improved this year, they are still
Increase (decrease) $ (93) $ (42)
below targeted levels in part due to lower volume in North
% increase (decrease) (11)% (40)%
American automotive and portions of the Commercial Vehicle
Internal sales growth (10)%
businesses, as well as continued weakness of the U.S. dollar
Acquisitions (net of restructuring
versus the Canadian dollar.
& divestitures) (1)%
RESULTS OF OPERATIONS – 2005 VS. 2004
Internal sales were down for the year due, in equal parts, to
We achieved record sales in 2005, exceeding the prior
deflation and lower unit volumes. Volume declines resulted
year by 4%. Earnings for the year decreased primarily due to
from continued weakness in U.S. bedding demand (which
restructuring, asset impairment, and inventory obsolescence
impacts our wire operations) and lower production levels in the
charges (related to the restructuring plan). Inflation was a
automotive industry (which impacts our tubing businesses).
challenge during the year, primarily in oil-based raw
EBIT and EBIT margins decreased versus 2005 largely
materials, but by year-end these higher costs were reflected
from reduced sales, lower profitability at the rod mill, and
in our selling prices. Further details about these items and
higher raw material costs. Lower restructuring-related expenses
our consolidated and segment results are discussed below.
($4 million), lower workers’ compensation costs ($3 million),
and restructuring benefits offset some of this decline.
In 2004 and 2005, segment margins were above our long-
range, targeted levels mainly due to unusual market conditions
that resulted in unsustainably high margins on our rod
production. In 2006, the market began returning to more
normal levels.
26
8. Consolidated Results dollars but incur costs in Canadian dollars). These declines
The following table shows the changes in sales and were partially offset by benefits from sales growth and a tax
earnings from 2004 to 2005, and identifies the major factors benefit from a planned foreign entity restructuring and cash
contributing to the changes: repatriation transaction. This transaction generated a net tax
benefit of approximately $10 million.
(Dollar amounts in millions
except per share data) Amount % Segment Results
Net sales: In the following section, we discuss 2005 sales and
Year ended December 31, 2004 $5,086
earnings before interest and taxes (EBIT) for each of our
Acquisition sales growth (net of divestitures) 107 2.1%
segments. A reconciliation of segment EBIT to consolidated
Internal sales growth 106 2.1%
EBIT is provided in Note L to the financial statements on
Year ended December 31, 2005 $5,299 4.2%
page 52.
Net earnings:
All of our segments use the first-in, first-out (FIFO)
Year ended December 31, 2004 $ 285
method for valuing inventory. In 2004, segment margins
Restructuring-related charges (37)
generally benefited under the FIFO method from the effect of
Higher workers’ compensation expense (14)
rising commodity costs. In 2005, declining steel costs caused
Lower tax rate 10
margins (mainly in Residential and Industrial) to decrease
Increased sales and other 7
under this same method. In our consolidated financials, we
Year ended December 31, 2005 $ 251
use the last-in, first-out (LIFO) method for determining the
Earnings Per Share December 31, 2004 $ 1.45
cost of about half of our inventories. An adjustment is made at
Earnings Per Share December 31, 2005 $ 1.30
the corporate level (i.e., outside the segments) to convert the
appropriate operations to the LIFO inventory method.
Internal growth and acquisitions each contributed about
half the net sales increase. Internal sales growth (i.e., growth
Residential Furnishings
excluding acquisitions and divestitures) was mainly due to
EBIT
inflation – we implemented price increases to recover higher
(Dollar amounts in millions) Sales EBIT Margins
raw material costs. These increases related primarily to higher
Year ended December 31, 2005 $2,622 $170 6.5%
costs for steel early in the year (versus lower levels in early
Year ended December 31, 2004 2,482 265 10.7%
2004), and for chemicals, fibers, and resins throughout 2005.
Increase (decrease) $ 140 $ (95)
By late 2005, steel costs had declined (versus peak levels in
% increase (decrease) 6% (36)%
the last half of 2004), and we experienced modest deflation
Internal sales growth 3%
in a few businesses. Acquisition sales growth 3%
Unit volumes were mixed across our various markets. For
the full year, we posted solid growth in our businesses Sales in Residential Furnishings increased in 2005 from a
supplying upholstered furniture components, but these gains combination of internal growth and acquisitions. Inflation
were offset by declines in our bedding and automotive contributed the bulk of the internal sales growth. During the
businesses. Volume was essentially flat in many of our other first half of 2005, sales increased over the prior year due to
markets. These trends are discussed in the segment results price increases (for the pass through of higher steel costs)
which follow. implemented in the latter part of 2004. In the last half of
Inflation was a significant challenge again in 2005. The 2005, declining steel costs (which were also passed through
largest impact resulted from higher oil prices, which affect the to our customers) resulted in slight deflation in certain
cost of raw materials such as chemicals, fibers, and resins. businesses. When combined, these price-related factors led to
Many of these costs rose throughout the year, but the higher full year sales.
increases accelerated following the 2005 hurricanes. In Unit volume declines and changes in product mix partially
response, we raised prices to our customers, and by year-end, offset inflation-related sales growth in 2005. Unit volumes
the higher costs were reflected in our selling prices. were down slightly, with decreases in bedding more than
Net earnings and earnings per share decreased versus offsetting gains in upholstered furniture components. In
2004 primarily due to: addition, inflation in the raw materials used to produce
• Restructuring-related charges: As shown in the previous finished bedding and upholstered furniture has, in certain
table, restructuring-related charges represent the majority cases, led our customers to change their product design,
of the decrease in 2005 earnings. These charges include which has reduced the quantity and changed the mix of
the cost of plant closures, equipment relocation, components they buy from us.
employee severance pay, asset impairment, inventory EBIT and EBIT margins decreased versus 2004 due to
obsolescence, and other similar costs associated with the several factors:
restructuring plan discussed on page 55. • Restructuring-related and asset impairment charges
• Higher workers’ compensation expense: In 2005, we ($26 million)
significantly increased our reserves for workers’ • Selling price decreases related to lower steel costs – We
compensation to reflect higher costs of medical care and reduced selling prices (to reflect lower steel costs) more
longer durations of claims, since more treatment options quickly than we were able to consume our higher cost
are available and can continue over longer periods of inventories.
time. • Higher energy and transportation costs
Earnings were also affected by higher energy and • Increased workers’ compensation expense ($11 million)
transportation costs, and a weaker U.S. dollar (which caused
margin declines in our Canadian operations that sell in U.S.
27
9. • Changes in product mix (i.e., increased sales of lower Industrial Materials
margin components) EBIT
(Dollar amounts in millions) Sales EBIT Margins
• Currency impacts (approximately $6 million) – In certain
Year ended December 31, 2005 $844 $104 12.3%
operations, we incur costs in Canadian dollars and sell
Year ended December 31, 2004 818 122 14.9%
products in U.S. dollars. The weaker U.S. dollar caused
Increase (decrease) $ 26 $ (18)
margin declines in these operations.
% increase (decrease) 3% (15)%
• Unit volume declines in bedding
Internal sales growth 3%
• Inflation in certain raw materials
Acquisition sales growth –
Commercial Fixturing & Components
Internal growth contributed the entire sales increase in
EBIT
2005, with inflation more than offsetting lower unit volumes.
(Dollar amounts in millions) Sales EBIT Margins
During the first half of 2005, sales increased over last year
Year ended December 31, 2005 $1,069 $ 40 3.7%
due to price increases (for the pass through of higher steel
Year ended December 31, 2004 995 54 5.4%
costs) implemented in the latter part of 2004. In the last half
Increase (decrease) $ 74 $(14)
of 2005, declining steel costs, which were also passed
% increase (decrease) 7% (26)%
through to our customers, resulted in deflation. When
Internal sales growth 6%
combined, these price-related factors led to higher full
Acquisition sales growth 1%
year sales.
Internal growth accounted for the bulk of the sales increase Unit volumes declined for the year primarily due to weaker
in 2005. Inflation (primarily related to higher steel costs) and bedding demand (which impacts our wire operations) and
higher unit volumes each contributed about half of the lower production levels in the automotive industry (which
internal sales growth. impacts our tubing businesses). When bedding demand
Our Fixture & Display businesses experienced modest improved late in the year, unit volumes in this segment
increases in unit volume during the year. We also posted slight increased slightly.
unit volume gains in office furniture components, which EBIT and EBIT margins decreased versus 2004 due to
continued a trend of stable to improving market conditions several factors, including:
that began mid-year 2003. • Restructuring-related and asset impairment charges
EBIT and EBIT margins decreased versus 2004 primarily ($4 million)
due to: • Higher energy and transportation costs
• Restructuring-related and asset impairment charges • Increased workers’ compensation expense ($3 million)
($13 million) • Unit volume declines
• Currency impacts (approximately $6 million)
• Higher workers’ compensation expense ($5 million) Specialized Products
These items were partially offset by benefits related to slightly EBIT
(Dollar amounts in millions) Sales EBIT Margins
higher unit volume and gains from asset sales (approximately
Year ended December 31, 2005 $661 $ 33 4.9%
$3 million).
Year ended December 31, 2004 651 52 8.0%
Increase (decrease) $ 10 $(19)
Aluminum Products
% increase (decrease) 2% (37)%
EBIT
Internal sales growth (4)%
(Dollar amounts in millions) Sales EBIT Margins
Acquisition sales growth 6%
Year ended December 31, 2005 $531 $ 31 5.8%
Year ended December 31, 2004 522 46 8.7%
In 2005, a decline in internal sales was more than offset
Increase (decrease) $9 $(15)
by acquisition growth. Volume decreased in our automotive
% increase (decrease) 2% (33)%
and machinery businesses. Lower production levels in the
Internal sales growth 2%
automotive industry during 2005 led to reduced volume in our
Acquisition sales growth –
businesses supplying that industry. In addition, bedding
Higher sales in 2005 were entirely due to internal growth. manufacturers (the primary customers of our machinery
Unit volumes were up slightly, but inflation contributed most business) reduced their capital spending in 2005 due to lower
of the increase as we passed through higher raw material market demand for bedding throughout most of the year. This
costs. The rate of internal growth in this segment slowed as restricted spending impacted our machinery volume during
the year progressed and we reached the one year anniversary the year.
of the start-up of major new programs from 2004. EBIT and EBIT margins decreased versus 2004 primarily
EBIT and EBIT margins decreased versus 2004 due to: due to:
• Restructuring-related and asset impairment charges • Restructuring-related and asset impairment charges
($3 million) ($9 million)
• Inefficiencies at some plants – primarily (i) losses at a • Unit volume declines
facility that is now closed, and (ii) costs associated with • Currency impacts (approximately $3 million)
the start-up of new programs • Higher workers’ compensation expense ($2 million)
• Higher energy costs
• A work stoppage at one facility
28
10. LIQUIDITY AND CAPITALIZATION In 2005, we acquired 12 companies with annualized sales
In this section, we provide details about our of approximately $320 million ($170 million in Residential
• Uses of cash Furnishings and $150 million in Specialized Products).
• Cash from operations • Residential Furnishings: We added 10 businesses in this
• Debt position and total capitalization segment. The largest, Ikex/Jarex, significantly expanded
our presence in the conversion and distribution of geo
Our priorities for use of cash, in order of importance, are:
components. Geo components include geotextiles
• Finance internal growth and acquisitions
(synthetic fabrics used in a variety of applications such
• Pay dividends and extend our record of annual increases
as ground stabilization, drainage protection, erosion
• Repurchase our stock
control, and weed control), silt fencing, seed, and other
Our operations provide much of the cash required to fund related products sold primarily to the construction,
these priorities. Over the past two years, we also increased landscaping, and agricultural industries. The other
net debt and used excess cash for a portion of these items, acquisitions in the segment:
including higher levels of acquisitions and share repurchases. • established, early in 2005, a small foothold in
Net debt to net capital has increased from 21.9% at the geo components
beginning of 2005 to 28.0% at the end of 2006. Our long- • broadened our product offerings to include all
term goal is to have net debt as a percent of net capital in major types of carpet underlay
the 30% – 40% range, while maintaining our longstanding • expanded our base of operations producing
“single A” debt rating. furniture mechanisms in China
• added to our businesses that produce and sell
Uses of Cash bedding components, upholstered furniture
Capital
Expenditures
Finance Growth components, and top-of-the-bed products
Millions of dollars
We use cash to fund growth, • Commercial Fixturing & Components: We acquired one
both internally through capital company which had been a key supplier to our Fixture &
166
164
expenditures and externally Display operations for many years. This company
157
through acquisitions. produces retail store fixtures and gondola shelving.
Capital expenditures are Importantly, it gave us an operating presence in China
investments we make to from which to serve the growing domestic Chinese
modernize, maintain, and expand market. The acquisition expanded our manufacturing
manufacturing capacity. We expect capacity but did not significantly increase our reported
2007 capital spending to be sales since most of the product is sold to other Leggett
about $180 million, up slightly operations for distribution in the U.S.
04 05 06
from 2006. • Specialized Products: We acquired America’s Body
Acquisitions add to our business Company, a designer, manufacturer, and supplier of
Cash Used for
by expanding our markets, equipment for light-to-medium duty commercial trucks.
Acquisitions
product lines, or manufacturing Major product categories include van interiors (racks,
Millions of dollars
capabilities. Our level of shelving, and cabinets installed in service vans) and truck
acquisition spending was lower bodies (for cargo vans, flatbed trucks, service trucks, and
181
in 2006 than it was in 2005, dump trucks).
as fewer opportunities came to We provide additional details about acquisitions in Note B
fruition. In 2005, we completed to the financial statements on page 44.
several acquisitions, including the 83
Dividends Paid
third largest in our history. In Pay Dividends
46 Millions of dollars
addition to the initial cash outlays In 2006, we increased our annual
for acquisitions (shown in the dividend for the 35th consecutive 121
118
110
accompanying chart), we also year. Over the last three years,
0
04 05 06
assumed debt of $1 million, dividends have grown at a 7%
$35 million, and $5 million, respectively in the 2004, 2005, compound annual rate. Our long-term
and 2006 transactions. target for dividend payout is
We acquired five businesses in 2006 that should add approximately one-third of the prior
about $75 million to annual revenue. All these transactions three years’ average earnings. Our
occurred in the Residential Furnishings segment. These actual dividend payout has been
acquisitions: above those levels in recent years,
04 05 06
• broadened our geographic presence and product but as earnings grow, we expect to
offerings in geo components move back toward that target. We
• expanded our rubber carpet underlay business expect to spend approximately $125 million on dividend
• added to our international spring operations payments in 2007.
29
11. Repurchase Stock In 2005, cash from operations increased, despite lower
Annual Dividend
Rate
During the past two years, we earnings. A smaller increase in working capital (compared
Cents per share
have purchased a total of to 2004) was the main driver, and resulted primarily from
67
16.5 million shares of our stock lower inflation.
63
58
and reduced our outstanding shares In 2004, cash from operations benefited from stronger
by about 7%. We typically fund earnings, but was reduced overall by an increase in working
our share repurchases with cash capital. The higher working capital levels were primarily the
from operations. result of inflation.
In 2005, we purchased Working capital levels vary by segment, with the
10.3 million of our shares, requirements of Aluminum Products and Commercial
considerably more than in any Fixturing & Components generally higher than overall
previous year. This was an company averages. Accounts receivable balances in these
04 05 06
opportunistic move that was driven segments are typically higher due to the longer credit terms
by two main factors: 1) additional required to service certain customers of the Aluminum Die
cash was available as we increased Casting and Fixture & Display businesses. These same
Dividend Payout
net debt, and 2) a lower stock price businesses also require higher inventory investments due to
Percent
in the last few months of the year the custom nature of their products, longer manufacturing
49.7
47.4 46.1
presented an attractive buying lead times (in certain cases), and the needs of many
opportunity. Almost six million customers to receive large volumes of product within
shares were purchased during a nine short periods of time.
week period in the third and fourth
quarters, at an average price of Capitalization
about $20.25 per share. In 2006, This table presents key debt and capitalization statistics at
share repurchases were lower (versus the end of the three most recent years.
2005), in part because we did not
0
have as large an increase in our (Dollar amounts in millions) 2006 2005 2004
04 05 06
Long-term debt outstanding:
net debt levels. Payout = annual dividend
Scheduled maturities $ 906 $ 922 $ 779
The cash available to repurchase rate / average EPS for
Average interest rates* 5.0% 5.0% 4.1%
prior 3 years
shares will fluctuate each year with
Average maturities in years* 7.4 7.8 5.6
earnings, capital spending, and the
Revolving credit/commercial paper 154 – –
pace of acquisitions. At a minimum, Total long-term debt 1,060 922 779
Stock
we typically repurchase shares to Deferred income taxes and
Repurchases, Net
replace those issued for employee other liabilities 163 156 145
Millions of dollars
stock plans (approximately two Shareholders’ equity 2,351 2,249 2,313
227
million shares each year). Although Total capitalization $3,574 $3,327 $3,237
no specific repurchase schedule has Unused committed credit:
been established, we have been Long-term $ 246 $ 400 $ 342
140
authorized by the Board of Directors Short-term – – –
Total unused committed credit $ 246 $ 400 $ 342
to repurchase up to 10 million
74
shares in 2007. We expect to spend Current maturities of long-term debt $ 52 $ 99 $ 401
about $250 – $300 million in 2007 Cash and cash equivalents $ 132 $ 65 $ 491
for acquisitions and share Ratio of earnings to fixed charges** 6.2x 6.7x 8.0x
0
repurchases combined. 04 05 06 * These calculations include current maturities but exclude commercial paper.
** Fixed charges include interest expense, capitalized interest, and implied interest included
in operating leases.
Cash from Operations
Cash From
Cash from operations is our Operations The next table shows the percent of long-term debt to total
primary source of funds. Changes in Millions of dollars
capitalization at December 31, 2006 and 2005. We show
earnings and working capital levels 479 this calculation in two ways:
448
are the two broad factors that
• Long-term debt to total capitalization as reported in the
generally have the greatest impact
previous table.
339
on our cash from operations. In
• Long-term debt to total capitalization, each reduced by
2006, cash from operations
total cash and increased by current maturities of long-
increased 7% over 2005. Earnings
term debt.
grew in 2006, but were partially
offset by increased working capital
due to higher inventories. This
04 05 06
inventory increase resulted primarily
from softening demand in certain
markets and opportunistic pre-buys of raw materials. Working
capital management remains a priority, and we expect to
improve these levels (as a percent of sales) in 2007.
30
12. We believe that adjusting this measure for cash and CONTRACTUAL OBLIGATIONS
current maturities allows more meaningful comparison to The following table summarizes our future contractual
recent periods during which cash has ranged from $65 obligations and commitments:
million to $491 million. We use these adjusted measures to
monitor our financial leverage. (Dollar amounts in millions) Payments Due by Period
Less
Than 1 1-3 3-5 After 5
(Dollar amounts in millions) 2006 2005
Contractual Obligations Total Year Years Years Years
Long-term debt $1,060 $ 922
Long-term debt* $1,093 $ 40 $107 $177 $ 769
Current debt maturities 52 99
Capitalized leases 19 12 4 2 1
Cash and cash equivalents (132) (65)
Operating leases 171 50 63 35 23
Net debt $ 980 $ 956
Purchase obligations** 431 431 – – –
Total capitalization $3,574 $3,327
Interest payments*** 369 54 97 78 140
Current debt maturities 52 99
Deferred income taxes 67 – – – 67
Cash and cash equivalents (132) (65)
Other obligations
Net capitalization $3,494 $3,361
(including pension) 96 6 13 9 68
Long-term debt to total capitalization 29.7% 27.7%
Total contractual cash
Net debt to net capitalization 28.0% 28.4% obligations $2,246 $593 $284 $301 $1,068
* The long-term debt payment schedule presented above could be accelerated if we were
Total debt (which includes long-term debt and current not able to make the principal and interest payments when due. Long-term debt
includes $154 million of outstanding commercial paper, which is generally due
debt maturities) increased $91 million in 2006. During the overnight. We have classified commercial paper as long-term debt (due in 3-5 years)
year, we added $190 million of debt, including $154 million since the commercial paper program is supported by a $400 million revolving credit
of commercial paper borrowings, and repaid $99 million of agreement which terminates in 2011.
** Purchase obligations primarily include open short-term (30-120 days) purchase orders
debt that came due. that arise in the normal course of operating our facilities.
Since 2003, we’ve issued $730 million of fixed rate *** Interest payments are calculated on debt outstanding at December 31, 2006 at rates in
effect at the end of the year. These totals include interest on the $154 million of
debt with an average remaining life at the end of 2006 of
outstanding commercial paper discussed above.
8.5 years, and a weighted average coupon rate of 4.7%. To
further facilitate the issuance of debt and other securities,
CRITICAL ACCOUNTING POLICIES AND ESTIMATES
$300 million remains available under a shelf registration.
We prepare our consolidated financial statements in
In addition to issuing long-term notes, we can also raise
accordance with accounting principles generally accepted
cash by issuing up to $400 million in commercial paper
in the United States of America. To do so, we must make
through a program that is backed by a $400 million, five year
estimates and judgments that affect the reported amounts
revolving credit commitment. We expect any commercial
of assets, liabilities, revenues, expenses, and disclosures.
paper issued under this agreement to be classified as long-
If we used different estimates or judgments our financial
term debt since we intend to maintain or increase the
statements would change, and some of those changes could
balance until it is replaced with long-term notes. At the end
be significant. Our estimates are frequently based upon
of 2006, $154 million in commercial paper was outstanding
historical experience and are considered by management,
under this program.
at the time they are made, to be reasonable and appropriate.
With both the shelf registration and the commercial paper
Estimates are adjusted for actual events, as they occur.
program in place, we believe we have sufficient funds
“Critical accounting estimates” are those that are:
available to support our ongoing operations and take
a) subject to uncertainty and change, and b) of material
advantage of growth opportunities.
impact to our financial statements. Listed here are the
Most of our debt has fixed repayment dates. At the end of
estimates and judgments which we believe could have the
2006, this debt consisted primarily of term notes. We have
most significant effect on our financial statements:
maintained a single A rating (from both Moody’s and
• Asset and goodwill impairment
Standard & Poor’s) on our term notes and public debt for over
• Inventory
a decade. Our commercial paper program carries a Moody’s
• Workers’ compensation, general liability and employee
rating of P-1 and a Standard & Poor’s rating of A-1.
benefit programs
• Credit losses
• Pension accounting
• Income taxes
• Contingencies
We provide additional details regarding our significant
accounting policies in Note A to the financial statements on
page 41.
31