SlideShare ist ein Scribd-Unternehmen logo
1 von 133
Downloaden Sie, um offline zu lesen
SA
   LE
     S


               20
                 01

                 20 $4.4
                        B
                   02
                           $
                      20 4.5B
                        03

                          20 $4.8
                                 B
                            04

                               20     $5
                                 05
   EP                                   .4B
     S
20
  01
                                         $5
                                           .7B
       $0
         .77

         20
           02

                      $1
                                                 2005 Annual Report


                         .10
                      20
                        03
                                                                      FOCUSING ON GLOBAL GROWTH


                              $1
                         20     .40
                           04

                               20
                                 05    $1
                                         .64

                                        $1
                                          .67
                                                                                                  FOOT LOCKER, INC.
FOOT LOCKER, INC.

About the Company
                                                                   Additionally, the Company's Footlocker.com/Eastbay
Foot Locker, Inc. (NYSE: FL) is the world's leading
                                                                   business operates a rapidly growing direct-to-customers
retailer of athletic footwear and apparel. Headquartered
                                                                   business offering athletic footwear, apparel and equip-
in New York City, it operates approximately 4,000 ath-
                                                                   ment through its Internet and catalog channels.
letic retail stores in 20 countries in North America,
Europe and Australia under the brand names Foot
Locker, Footaction, Lady Foot Locker, Kids Foot Locker
and Champs Sports.


FINANCIAL HIGHLIGHTS
(Millions, except per share amounts)


                                                                2001            2002      2003          2004         2005
Sales                                                         $ 4,379       $ 4,509     $ 4,779      $ 5,355       $5,653
Total operating profit                                        $ 197         $ 269       $ 342        $ 389         $ 409
Income from continuing operations                             $ 111         $ 162       $ 209        $ 255         $ 263
Diluted EPS from continuing operations                        $ 0.77        $ 1.10      $ 1.40       $ 1.64        $ 1.67
Cash, cash equivalents and short-term
  investment position, net of debt                            $ (184)       $    —      $ 113        $ 127         $ 261

Athletic stores sales
 per average gross square foot (dollars)                      $ 306         $ 316       $ 335        $ 345         $ 361


Table of Contents

Shareholders’ Letter 2 Business Overview 5 Foot Locker 6 Champs Sports 8 Footaction 9 Kids Foot Locker/Lady Foot Locker 10
Footlocker.com/Eastbay 11 Community Involvement 12 Form 10-K 13 Board of Directors, Corporate Management, Division Management,
Corporate Information IBC


Cover image illustrates Sales and Diluted EPS from Continuing Operations.
Athletic Stores Sales
             Per Average Gross                                $361
             Square Foot                                    $345
             (dollars)
                                                            $335
                                                       $316
        05
                                                      $306
        04
        03
        02
        01
 400


             Operating Profit
             (millions)
                                                              $409
                                                            $389
                                                     $342
       05
       04                                    $269
  300
       03
                                      $197
       02
       01


             Income from
             Continuing Operations
                                                              $263
             (millions)
                                                            $255

                                                    $209
       05
       04
                                         $162
500
       03
                               $111
       02
       01


             Diluted EPS from
             Continuing Operations
             (dollars)
                                                              $1.67
                                                              $1.64
       05
                                                           $1.40
       04
                                                       $1.10
       03
400
                                                      $0.77
       02
       01


                                                                      1
SHAREHOLDERS’ LETTER


      Overall, our business produced solid sales and pre-tax earnings increases in
      2005 while also generating strong cash flow that we are actively redeploying
      to benefit our shareholders.


                                                        Not to be overlooked in 2005 were the    gies we are employing, designed to
    For Foot Locker, Inc., 2005 was a year of
                                                    steps we continued to take to improve our    enhance the sales productivity of our
    accomplishments, both in positioning our
                                                    financial footing: We further strengthened   store fleet, are working as intended.
    Company to generate greater value for
                                                    our balance sheet by reducing our finan-     Going forward, we have raised the bar and
    shareholders, and in aggressively address-
                                                    cial liabilities, while also significantly   currently believe that we can enhance the
    ing new opportunities and challenges
                                                    increasing the amount of cash that we        productivity of our stores even further
    alike. For the most part we produced cred-
                                                    returned to our shareholders through div-    and, over time, achieve sales of $400 per
    itable results during the past year, but fell
                                                    idends and a share repurchase program.       average gross square foot within the next
    short of the earnings target we set for
                                                                                                 several years.
    ourselves at the beginning of the year.
                                                    2005 Financial Scoreboard                        We are also pleased with our continu-
        In brief, our performance in certain
                                                                                                 ing success in enhancing the Company's
    international markets, primarily in Europe,     Overall, our business produced solid sales
                                                                                                 financial position and utilizing our oper-
    did not meet our expectations. We have          and pre-tax earnings increases while also
                                                                                                 ating cash flow of $355 million to deliver
    since moved quickly to address several          generating strong cash flow that we are
                                                                                                 increased value for shareholders. Key
    internal and external factors that con-         actively redeploying to benefit our share-
                                                                                                 investment decisions made during the
    tributed to profit declines in these mar-       holders.
                                                                                                 year included:
    kets. To continue our success as a global
    specialty retailer, we must anticipate          The following highlights our achieve-
                                                                                                 • Investing $163 million in capital
    worldwide consumer trends and meet or           ments in 2005:
                                                                                                   expenditures
    exceed the needs of our customers.
                                                                                                 • Contributing $26 million to our pen-
    Towards this end, we are working actively       • Total sales increased 5.6 percent to
                                                                                                   sion funds
    with our suppliers to better assure that we       $5.7 billion
                                                                                                 • Repaying $35 million of long-term
    provide to our customers, wherever they         • Pre-tax profit increased 8.3 percent to
                                                                                                   debt
    reside, the most fashionable, highest             $405 million
                                                                                                 • Paying $49 million of dividends to our
    quality products at compelling and com-         • Earnings per share from continuing
                                                                                                   shareholders
    petitive prices.                                  operations increased to $1.67
                                                                                                 • Repurchasing $35 million of our com-
        On a more positive note, we are             • Cash position, net of debt, increased
                                                                                                   mon stock
    pleased with the solid sales and profit           by $134 million
    gains posted by our combined North
                                                                                                     At year end, the Company's cash and
    American retail store business and direct-         Looking beyond these highlights, 2005
                                                                                                 short-term investment position, net of
    to-customers operations. Our Champs             was also a year in which we met a key tar-
                                                                                                 long-term debt and capital leases, stood
    Sports and recently-acquired Footaction         geted performance metric. We are pleased
                                                                                                 at $261 million, reflecting our strong
    businesses were our star performers for         that we exceeded our $350 sales per aver-
                                                                                                 financial position and balance sheet.
    the year, while our Footlocker.com/             age gross square foot objective -- a goal
    Eastbay direct-to-customers business            that we established earlier this decade.
    posted our highest division profit margin       The improvement in this performance
    rate.                                           metric provides evidence that the strate-


2
Gross Square Footage
Store Summary                                                                                                        2005           2006
                                 January 29,                          January 28,    Remodeled/       Average        Total      Targeted
                                       2005       Opened       Closed       2006       Relocated         Size                  Openings
                                                                                                                 (thousands)
Foot Locker                            1,428            45         75       1,398            124        4,000        5,626           50
Footaction                               349            24         10         363             40        4,700        1,718           20
Lady Foot Locker                         567             8         21         554             19        2,200        1,241           25
Kids Foot Locker                         346             1         20         327             39        2,400          791           20
Foot Locker International                707            30         14         723             38        2,900        2,062           35
Champs Sports                            570            11         25         556             56        5,500        3,045           25
Total                                  3,967          119        165        3,921            316        3,700      14,483           175


Positioned To Win                              generate a rate of return well in excess of   Game Plan -- Expanding Our Reach
                                               our cost of capital.                          Looking to the future, we believe we have
As we move forward, we have a number of
                                                   We continually seek new opportunities     many opportunities to accelerate our
growth priorities underway that we are
                                               to grow our Company profitably, while         growth by expanding the reach of our
confident will position our Company for
                                               prudently maintaining a conservative --       business into both new and existing mar-
continued market leadership, strong
                                               yet efficient -- capital structure designed   kets. We expect that these opportunities
financial performance and delivery of
                                               to minimize our cost of capital. Reducing     will include the continued implementa-
greater value to our shareholders.
                                               our financial liabilities and strengthening   tion of the growth strategy that we have
    The Company's first growth priority is
                                               our balance sheet are important consider-     been successfully executing for several
to fund capital projects designed to
                                               ations as we strive to attain an invest-      years, as well as the development of new
enhance our existing business. During
                                               ment-grade credit rating. With this prior-    initiatives that will allow us to reach a
2005, the Company spent approximately
                                               ity in mind, during 2005 we repaid $35        larger and more diverse customer base.
80 percent of its $163 million capital
                                               million of long-term debt and contributed         An integral part of this growth strate-
expenditures on store maintenance,
                                               $26 million to our pension plans.             gy is our real estate program, first
remodels and relocations, as well as
                                                   Our Board of Directors is also commit-    embarked upon in 2001, and geared at
enhancements to our infrastructure and
                                               ed to enhancing shareholder value             opening 1,000 new stores over several
sales support systems. The remaining 20
                                               through both capital appreciation and         years. In line with this strategy, we
percent of the Company's 2005 capital
                                               dividends. Thus, in November 2005, the        opened or acquired 961 new stores over
expenditure program was allocated to
                                               Board of Directors increased the cash div-    the past five years, while also closing 622
opening new retail stores. During the year
                                               idend on Foot Locker, Inc.'s common           underperforming stores. During this time,
we completed 600 real estate projects,
                                               stock by 20 percent, to an annualized         we also expanded our store base into six
opening 119 new stores, remodeling and
                                               amount of $0.36 per share, reflecting         new countries, including Greece and
relocating 316 stores, and closing 165
                                               confidence in the ability of management       Switzerland this past year.
stores.
                                               to continue to increase the Company's             As we look toward 2006, we have
    Acquiring     compatible      athletic
                                               profitability. During the second quarter of   increased our capital expenditure plan to
footwear and apparel retail companies is
                                               2005, we began to implement a share           $190 million. This will enable us to accel-
another growth priority for our Company.
                                               repurchase program, with 1.6 million          erate our store openings to approximate-
During the prior year, we explored sever-
                                               shares purchased for the full year at a       ly 175 new stores and to expand our
al potential acquisition opportunities
                                               cost of $35 million. Additionally, the        reach by testing new markets. We esti-
that we believe could be a strategic fit
                                               Board of Directors authorized in February     mate that 80 percent of the new stores
with our Company. We plan to continue to
                                               2006 a new three-year $150 million share      will be located in the United States and
pursue carefully acquisition opportuni-
                                               repurchase program that may be imple-         20 percent in international markets.
ties, maintaining a patient posture to
                                               mented based upon market prices and           During 2006, we also plan to close
ensure that potential investments are
                                               other factors.                                approximately 110 underperforming
accretive to our earnings per share and


                                                                                                                                           3
Looking to the future, we believe that we have many oppor-
    tunities to accelerate our growth by expanding the reach of
    our business into both new and existing markets.


                                                                                                    We believe that our Company also has
    stores. Therefore, we expect our athletic     vide many competitive advantages that
                                                                                                the distinct advantage of benefitting
    store base to increase by 1-to-2 percent      benefit our Company today and provide
                                                                                                from the strategic direction and counsel
    in 2006 and, at year end, we will be oper-    an edge as we strive to grow our Company
                                                                                                of a Board of Directors comprising indi-
    ating more stores in each of our formats      profitably and deliver greater value to our
                                                                                                viduals with truly exceptional talents.
    compared to the beginning of the year.        shareholders.
                                                                                                Their guidance over the past several years
        Another strategy to expand our reach          Building a winning culture that has as
                                                                                                has contributed significantly to our suc-
    is through an arrangement that we             its core a passion for high performance is
                                                                                                cess.
    recently negotiated with a well-estab-        of paramount importance to our
                                                                                                    Finally, we would like to thank our
    lished third party franchisee to open Foot    Company. Today, our associates are fully
                                                                                                suppliers, landlords and other business
    Locker franchises in several countries in     engaged in our business, focused on their
                                                                                                partners who assist us in providing excep-
    the Middle East, a region where we do not     key responsibilities and encouraged to
                                                                                                tional goods and services to our valued
    currently operate stores. We are working      develop new ideas to benefit our organi-
                                                                                                customers.
    together with the franchisee towards a        zation. It is through the hard work of our
                                                                                                    We are confident and optimistic
    goal of opening six new franchised stores     associates -- the Company's most impor-
                                                                                                regarding the future of Foot Locker, Inc.
    in 2006 and a total of 75 new stores in       tant asset -- that we have successfully
                                                                                                Several important growth opportunities
    this region over the next four years.         increased shareholder value over the
                                                                                                have been identified that, when imple-
        Finally, we continue to seek ways to      years.
                                                                                                mented, we believe will benefit both our
    increase sales and profits by leveraging          Of course, our focus on strong per-
                                                                                                near term and longer term financial
    our Footlocker.com/Eastbay infrastruc-        formance across all aspects of our busi-
                                                                                                results. Our organization is strong, our
    ture. During 2006, we plan to expand our      ness also extends to our commitment to
                                                                                                financial position is solid, our infrastruc-
    reach through our direct-to-customers         good corporate citizenship. In particular,
                                                                                                ture is well equipped, and we look for-
    channels by developing a new Internet         we are very proud of the manner in which
                                                                                                ward with great enthusiasm to our excit-
    website and catalog selling men's and         our organization stepped up to the plate
                                                                                                ing future and bright prospects.
    women's leather dress shoes.                  this year to raise funds for several worthy
                                                  organizations, including the United Negro
    Home Court Advantages                         College Fund, the United Way and the
                                                  American Cancer Society. Additionally,        Sincerely,
    Today, Foot Locker, Inc. maintains a lead-
                                                  Foot Locker, Inc. donated more than
    ership position in the worldwide special-
                                                  80,000 pairs of athletic shoes to Save the
    ty athletic footwear and apparel retail
                                                  Children, primarily to provide aid to the
    industry with almost 4,000 stores in 20
                                                  victims of the tsunami disaster in Asia.
    countries. We also operate a highly-prof-
                                                  Our associates worldwide also made gen-       Matthew D. Serra
    itable direct-to-customers business that
                                                  erous contributions to assist their fellow    Chairman of the Board, President
    sells athletic footwear, apparel and
                                                  associates and families who were              and Chief Executive Officer
    equipment through catalogs and the
                                                  adversely affected by hurricanes Katrina,
    Internet -- channels that complement our
                                                  Rita and Wilma.
    retail stores. Our well-known brands, mar-
    ket share position and diversification pro-
4
BUSINESS OVERVIEW                                          Global diversification is a vital component of the Company's strategic positioning.
                                                           This diversification is unique in the athletic Footwear and apparel retail industry
                                                           and provides many distinct advantages. Foot Locker, Inc. has established a strong
                                                           presence in several global markets within North America, Europe and Australia.


                                 501 European Stores


                                                                                4 Guam Stores
                                                                                                21 Hawaii Stores
   164
 Canadian                                                              80
  Stores                                                           Australian
                                                                     Stores
                                                                                      14 New Zealand Stores
   3,058
 U.S. Stores   70 Puerto Rico Stores
               9 Virgin Islands Stores


                               Primary Customer        Merchandise Mix                                # of Stores   Average Store Size


                                                       Men’s, Women’s and Children’s
                                                       Athletic Footwear                                                    4,000 Gross
                               12 to 20 Year Old       Men’s Athletic Apparel and Accessories               1,398           Square Feet

                                                       Men's, Women's and Children's
                                                       Athletic Footwear                                                    4,700 Gross
                               15 to 30 Year Old       Men’s Athletic Apparel and Accessories                 363           Square Feet


                               14 to 35 Year Old       Women’s Athletic Footwear, Apparel                                   2,200 Gross
                               Female                  and Accessories                                        554           Square Feet


                                                       Children’s Athletic Footwear, Apparel                                2,400 Gross
                               5 to 11 Year Old        and Accessories                                        327           Square Feet


                                                       Men’s, Women’s and Children’s
                                                       Athletic Footwear                                                    2,900 Gross
                               12 to 20 Year Old       Men’s Athletic Apparel and Accessories                 723           Square Feet


                                                       Men’s, Women’s and Children’s
                                                       Athletic Footwear
                                                       Men’s Athletic Apparel and Accessories                               5,500 Gross
                               12 to 25 Year Old       Athletic Equipment                                     556           Square Feet


                                                       Men’s, Women’s and Children’s
                               12 to 35 Year Old       Athletic Footwear, Apparel and Equipment
                                                                                                                                           5
The Company's largest business, Foot Locker, which was        reaching double digits for the first time in its history.
    first introduced by the Company in 1974, today is the            For the past several years, Europe has represented the
    world's largest athletic footwear and apparel retailer. At    most exciting region in which the Company has pursued
    year-end, Foot Locker operated a total of 2,121 stores        store growth. Foot Locker continued to implement suc-
    around the globe in 20 countries, with 1,398 stores locat-    cessfully a store expansion strategy in Europe during
    ed in the United States, 501 stores in Europe, 128 stores     2005, opening 22 new stores in countries where the
    in Canada and 94 stores in the Asia/Pacific region. Its       Company already operates, as well as testing two new
    stores average 3,600 gross square feet and target a 12-       markets -- Greece and Switzerland. The operating results
    to-20 year old male customer base that is influenced by       for Foot Locker Europe in 2005 were disappointing, as a
    competitive sports and urban trends.                          combination of weak economic factors, coupled with a
        In the North American market, Foot Locker is actively     more competitive marketplace, led to a contraction of its
    implementing several strategies with a goal of driving        division profit margin rate, which was, however, still in the
    comparable-store sales growth and reducing its operat-        low double digit range.
    ing costs as a percentage of sales. These strategies             The Company also sees an opportunity for store
    include enhancing the portfolio of its store fleet by open-   growth in the Asia/Pacific region. In the near-term, new
    ing new stores in markets with high sales potential, clos-    store openings will be concentrated in the Australian and
    ing stores that are losing money and updating the             New Zealand markets, which are regions where the
    appearance of stores through a remodeling and reloca-         Company already operates profitably. Store growth into
    tion program. Of the North American Foot Locker stores        new markets in this region is expected in the future, once
    2005 financial results, the profit increase of Foot Locker    the Company is confident that a profitable business
    Canada was most notable, with its division profit margin      model has been developed.


    Foot Locker is actively implementing several strategies
    with a goal of driving sales growth and reducing its
    operating costs as a percentage of sales.


6
7
In terms of number of stores, annual sales volume and,         prior year. In fact, the Champs Sports division sales and
    most importantly, profitability, Champs Sports is the          profits reached record levels last year, with a division prof-
    Company's second largest division in North America.            it margin rate in the high single digit range. Additional
    Champs Sports stores are primarily mall-based and offer        quantities of high priced marquee athletic footwear and
    for sale athletic footwear, apparel and equipment through      more fashion-right assortment of private-label and brand-
    a total of 556 specialty stores, of which 520 are located in   ed apparel offerings contributed to the strong sales
    the United States and 36 in Canada. The typical Champs         growth.
    Sports store averages 5,500 gross square feet, with mer-          The Company is encouraged that Champs Sports store
    chandise that targets a suburban consumer who is 12 to         locations and product offerings are well positioned in the
    25 years old and is both performance and fashion-con-          athletic marketplace and expects the division to post solid
    scious.                                                        increases in sales and profit in 2006. Given the renewed
       Champs Sports had an outstanding year in 2005, gen-         strength of this division, additional store growth is
    erating a low double digit comparable-store sales              planned, primarily in shopping malls located in suburban
    increase and a significant profit improvement over the         markets in the United States.


    The Company is encouraged that Champs Sports store locations
    and product offerings are well positioned in the athletic market-
    place and expects the division to post solid increases in sales
    and profits in 2006.


8
The Company purchased 349 Footaction stores from                offerings. Today, store associates are better trained to serv-
Footstar, Inc. in May 2004 to expand its reach into urban       ice its customers and products are current, fashion-right
markets in the United States. Footaction's target customer      and well positioned for 2006.
is a 15 to 30 year old male who is influenced by the “street”      As expected, Footaction made a meaningful sales and
and “hip-hop” culture. The benefits gained by the               profit contribution to the Company's financial results in
Company from acquiring Footaction include providing an          2005. Its division profit margin increased to the mid-single
excellent complementary fit with its other athletic formats     digit range from a loss in the prior year. The Company
and expanding the demographic characteristics of the            expects that the division profit of Footaction will continue
Company's customer base.                                        to be enhanced in the coming year and that its division mar-
    Footaction stores, which average 4,700 gross square         gin rate will ultimately reach or exceed that of Foot Locker
feet, are conveniently located to their primary customers       U.S. Given its initial success and expected improvements,
and are properly sized to allow an attractive display of a      the Company is currently pursuing additional store growth
broad array of product choices. During 2005, a key focus of     for this chain.
the management team of Footaction was to improve cus-
tomer service levels and enhance the store's merchandise


Given Footaction's success and expected improvements,
the Company is currently pursuing additional store growth
for this chain.


                                                                                                                                 9
Kids Foot Locker is the market leader in selling children's athlet-   implementation of several key strategies, including closing
     ic footwear and apparel, targeting a mother of a 5 to 11 year old     underperforming stores. In 2005, Kids Foot Locker produced
     child. This business, which was developed in 1987 to extend the       another solid comparable-store sales gain and achieved record
     reach of Foot Locker and to appeal to a young consumer, cur-          division profit results. With the overall store base currently
     rently operates 327 stores in the United States that average          operating at a much-improved division margin, the Company
     2,400 gross square feet.                                              plans to pursue renewed store growth for this division.
         During the past three years, the Company has significantly
     increased the profitability of Kids Foot Locker through the


     Lady Foot Locker operates 554 stores in the United States that        Foot Locker built on the early success of this strategy by further
     average 2,200 gross square feet. This business was developed by       developing its private-label apparel program and by working
     the Company in 1982, with a focus on providing a “women-friend-       closely with its suppliers to provide more fashionable branded
     ly” shopping experience by offering athletically-inspired footwear    footwear products that would appeal to a more diverse customer
     and apparel in a comfortable environment. Today, Lady Foot            base. These strategies contributed to solid comparable-store sales
     Locker is uniquely positioned in the marketplace as a destination     gains and a significant increase in division profit last year.
     location for the active 14 to 35 year old female shopper.             Looking ahead, the Company believes that Lady Foot Locker will
         Two years ago Lady Foot Locker embarked on a strategy             continue to benefit from these programs.
     designed to enhance its branded and private-label apparel offer-
     ings to have greater appeal to its target customer. In 2005, Lady


     Kids Foot Locker and Lady Foot Locker continue to produce
     improving financial results.


10
Footlocker.com, the Company's direct-to-customers business, is         Amazon.com, United States Olympic Committee, ESPN and several
the world's leading retailer that sells athletic footwear, apparel     of the Company's key suppliers.
and equipment via catalogs and E-commerce websites. This busi-             Today, Footlocker.com is a well-run business with its catalog
ness includes the well-known Eastbay brand, which the Company          and Internet operations integrated within a single, highly effi-
acquired almost 10 years ago as a means to expand its customer         cient infrastructure, including a distribution center with sufficient
base by selling athletic footwear, apparel and equipment through       capacity to support management's near-term growth plans. This
a well-managed catalog operation.                                      business is complementary to the Company's retail stores due to
    During the past several years, the business has expanded rapid-    its appeal to a wider customer base by offering a greater assort-
ly, primarily by developing E-commerce websites capitalizing on the    ment of styles and sizes, and more technically oriented sporting
Company's highly-recognizable brand names. Another strategy that       goods with the convenience of shopping from home.
has contributed to this division's success entails arrangements with       In 2005, Footlocker.com produced very solid financial results
well-known third parties, whereby Footlocker.com provides the          with sales increasing 4.1 percent versus last year, to $381 million.
development, merchandising, fulfillment and customer service to        The division profit of Footlocker.com increased 6.7 percent versus
support catalog and E-commerce sales. These third parties include      last year to $48 million, maintaining a solid 12.6 percent of sales.
the National Basketball Association, Arena Football League,


Footlocker.com is the world's leading retailer that sells athletic footwear,
apparel and equipment via catalogs and E-commerce websites.


                                                                                                                                               11
FOOT LOCKER, INC.
     Community Involvement                              the United States. The Company also stepped
                                                        up its charitable efforts this past year in
     Throughout its history, Foot Locker, Inc. has
                                                        response to the devastating hurricanes in the
     recognized the importance of supporting the
                                                        United States, including administering associ-
     communities around the world in which it
                                                        ates' personal contributions that were directed
     operates. For this reason, the Company estab-
                                                        to the victims and their families.
     lished Foot Locker Foundation, Inc. in 2001 to
                                                            The support of the American Cancer Society
     enhance its ability to raise funds and increase
                                                        by participating in its Annual “Making Strides
     its ability to contribute to worthy causes.
                                                        Against Breast Cancer” walk and raising funds
     Since its inception, Foot Locker Foundation,
                                                        through the sale of Pink Ribbon tee shirts and
     Inc. has hosted its annual “On Our Feet”
                                                        jewelry are ongoing programs in which the
     fundraising event to benefit various charitable
                                                        Company and its associates have contributed
     organizations such as the United Negro College
                                                        for several years. The Fred Jordan Mission, a
     Fund, the United Way of New York City and
                                                        faith-based mission founded in 1944 in Los
     Reading Is Fundamental.
                                                        Angeles, California, is another organization
         2005 was a year in which Foot Locker, Inc.
                                                        that the Company supports each year by
     furthered its commitment to community
                                                        donating shoes and school supplies to thou-
     involvement by supporting victims of natural
                                                        sands of children in the inner city.
     disasters. This past spring, the Company took
                                                            Going forward, the Company expects to
     part in the relief efforts of the tsunami disas-
                                                        continue to be an active supporter of worth-
     ter in South Asia, donating a total of 82,500
                                                        while causes and organizations. It is with a
     pairs of athletic footwear to Save the Children,
                                                        sense of pride that Foot Locker, Inc. seeks to
     which provides relief aid to children in need
                                                        improve the quality of life through ongoing
     around the world. In addition, 14,000 pairs of
                                                        community involvement programs.
     footwear were donated to needy children who
     participated in Save the Children programs in


     It is with a sense of pride that Foot Locker, Inc.
     seeks to improve the quality of life through
     ongoing community involvement programs.


12
UNITED STATES
                                  SECURITIES AND EXCHANGE COMMISSION
                                                            Washington, D.C. 20549


                                                               FORM 10-K
                                         Annual Report Pursuant to Section 13 or 15(d)
                                             of the Securities Exchange Act of 1934
                                           For the fiscal year ended January 28, 2006
                                                Commission file number 1-10299

                                                   FOOT LOCKER, INC.
                                              (Exact name of Registrant as specified in its charter)
                              New York                                                                   13-3513936
                      (State or other jurisdiction of                                           (I.R.S. Employer Identification No.)
                     incorporation or organization)
         112 West 34th Street, New York, New York                                                            10120
                 (Address of principal executive offices)                                                   (Zip Code)
                                     Registrant’s telephone number, including area code:
                                                       (212) 720-3700
                                 Securities registered pursuant to Section 12(b) of the Act:
                          Title of each class                                             Name of each exchange on which registered
               Common Stock, par value $0.01                                   New York Stock Exchange
                           Securities registered pursuant to Section 12(g) of the Act:
                                                          None
     Indicate by check mark if the registrant is a well-known seasoned issuer, as defined in Rule 405 of the Securities
Act. Yes H No h
      Indicate by check mark if the registrant is not required to file reports pursuant to Section 13 or Section 15(d) of the
Act. Yes h No H
      Indicate by check mark whether the Registrant (1) has filed all reports required to be filed by Section 13 or 15(d) of the
Securities Exchange Act of 1934 during the preceding 12 months (or for such shorter period that the Registrant was required
to file such reports), and (2) has been subject to such filing requirements for the past 90 days. Yes H No h
      Indicate by check mark if disclosure of delinquent filers pursuant to Item 405 of Regulation S-K is not contained
herein, and will not be contained, to the best of Registrant’s knowledge, in definitive proxy or information statements
incorporated by reference in Part III of this Form 10-K or any amendment to this Form 10-K. H
      Indicate by check mark whether the registrant is a large accelerated filer, an accelerated filer, or a non-accelerated
filer. See definition of “accelerated filer and large accelerated filer” in Rule 12b-2 of the Exchange Act.
Large accelerated filer H Accelerated filer h Non-accelerated filer h
      Indicate by check mark whether the registrant is a shell company (as defined in Rule 12b-2 of the Act. Yes h No H
See pages 59 through 62 for Index of Exhibits.
      Number of shares of Common Stock outstanding at March 17, 2006:                                           155,487,431
      The aggregate market value of voting stock held by non-affiliates of the Registrant
      computed by reference to the closing price as of the last business day of the Registrant’s
      most recently completed second fiscal quarter, July 29, 2005, was approximately:                       $2,851,036,844*
* For purposes of this calculation only (a) all directors plus one executive officer and owners of five percent or more
      of the Registrant are deemed to be affiliates of the Registrant and (b) shares deemed to be “held” by such persons
      at July 29, 2005 include only outstanding shares of the Registrant’s voting stock with respect to which such persons
      had, on such date, voting or investment power.
                                     DOCUMENTS INCORPORATED BY REFERENCE
    Portions of the Registrant’s definitive Proxy Statement (the “Proxy Statement”) to be filed in connection with the
Annual Meeting of Shareholders to be held on May 24, 2006: Parts III and IV.
TABLE OF CONTENTS

PART I


Item 1     Business . . . . . . . . . . . . . . . . . . . . . . . . . . . . . . . . . . . . . . . . . . . . . . . . . . . . . . . . . . . .    1
Item 1A    Risk Factors . . . . . . . . . . . . . . . . . . . . . . . . . . . . . . . . . . . . . . . . . . . . . . . . . . . . . . . . .      2
Item 1B    Unresolved Staff Comments . . . . . . . . . . . . . . . . . . . . . . . . . . . . . . . . . . . . . . . . . . . . . .                4
Item 2     Properties . . . . . . . . . . . . . . . . . . . . . . . . . . . . . . . . . . . . . . . . . . . . . . . . . . . . . . . . . . .    4
Item 3     Legal Proceedings . . . . . . . . . . . . . . . . . . . . . . . . . . . . . . . . . . . . . . . . . . . . . . . . . . . . .          4
Item 4     Submission of Matters to a Vote of Security Holders . . . . . . . . . . . . . . . . . . . . . . . . . . . . .                        4


PART II


Item 5     Market for the Company’s Common Equity and Related Stockholder Matters and Issuer
           Purchases of Equity Securities. . . . . . . . . . . . . . . . . . . . . . . . . . . . . . . . . . . . . . . . . . . . .              6
Item 6     Selected Financial Data . . . . . . . . . . . . . . . . . . . . . . . . . . . . . . . . . . . . . . . . . . . . . . . . .            6
Item 7     Management’s Discussion and Analysis of Financial Condition and Results of Operations . . .                                          6
Item 7A    Quantitative and Qualitative Disclosures about Market Risk . . . . . . . . . . . . . . . . . . . . . . . .                          19
Item 8     Consolidated Financial Statements and Supplementary Data. . . . . . . . . . . . . . . . . . . . . . . .                             20
Item 9     Changes in and Disagreements with Accountants on Accounting and Financial Disclosure . . .                                          56
Item 9A    Controls and Procedures . . . . . . . . . . . . . . . . . . . . . . . . . . . . . . . . . . . . . . . . . . . . . . . . .           56


PART III


Item 10    Directors and Executive Officers of the Company. . . . . . . . . . . . . . . . . . . . . . . . . . . . . . . .                      56
Item 11    Executive Compensation . . . . . . . . . . . . . . . . . . . . . . . . . . . . . . . . . . . . . . . . . . . . . . . . .            57
Item 12    Security Ownership of Certain Beneficial Owners and Management and Related Stockholder
           Matters . . . . . . . . . . . . . . . . . . . . . . . . . . . . . . . . . . . . . . . . . . . . . . . . . . . . . . . . . . . . .   57
Item 13    Certain Relationships and Related Transactions . . . . . . . . . . . . . . . . . . . . . . . . . . . . . . . .                      57
Item 14    Principal Accountant Fees and Services . . . . . . . . . . . . . . . . . . . . . . . . . . . . . . . . . . . . . .                  57


PART IV


Item 15    Exhibits and Financial Statement Schedules . . . . . . . . . . . . . . . . . . . . . . . . . . . . . . . . . . .                    57
PART I

Item 1. Business

General
     Foot Locker, Inc., incorporated under the laws of the State of New York in 1989, is a leading global retailer of athletic
footwear and apparel, operating as of January 28, 2006, 3,921 primarily mall-based stores in the United States, Canada,
Europe and Asia Pacific, which includes Australia and New Zealand. Foot Locker, Inc. and its subsidiaries hereafter are
referred to as the “Registrant” or “Company.” Information regarding the business is contained under the “Business
Overview” section in “Item 7. Management’s Discussion and Analysis of Financial Condition and Results of Operations.”

     The Company maintains a website on the Internet at www.footlocker-inc.com. The Company’s filings with the
Securities and Exchange Commission, including its annual reports on Form 10-K, quarterly reports on Form 10-Q, current
reports on Form 8-K, and all amendments to those reports are available free of charge through this website as soon as
reasonably practicable after they are filed with or furnished to the SEC by clicking on the “SEC Filings” link. The Corporate
Governance section of the Company’s corporate website contains the Company’s Corporate Governance Guidelines,
Committee Charters and the Company’s Code of Business Conduct for directors, officers and employees, including the Chief
Executive Officer, Chief Financial Officer and Chief Accounting Officer. Copies of these documents may also be obtained
free of charge upon written request to the Company’s Corporate Secretary at 112 West 34th Street, New York, NY 10120.
The Company intends to disclose promptly amendments to the Code of Business Conduct and waivers of the Code for
directors and executive officers on the corporate governance section of the Company’s corporate website.
    The Certification of the Chief Executive Officer required by Section 303A.12(a) of The New York Stock Exchange Listing
Standards relating to the Company’s compliance with The New York Stock Exchange Corporate Governance Listing
Standards was submitted to The New York Stock Exchange on June 15, 2005.

Information Regarding Business Segments and Geographic Areas
     The financial information concerning business segments, divisions and geographic areas is contained under the
“Business Overview” and “Segment Information” sections in “Item 7. Management’s Discussion and Analysis of Financial
Condition and Results of Operations.” Information regarding sales, operating results and identifiable assets of the
Company by business segment and by geographic area is contained under the “Segment Information” footnote in “Item
8. Consolidated Financial Statements and Supplementary Data.”
      The service marks and trademarks appearing on this page and elsewhere in this report (except for ESPN, NBA, Nike,
Amazon.com, Burger King, Popeye’s, The San Francisco Music Box Company and USOC) are owned by Foot Locker, Inc. or
its subsidiaries.

Employees
    The Company and its consolidated subsidiaries had 16,403 full-time and 27,873 part-time employees at January 28,
2006. The Company considers employee relations to be satisfactory.

Competition
     The financial information concerning competition is contained under the “Business Risk” section in the “Financial
Instruments and Risk Management” footnote in “Item 8. Consolidated Financial Statements and Supplementary Data.”

Merchandise Purchases
     The financial information concerning merchandise purchases is contained under the “Liquidity” section in “Item 7.
Management’s Discussion and Analysis of Financial Condition and Results of Operations” and under the “Business Risk”
section in the “Financial Instruments and Risk Management” footnote in “Item 8. Consolidated Financial Statements and
Supplementary Data.”


                                                              1
Item 1A. Risk Factors
     The statements contained in this Annual Report on Form 10-K and incorporated by reference (“Annual Report”) that
are not historical facts, including, but not limited to, statements regarding our expected financial position, business and
financing plans found in “Item 1. Business” and “Item 7. Management’s Discussion and Analysis of Financial Condition
and Results of Operations,” constitute “forward-looking statements” within the meaning of the Private Securities
Litigation Reform Act of 1995. The words “may,” “believes,” “expects,” “plans,” “intends,” “anticipates” and similar
expressions identify forward-looking statements. The actual results of the future events described in such forward-looking
statements could differ materially from those stated in such forward-looking statements.
     Our actual results may differ materially due to the risks and uncertainties discussed in this Annual Report, including
those discussed below. Accordingly, readers of the Annual Report should consider these facts in evaluating the information
and are cautioned not to place undue reliance on the forward-looking statements contained herein. We undertake no
obligation to update or revise publicly any forward-looking statements, whether as a result of new information, future
events or otherwise.

The industry in which we operate is dependent upon fashion trends, customer preferences and other fashion-
related factors.
      The athletic footwear and apparel industry is subject to changing fashion trends and customer preferences. We cannot
guarantee that our merchandise selection will accurately reflect customer preferences on the date of sale or that we will be
able to identify and respond quickly to fashion changes, particularly given the long lead times for ordering much of our
merchandise from vendors. For example, we order athletic footwear four to six months prior to delivery to our stores. If we
fail to accurately anticipate either the market for the merchandise in our stores or our customers’ purchasing habits, we may
be forced to rely on markdowns or promotional sales to dispose of excess, slow-moving inventory, which would have a
material adverse effect on our business, financial condition and results of operations.
      A substantial portion of our highest margin sales are to young males (ages 12–25), many of whom we believe purchase
athletic footwear and licensed apparel as a fashion statement and are frequent purchasers of athletic footwear. Any shift
in fashion trends that would make athletic footwear or licensed apparel less attractive to these customers would have
a material adverse effect on our business, financial condition and results of operations.

The businesses in which we operate are highly competitive.
     The retail athletic footwear and apparel business is highly competitive with relatively low barriers to entry. Our athletic
footwear and apparel operations compete primarily with athletic footwear specialty stores, sporting goods stores and
superstores, department stores, discount stores, traditional shoe stores and mass merchandisers, many of which are units
of national or regional chains that have significant financial and marketing resources. The principal competitive factors in
our markets are price, quality, selection of merchandise, reputation, store location, advertising and customer service. We
cannot assure you that we will continue to be able to compete successfully against existing or future competitors. Our
expansion into markets served by our competitors and entry of new competitors or expansion of existing competitors into
our markets could have a material adverse effect on our business, financial condition and results of operations.
     Although we sell merchandise via the Internet through Footlocker.com and its affiliates, a significant shift in
customer buying patterns to purchasing athletic footwear, athletic apparel and sporting goods via the Internet could have
a material adverse effect on us. In addition, some of the manufacturers of our products distribute products directly through
the Internet and others may follow. Should this occur and if our customers decide to purchase directly from our
manufacturers, it could have a material adverse effect on our business, financial condition and results of operations.

We depend on mall traffic and our ability to identify suitable store locations.
      Our sales, particularly in the United States and Canada, are dependent in part on a high volume of mall traffic. Our
stores are located primarily in enclosed regional and neighborhood malls. Mall traffic may be adversely affected by, among
other things, economic downturns, the closing of anchor department stores or changes in customer preferences or acts
of terrorism. A decline in the popularity of mall shopping among our target customers could have a material adverse effect
on us.
      To take advantage of customer traffic and the shopping preferences of our customers, we need to maintain or acquire
stores in desirable locations such as in regional and neighborhood malls anchored by major department stores. We cannot
assure you that desirable mall locations will continue to be available.
                                                               2
The effects of natural disasters, terrorism, acts of war and retail industry conditions may adversely affect
our business.
     Natural disasters, including hurricanes, floods and tornados may affect store and distribution center operations. In
addition, acts of terrorism, acts of war and military action both in the United States and abroad can have a significant
effect on economic conditions and may negatively affect our ability to purchase merchandise from vendors for sale to
our customers. Any significant declines in general economic conditions, public safety concerns or uncertainties regarding
future economic prospects that affect customer spending habits could have a material adverse effect on customer
purchases of our products.

A change in the relationship with any of our key vendors or the unavailability of our key products at
competitive prices could affect our financial health.
     Our business is dependent to a significant degree upon our ability to purchase brand-name merchandise at competitive
prices, including the receipt of volume discounts and cooperative advertising and other allowances from our vendors. The
Company purchased approximately 75 percent of its merchandise in 2005 from its top five vendors, and expects to continue
to obtain a significant percentage of its athletic product from these vendors in future periods. Of that amount approximately
49 percent was purchased from one vendor — Nike, Inc. (“Nike”). We have no long-term supply contracts with any of our
vendors. Our inability to obtain merchandise in a timely manner from major suppliers (particularly Nike) as a result of business
decisions by our suppliers or any disruption in the supply chain could have a material adverse effect on our business, financial
condition and results of operations. Because of our strong dependence on Nike, any adverse development in Nike’s financial
condition and results of operations or the inability of Nike to develop and manufacture products that appeal to our target
customers could also have an adverse effect on our business, financial condition and results of operations. We cannot assure
you that we will be able to acquire merchandise at competitive prices or on competitive terms in the future.
     Merchandise that is high profile and in high demand is allocated by our vendors based upon their internal criteria.
Although we have generally been able to purchase sufficient quantities of this merchandise in the past, we cannot assure
you that our vendors will continue to allocate sufficient amounts of such merchandise in the future. In addition, our
vendors provide support to us through cooperative advertising allowances and promotional events. We cannot assure you
that such assistance from our vendors will continue in the future. These risks could have a material adverse effect on our
business, financial conditions and results of operations.

We may experience fluctuations in and cyclicality of our comparable store sales results.
     Our comparable store sales have fluctuated significantly in the past, on both an annual and a quarterly basis, and
we expect them to continue to fluctuate in the future. A variety of factors affect our comparable store sales results,
including, among others, fashion trends, the highly competitive retail store sales environment, economic conditions,
timing of promotional events, changes in our merchandise mix, calendar shifts of holiday periods and weather conditions.
     Many of our products, particularly high-end athletic footwear and licensed apparel, represent discretionary
purchases. Accordingly, customer demand for these products could decline in a recession or if our customers develop other
priorities for their discretionary spending. These risks could have a material adverse effect on our business, financial
condition and results of operations.

Our operations may be adversely affected by economic or political conditions in other countries.
      Approximately 25 percent of our sales and a significant portion of our operating profits for 2005 were attributable to
our sales in Europe, Canada, New Zealand and Australia. As a result, our business is subject to the risks generally associated
with doing business outside of the United States, such as foreign governmental regulations, foreign customer preferences,
political unrest, disruptions or delays in shipments and changes in economic conditions in countries in which we operate.
Although we enter into forward foreign exchange contracts and option contracts to reduce the effect of foreign currency
exchange rate fluctuations, our operations may be adversely affected by significant changes in the value of the U.S. dollar
as it relates to certain foreign currencies.
     In addition, because we and our suppliers have a substantial amount of our products manufactured in foreign
countries, our ability to obtain sufficient quantities of merchandise on favorable terms may be affected by governmental
regulations, trade restrictions and economic, labor and other conditions in the countries from which our suppliers obtain
their product.

                                                               3
Our business is subject to economic cycles and retail industry conditions. Purchases of discretionary athletic
footwear, apparel and related products, tend to decline during recessionary periods when disposable income is low and
customers are hesitant to use available credit.

Complications in our distribution centers may affect our business.
      We operate three distribution centers worldwide to support our athletic business. If complications arise with any one
facility or any facility is severely damaged or destroyed, the other distribution centers may not be able to support the
resulting additional distribution demands. This may adversely affect our ability to deliver inventory on a timely basis.

A major failure of our information systems could harm our business.
     We depend on information systems to process transactions, manage inventory, operate our website, purchase, sell
and ship goods on a timely basis and maintain cost-efficient operations. Any material disruption or slowdown of our
systems could cause information to be lost or delayed which could have a negative impact on our business. We may
experience operational problems with our information systems as a result of system failures, viruses, computer “hackers”
or other causes. We cannot assure that our systems will be adequate to support future growth.

Item 1B. Unresolved Staff Comments
     None.

Item 2. Properties
    The properties of the Company and its consolidated subsidiaries consist of land, leased and owned stores and
administrative and distribution facilities. Gross operating square footage and total selling area for the Athletic Stores
segment at the end of 2005 was approximately 14.48 and 8.71 million square feet, respectively. These properties are
primarily located in the United States, Canada, various European countries, Australia and New Zealand.
     The Company currently operates three distribution centers, of which one is owned and two are leased, occupying an
aggregate of 2.12 million square feet. Two of the three distribution centers are located in the United States and one is
in Europe.

Item 3. Legal Proceedings
      Legal proceedings pending against the Company or its consolidated subsidiaries consist of ordinary, routine
litigation, including administrative proceedings, incidental to the business of the Company, as well as litigation incidental
to the sale and disposition of businesses that have occurred in past years. These legal proceedings include commercial,
intellectual property, customer, and labor-and-employment-related claims, including class action lawsuits in which
plaintiffs allege violations by the Company of state wage and hour and other laws. Management does not believe that
the outcome of such proceedings would have a material adverse effect on the Company’s consolidated financial position,
liquidity, or results of operations, taken as a whole.

Item 4. Submission of Matters to a Vote of Security Holders
     There were no matters submitted to a vote of security holders during the fourth quarter of the year ended January 28, 2006.


                                                               4
Executive Officers of the Company
     Information with respect to Executive Officers of the Company, as of March 27, 2006, is set forth below:
     Chairman of the Board, President and Chief Executive Officer                     Matthew D. Serra
     President and Chief Executive Officer, Foot Locker, Inc. — U.S.A.                Richard T. Mina
     Senior Vice President, General Counsel and Secretary                             Gary M. Bahler
     Senior Vice President — Real Estate                                              Jeffrey L. Berk
     Senior Vice President and Chief Information Officer                              Marc D. Katz
     Senior Vice President and Chief Financial Officer                                Robert W. McHugh
     Senior Vice President — Strategic Planning                                       Lauren B. Peters
     Senior Vice President — Human Resources                                          Laurie J. Petrucci
     Vice President — Investor Relations and Treasurer                                Peter D. Brown
     Vice President and Chief Accounting Officer                                      Giovanna Cipriano
     Matthew D. Serra, age 61, has served as Chairman of the Board since February 1, 2004, President since April 12, 2000
and Chief Executive Officer since March 4, 2001. Mr. Serra served as Chief Operating Officer from February 2000 to March 3,
2001 and as President and Chief Executive Officer of Foot Locker Worldwide from September 1998 to February 2000.
     Richard T. Mina, age 49, has served as President and Chief Executive Officer of Foot Locker, Inc.- U.S.A. since
February 2, 2003. He served as President and Chief Executive Officer of Champs Sports, an operating division of the
Company, from April 1999 to February 1, 2003.
    Gary M. Bahler, age 54, has served as Senior Vice President since August 1998, General Counsel since February 1993
and Secretary since February 1990.
     Jeffrey L. Berk, age 50, has served as Senior Vice President — Real Estate since February 2000.
     Marc D. Katz, age 41, has served as Senior Vice President and Chief Information Officer since May 12, 2003. Mr. Katz
served as Vice President and Chief Information Officer from July 2002 to May 11, 2003. During the period of 1999 to 2002,
he served in the following capacities at the Financial Services Center of Foot Locker Corporate Services: Vice President
and Controller from July 2001 to April 2002 and Controller from December 1999 to July 2001.
     Robert W. McHugh, age 47, has served as Senior Vice President and Chief Financial Officer since November 21, 2005.
He served as Vice President and Chief Accounting Officer from January 2000 to November 20, 2005.
     Lauren B. Peters, age 44, has served as Senior Vice President — Strategic Planning since April 18, 2002. Ms. Peters
served as Vice President — Planning from January 2000 to April 17, 2002.
     Laurie J. Petrucci, age 47, has served as Senior Vice President — Human Resources since May 2001. Ms. Petrucci served
as Senior Vice President — Human Resources of the Foot Locker Worldwide division from March 2000 to May 2001.
     Peter D. Brown, age 51, has served as Vice President — Investor Relations and Treasurer since October 2001. Mr. Brown
served as Vice President — Investor Relations and Corporate Development from April 2001 to October 2001 and as Assistant
Treasurer — Investor Relations and Corporate Development from August 2000 to April 2001.
     Giovanna Cipriano, age 36, has served as Vice President and Chief Accounting Officer since November 21, 2005. She
served as as Divisional Vice President, Financial Controller from June 3, 2002 through November 20, 2005 and as Financial
Controller from April 2, 1999 through June 2, 2002.
     There are no family relationships among the executive officers or directors of the Company.


                                                            5
PART II

Item 5. Market for the Company’s Common Equity, Related Stockholder Matters and Issuer Purchases of
        Equity Securities
     Information regarding the Company’s market for stock exchange listings, common equity, quarterly high and low
prices and dividend policy are contained in the “Shareholder Information and Market Prices” footnote under “Item 8.
Consolidated Financial Statements and Supplementary Data.”
     This table provides information with respect to purchases by the Company of shares of its Common Stock during the
fourth quarter of 2005:
                                                                                                           Average       Total Number of      Approximate Dollar Value
                                                                                            Total Number    Price       Shares Purchased      of Shares that May Yet be
                                                                                              of Shares    Paid per     as Part of Publicly      Purchased Under the
                                                                                                                      Announced Program (1)          Program (1)
                                                                                              Purchased     Share
October 30, 2005 to November 26, 2005 . . . . . .                                             50,000       $21.975           50,000                $28,967,188
November 27, 2005 to December 31, 2005 . . . .                                               629,600        22.183          629,600                 15,000,972
January 1, 2006 to January 28, 2006 . . . . . . . . .                                             —             —                —                  15,000,972
Total . . . . . . . . . . . . . . . . . . . . . . . . . . . . . . . . . . . . . . . . . .    679,600       $22.167          679,600

(1) On November 20, 2002, the Company announced that the Board of Directors authorized the purchase of up to $50 million of the Company’s Common
    Stock; of which 1,589,800 shares have been purchased for approximately $35 million. This authorization terminated on February 3, 2006. On
    February 15, 2006, the Company announced that its Board of Directors authorized a new $150 million, 3-year repurchase program.

Item 6. Selected Financial Data
    Selected financial data is included as the “Five Year Summary of Selected Financial Data” footnote in “Item 8.
Consolidated Financial Statements and Supplementary Data.”

Item 7. Management’s Discussion and Analysis of Financial Condition and Results of Operations

Business Overview
     Foot Locker, Inc., through its subsidiaries, operates in two reportable segments — Athletic Stores and Direct-to-
Customers. The Athletic Stores segment is one of the largest athletic footwear and apparel retailers in the world, whose
formats include Foot Locker, Lady Foot Locker, Kids Foot Locker, Champs Sports and Footaction (beginning May 2004).
The Direct-to-Customers segment reflects Footlocker.com, Inc., which sells, through its affiliates, including Eastbay, Inc.,
to customers through catalogs and Internet websites.
     The Foot Locker brand is one of the most widely recognized names in the market segments in which the Company
operates, epitomizing high quality for the active lifestyle customer. This brand equity has aided the Company’s ability
to successfully develop and increase its portfolio of complementary retail store formats, specifically, Lady Foot Locker and
Kids Foot Locker, as well as Footlocker.com, Inc., its direct-to-customers business. Through various marketing channels,
including television campaigns and sponsorships of various sporting events, Foot Locker, Inc. reinforces its image with
a consistent message: namely, that it is the destination store for athletic footwear and apparel with a wide selection of
merchandise in a full-service environment.

Athletic Stores
     The Company operates 3,921 stores in the Athletic Stores segment. The following is a brief description of the Athletic
Stores segment’s operating businesses:
     Foot Locker — Foot Locker is a leading athletic footwear and apparel retailer. Its stores offer the latest in athletic-
inspired performance products, manufactured primarily by the leading athletic brands. Foot Locker offers products for a
wide variety of activities including running, basketball, hiking, tennis, aerobics, fitness, baseball, football and soccer.
Its 2,121 stores are located in 20 countries including 1,398 in the United States, Puerto Rico, the United States Virgin
Islands and Guam, 128 in Canada, 501 in Europe and a combined 94 in Australia and New Zealand. The domestic stores
have an average of 2,100 selling square feet and the international stores have an average of 1,500 selling square feet.

                                                                                                     6
Champs Sports — Champs Sports is one of the largest mall-based specialty athletic footwear and apparel retailers in
the United States. Its product categories include athletic footwear, apparel and accessories, and a focused assortment of
equipment. This combination allows Champs Sports to differentiate itself from other mall-based stores by presenting
complete product assortments in a select number of sporting activities. Its 556 stores are located throughout the United
States, Canada and the United States Virgin Islands. The Champs Sports stores have an average of 3,800 selling square feet.

     Footaction — Footaction is a national athletic footwear and apparel retailer that offers street-inspired fashion styles.
The primary customers are young urban males with the secondary customers being young urban women with diverse fashion
needs. Its 363 stores are located throughout the United States and Puerto Rico and focus on marquee allocated footwear
and branded apparel. The Footaction stores have an average of 2,900 selling square feet.

      Lady Foot Locker — Lady Foot Locker is a leading U.S. retailer of athletic footwear, apparel and accessories for women.
Its stores carry all major athletic footwear and apparel brands, as well as casual wear and an assortment of proprietary
merchandise designed for a variety of activities, including running, basketball, walking and fitness. Its 554 stores are located
in the United States, Puerto Rico and the United States Virgin Islands and have an average of 1,300 selling square feet.

     Kids Foot Locker — Kids Foot Locker is a national children’s athletic retailer that offers the largest selection of brand-
name athletic footwear, apparel and accessories for infants, boys and girls, primarily on an exclusive basis. Its stores
feature an entertaining environment geared to both parents and children. Its 327 stores are located in the United States,
Puerto Rico, and the United States Virgin Islands and have an average of 1,400 selling square feet.

Store Profile
                                                                                         At                                   At
                                                                                  January 29, 2005   Opened   Closed   January 28, 2006
     Foot Locker . . . . . . . . . . . . . . . . . . . . . . . . . . . . . . .        2,135            75       89         2,121
     Champs Sports . . . . . . . . . . . . . . . . . . . . . . . . . . . .              570            11       25           556
     Footaction . . . . . . . . . . . . . . . . . . . . . . . . . . . . . . . .         349            24       10           363
     Lady Foot Locker. . . . . . . . . . . . . . . . . . . . . . . . . .                567             8       21           554
     Kids Foot Locker . . . . . . . . . . . . . . . . . . . . . . . . . .               346             1       20           327
     Total Athletic Stores . . . . . . . . . . . . . . . . . . . . . .                3,967           119     165          3,921

Direct-to-Customers
     Footlocker.com — Footlocker.com, Inc., sells, through its affiliates, directly to customers through catalogs and its
Internet websites. Eastbay, Inc., one of its affiliates, is one of the largest direct marketers of athletic footwear, apparel,
equipment and team licensed private-label merchandise in the United States and provides the Company’s eight full-service
e-commerce sites access to an integrated fulfillment and distribution system. The Company has a strategic alliance to offer
footwear and apparel on the Amazon.com website and the Foot Locker brands are featured in the Amazon.com specialty
stores for apparel and accessories and sporting goods. The Company also has an arrangement with the NBA and
Amazon.com whereby Footlocker.com provides the fulfillment services for NBA licensed products sold over the Internet
at NBAstore.com and the NBA store on Amazon.com. In addition, the Company has a marketing agreement with the
U.S. Olympic Committee (USOC) providing the Company with the exclusive rights to sell USOC licensed products through
catalogs and via a new e-commerce site. The Company has an agreement with ESPN for ESPN Shop — an ESPN-branded
direct mail catalog and e-commerce site linked to www.ESPNshop.com, where fans can purchase athletic footwear, apparel
and equipment which will be managed by Footlocker.com. Both the catalog and the e-commerce site feature a variety
of ESPN-branded and non-ESPN-branded athletically inspired merchandise.

Overview of Consolidated Results
     Sales increased by 5.6 percent to $5,653 million representing a comparable-store increase of 2.7 percent. Income
from continuing operations before income taxes increased by 8.3 percent to $405 million. Diluted earnings per share was
$1.67 from continuing operations in 2005 as compared with $1.64 in the corresponding prior year period.


                                                                                       7
Sales
     All references to comparable-store sales for a given period relate to sales of stores that are open at the period-end
and that have been open for more than one year and exclude the effect of foreign currency fluctuations. Accordingly, stores
opened and closed during the period are not included. Sales from the Direct-to-Customer segment are included in the
calculation of comparable-store sales for all periods presented. All references to comparable-store sales for 2004 exclude
the acquisition of the 349 Footaction stores and the 11 stores purchased in the Republic of Ireland. Sales from acquired
businesses that include the purchase of inventory will be included in the computation of comparable-store sales after 15
months of operations. Accordingly, Footaction sales are included in the computation of comparable-store sales since
August 2005.

     Sales of $5,653 million in 2005 increased by 5.6 percent from sales of $5,355 million in 2004. The effect of foreign
currency fluctuations on sales was not significant. This increase is primarily related to increased sales in the Company’s
Footaction and Champs Sports formats. Comparable-store sales increased by 2.7 percent.

      Sales of $5,355 million in 2004 increased by 12.1 percent from sales of $4,779 million in 2003. Excluding the effect
of foreign currency fluctuations, sales increased by 9.8 percent as compared with 2003, primarily as a result of the Company’s
acquisition of 349 Footaction stores in May 2004 and the acquisition of 11 stores in the Republic of Ireland in late October
2004, which accounted for $332 million and $5 million in sales, respectively, for 2004. Comparable-store sales increased
by 0.9 percent. The remaining increase is a result of the Company’s continuation of the new store-opening program.

Gross Margin
     Gross margin as a percentage of sales was 30.2 percent in 2005, decreasing by 30 basis points from 30.5 percent
in 2004. This decline is primarily the result of increased markdowns recorded by the European operation. The effect of
vendor allowances on gross margin, as a percentage of sales, as compared with the corresponding prior year period was
not significant.

     Gross margin as a percentage of sales was 30.5 percent in 2004, a decrease of 50 basis points from 31.0 percent in
2003. Of the 50 basis points decrease in 2004, approximately 60 basis points is the result of the Footaction chain, offset,
in part, by a decrease in the cost of merchandise. The effect of vendor allowances on gross margin, as a percentage of
sales, as compared with the corresponding prior year period was not significant.

Division Profit
     The Company evaluates performance based on several factors, the primary financial measure of which is division
profit. Division profit reflects income from continuing operations before income taxes, corporate expense, non-operating
income and net interest expense. The following table reconciles division profit by segment to income from continuing
operations before income taxes.
                                                                                                                      2005       2004         2003
                                                                                                                              (in millions)
        Athletic Stores . . . . . . . . . . . . . . . . . . . . . . . . . . . . . . . . . . . . . . . . . . . . . .   $419       $420         $363
        Direct-to-Customers. . . . . . . . . . . . . . . . . . . . . . . . . . . . . . . . . . . . . . . . .            48         45           53
        Division profit . . . . . . . . . . . . . . . . . . . . . . . . . . . . . . . . . . . . . . . . . . . . . .    467        465          416
        Restructuring charges (1) . . . . . . . . . . . . . . . . . . . . . . . . . . . . . . . . . . . .               —          (2)          (1)
             Total division profit. . . . . . . . . . . . . . . . . . . . . . . . . . . . . . . . . . . .              467        463          415
        Corporate expense . . . . . . . . . . . . . . . . . . . . . . . . . . . . . . . . . . . . . . . . . .          (58)       (74)         (73)
        Total operating profit . . . . . . . . . . . . . . . . . . . . . . . . . . . . . . . . . . . . . . .           409        389          342
        Other income . . . . . . . . . . . . . . . . . . . . . . . . . . . . . . . . . . . . . . . . . . . . . . .       6         —            —
        Interest expense, net . . . . . . . . . . . . . . . . . . . . . . . . . . . . . . . . . . . . . . .            (10)       (15)         (18)
        Income from continuing operations before income taxes. . . .                                                  $405       $374         $324

(1) As more fully described in the notes to the consolidated financial statements, restructuring charges of $2 million and $1 million in 2004 and 2003,
    respectively, were recorded related to the dispositions of non-core businesses.


                                                                                                       8
Corporate Expense
     Corporate expense consists of unallocated general and administrative expenses related to the Company’s corporate
headquarters, centrally managed departments, unallocated insurance and benefit programs, certain foreign exchange
transaction gains and losses, certain depreciation and amortization expenses and other items.

     The decrease in corporate expense of $16 million in 2005 comprised several items, and primarily included decreased
incentive bonuses of $14 million, a $3 million decrease in costs associated with the Company’s loyalty program as the
prior year represented the initial costs to launch the program, and decreased restricted stock expense of $2 million. In
addition, the prior year included $5 million for the integration of the Footaction stores. Included in the current year is
a settlement of $3 million pursuant to a class action settlement with Visa and MasterCard related to past overcharges for
certain debit card transactions. These decreases were offset, in part, by a charge of $4 million due to the potential
insolvency of one of the Company’s insurance carriers and legal and settlement costs of $5 million. Depreciation and
amortization included in corporate expense amounted to $24 million in 2005, $23 million in 2004 and $25 million in 2003.

     The increase in corporate expense in 2004 as compared with 2003 was primarily related to decreased incentive
bonuses of $9 million, offset by increased expenses related to integration of Footaction of $5 million, restricted stock
expense from additional grants of $4 million and costs of $3 million related to the Company’s expanded loyalty program.
Integration costs represent incremental costs directly related to the acquisitions, primarily expenses to re-merchandise
the Footaction stores during the first three months of operations.

Other Income
     Other income for 2005 represents a $3 million net gain on foreign currency option contracts that were entered into
by the Company to mitigate the effect of fluctuating foreign exchange rates on the reporting of euro dominated earnings.
Additionally, other income includes $3 million of insurance recoveries in excess of losses associated with Hurricane Katrina.

Selling, General and Administrative Expenses
     Selling, general and administrative (“SG&A”) expenses increased by $41 million to $1,129 million in 2005, or by
3.8 percent, as compared with 2004. SG&A as a percentage of sales decreased to 20.0 percent as compared with
20.3 percent in 2004. The increase in SG&A is primarily related to an increase in payroll and related costs. The effect of
including Footaction for the full fiscal year is an incremental $21 million, excluding the integration costs. During 2005,
the Company donated 82,500 pairs of athletic footwear with a cost of $2 million to Save the Children Foundation. This
donation benefited the tsunami victims in Banda Aceh, Indonesia, as well as Save the Children programs in the United
States. The net of both pension expense and postretirement income did not change significantly from the prior year.

     SG&A increased by $101 million to $1,088 million in 2004, or by 10.2 percent, as compared with 2003. Excluding
the effect of foreign currency fluctuations, primarily related to the euro, SG&A increased by $82 million, of which the
acquired businesses contributed $68 million. Increased payroll and related costs primarily comprised the balance of the
increase. SG&A as a percentage of sales decreased to 20.3 percent compared with 20.7 percent in 2003. Pension expense
declined by $2 million primarily as a result of the positive market performance experienced in the prior year. Additionally,
postretirement income decreased by $2 million in 2004 as compared with 2003 as the amortization of the unrecognized
gains, which are amortized over the average remaining life expectancy, continues to decrease over time.

Depreciation and Amortization
     Depreciation and amortization of $171 million increased by 11.0 percent in 2005 from $154 million in 2004. This
increase primarily reflects additional depreciation and amortization for the Athletic Stores segment due to capital
spending and, in addition, adjustments to depreciable lives of certain fixed assets. Additionally, depreciation and
amortization for the Footaction format increased by $6 million as compared with the prior year primarily due to increased
capital expenditures related to store improvements and point-of-sale equipment.
     Depreciation and amortization of $154 million in 2004 increased 1.3 percent as compared with $152 million in 2003.
Depreciation and amortization of acquired businesses amounted to $7 million for 2004. These increases were offset by
declines that were a result of older assets becoming fully depreciated.


                                                             9
Interest Expense, Net
                                                                                                                       2005       2004         2003
                                                                                                                               (in millions)
     Interest expense . . . . . . . . . . . . . . . . . . . . . . . . . . . . . . . . . . . . . . . . . . . .          $ 23       $ 22         $ 26
     Interest income. . . . . . . . . . . . . . . . . . . . . . . . . . . . . . . . . . . . . . . . . . . . .           (13)        (7)          (8)
          Interest expense, net . . . . . . . . . . . . . . . . . . . . . . . . . . . . . . . . . .                    $ 10       $ 15         $ 18
     Weighted-average interest rate (excluding facility fees):
         Short-term debt. . . . . . . . . . . . . . . . . . . . . . . . . . . . . . . . . . . . . . . .                  —%          —%          —%
         Long-term debt . . . . . . . . . . . . . . . . . . . . . . . . . . . . . . . . . . . . . . . .                 6.2%        5.2%        6.1%
         Total debt . . . . . . . . . . . . . . . . . . . . . . . . . . . . . . . . . . . . . . . . . . . . .           6.2%        5.2%        6.1%
     Short-term debt outstanding during the year:
          High . . . . . . . . . . . . . . . . . . . . . . . . . . . . . . . . . . . . . . . . . . . . . . . . . . .   $—         $—           $—
          Weighted-average. . . . . . . . . . . . . . . . . . . . . . . . . . . . . . . . . . . . . .                  $—         $—           $—
     Interest expense of $23 million increased by 4.5 percent in 2005 from $22 million in 2004. Interest rate swap
agreements reduced interest expense by approximately $1 million and $3 million in 2005 and 2004, respectively. The
increase in 2005 was primarily attributable to higher interest rates.
      Interest income is generated through the investment of cash equivalents, short-term investments, the accretion of
the Northern Group note to its face value and accrual of interest on the outstanding principal, as well as, interest on income
tax refunds. The increase in interest income of $6 million in 2005 was primarily related to increased interest income earned
on short-term investments due to higher interest rates and increased short-term investment balances. Interest income
on the Northern Group note amounted to $2 million in both 2005 and 2004. Interest income related to cash equivalents
and short-term investments was $11 million in 2005 and $5 million in 2004.
     Interest expense of $22 million declined by 15.4 percent in 2004 from $26 million in 2003. The decrease in 2004
was primarily attributable to the Company’s $150 million 5.50 percent convertible subordinated notes that were converted
to equity in June 2004. Also contributing to the reduction in interest expense was the repurchase of $19 million of the
8.50 percent debentures payable in 2022 in the latter part of 2003. Interest rate swap agreements reduced interest expense
by approximately $3 million and $4 million in 2004 and 2003, respectively. These decreases were offset, in part, by an
increase resulting from the interest on the $175 million term loan that commenced in May 2004.
      Interest income related to cash equivalents and short-term investments decreased by $1 million in 2004 from 2003
as a result of the reduction of interest income earned on tax refunds and settlements as they were received during 2003.
Interest income related to cash equivalents and short-term investments was $5 million in 2004 and 2003.

Income Taxes
     The effective tax rate for 2005 was 35.0 percent as compared with 31.7 percent in the prior year. The increase was
attributable to less benefit from non-recurring items than in 2004 and a higher percentage of the Company’s income earned
in the United States, rather than from lower-taxed international operations. During 2005, the Company restructured its
Canadian continuing business, which resulted in a $6 million reduction to its income tax valuation allowance related to
Canadian tax loss carry-forwards and unclaimed tax depreciation. Additionally, the Company recorded an income tax
benefit of $3 million in discontinued operations related to its former Canadian operations.
     The effective tax rate for 2004 was 31.7 percent, as compared with 35.5 percent in the prior year. The reduction was
principally related to a lower rate of tax on the Company’s foreign operations and the settlement of tax examinations.
During 2004, the Commonwealth of Puerto Rico concluded an examination of the Company’s branch income tax returns,
including an income tax audit for the years 1994 through 1999 and a branch profit tax audit for the years 1994 through
2002. As a result, the Company reduced its income tax provision for continuing operations by $2 million. Also during 2004,
the IRS completed its survey of the Company’s income tax returns for the years from 1999-2001 and its examination of
the 2002 year. The IRS and the Company completed a pre-filing review and post-filing review of the Company’s income
tax return for 2003. As a result of these actions by the IRS and the completion of the Company’s analysis, the Company
reduced its income tax provision for continuing operations by $12 million and discontinued operations by $37 million.
    The effective rate for 2003 was 35.5 percent, as compared with 34.2 percent in 2002. The increased tax rate was
primarily due to the Company recording tax benefits of $5 million in 2003 as compared to $9 million in 2002. In addition

                                                                                                      10
foot locker annual reports 2005

Weitere ähnliche Inhalte

Was ist angesagt?

Michaels Stores 080414
Michaels Stores 080414Michaels Stores 080414
Michaels Stores 080414Ronald Rich
 
Raytheon Reports 2008 Second Quarter Results
Raytheon Reports 2008 Second Quarter ResultsRaytheon Reports 2008 Second Quarter Results
Raytheon Reports 2008 Second Quarter Resultsfinance12
 
newmont mining Feb_Final_4Q_2006_ER_Presentation
newmont mining Feb_Final_4Q_2006_ER_Presentationnewmont mining Feb_Final_4Q_2006_ER_Presentation
newmont mining Feb_Final_4Q_2006_ER_Presentationfinance37
 
oe E. Harlan Executive Vice President, Electro and Communications Business
oe E. Harlan Executive Vice President, Electro and Communications Businessoe E. Harlan Executive Vice President, Electro and Communications Business
oe E. Harlan Executive Vice President, Electro and Communications Businessfinance10
 
DGX07AR quest diagnostics
DGX07AR quest diagnostics DGX07AR quest diagnostics
DGX07AR quest diagnostics finance34
 
Raytheon Reports 2006 Second Quarter Results
Raytheon Reports 2006 Second Quarter ResultsRaytheon Reports 2006 Second Quarter Results
Raytheon Reports 2006 Second Quarter Resultsfinance12
 
Aba april 5 pitch_book_adley_exits deck
Aba april 5 pitch_book_adley_exits deckAba april 5 pitch_book_adley_exits deck
Aba april 5 pitch_book_adley_exits deckAdley Bowden
 
Comcast YE07 Earnings Conference Call
Comcast YE07 Earnings Conference CallComcast YE07 Earnings Conference Call
Comcast YE07 Earnings Conference Callfinance8
 
6 Prudential's "Inside Our Best Ideas" Conference
6	Prudential's "Inside Our Best Ideas" Conference6	Prudential's "Inside Our Best Ideas" Conference
6 Prudential's "Inside Our Best Ideas" Conferencefinance10
 
celanese q2_2006_pm_e
celanese q2_2006_pm_ecelanese q2_2006_pm_e
celanese q2_2006_pm_efinance44
 
starbucks AR2008
starbucks  AR2008starbucks  AR2008
starbucks AR2008finance41
 
Barnes_%26_Noble_2006_Annual_Report
Barnes_%26_Noble_2006_Annual_ReportBarnes_%26_Noble_2006_Annual_Report
Barnes_%26_Noble_2006_Annual_Reportfinance38
 
staples Annual Report 1998
staples Annual Report 1998staples Annual Report 1998
staples Annual Report 1998finance13
 
Yahoo Q1 2008 Earnings Call Presentation
Yahoo Q1 2008 Earnings Call PresentationYahoo Q1 2008 Earnings Call Presentation
Yahoo Q1 2008 Earnings Call PresentationKeith Teare
 

Was ist angesagt? (15)

Michaels Stores 080414
Michaels Stores 080414Michaels Stores 080414
Michaels Stores 080414
 
Raytheon Reports 2008 Second Quarter Results
Raytheon Reports 2008 Second Quarter ResultsRaytheon Reports 2008 Second Quarter Results
Raytheon Reports 2008 Second Quarter Results
 
GPI2002AR
GPI2002ARGPI2002AR
GPI2002AR
 
newmont mining Feb_Final_4Q_2006_ER_Presentation
newmont mining Feb_Final_4Q_2006_ER_Presentationnewmont mining Feb_Final_4Q_2006_ER_Presentation
newmont mining Feb_Final_4Q_2006_ER_Presentation
 
oe E. Harlan Executive Vice President, Electro and Communications Business
oe E. Harlan Executive Vice President, Electro and Communications Businessoe E. Harlan Executive Vice President, Electro and Communications Business
oe E. Harlan Executive Vice President, Electro and Communications Business
 
DGX07AR quest diagnostics
DGX07AR quest diagnostics DGX07AR quest diagnostics
DGX07AR quest diagnostics
 
Raytheon Reports 2006 Second Quarter Results
Raytheon Reports 2006 Second Quarter ResultsRaytheon Reports 2006 Second Quarter Results
Raytheon Reports 2006 Second Quarter Results
 
Aba april 5 pitch_book_adley_exits deck
Aba april 5 pitch_book_adley_exits deckAba april 5 pitch_book_adley_exits deck
Aba april 5 pitch_book_adley_exits deck
 
Comcast YE07 Earnings Conference Call
Comcast YE07 Earnings Conference CallComcast YE07 Earnings Conference Call
Comcast YE07 Earnings Conference Call
 
6 Prudential's "Inside Our Best Ideas" Conference
6	Prudential's "Inside Our Best Ideas" Conference6	Prudential's "Inside Our Best Ideas" Conference
6 Prudential's "Inside Our Best Ideas" Conference
 
celanese q2_2006_pm_e
celanese q2_2006_pm_ecelanese q2_2006_pm_e
celanese q2_2006_pm_e
 
starbucks AR2008
starbucks  AR2008starbucks  AR2008
starbucks AR2008
 
Barnes_%26_Noble_2006_Annual_Report
Barnes_%26_Noble_2006_Annual_ReportBarnes_%26_Noble_2006_Annual_Report
Barnes_%26_Noble_2006_Annual_Report
 
staples Annual Report 1998
staples Annual Report 1998staples Annual Report 1998
staples Annual Report 1998
 
Yahoo Q1 2008 Earnings Call Presentation
Yahoo Q1 2008 Earnings Call PresentationYahoo Q1 2008 Earnings Call Presentation
Yahoo Q1 2008 Earnings Call Presentation
 

Ähnlich wie foot locker annual reports 2005

timken AR2004
timken AR2004timken AR2004
timken AR2004finance39
 
Galaxy Gaming (GLXZ) 2011 Earning Conference Call
Galaxy Gaming (GLXZ) 2011 Earning Conference CallGalaxy Gaming (GLXZ) 2011 Earning Conference Call
Galaxy Gaming (GLXZ) 2011 Earning Conference CallGalaxy Gaming, Inc.
 
fiserv annual reports 2005
fiserv annual reports 2005fiserv annual reports 2005
fiserv annual reports 2005finance47
 
ecolab Ecolab_2004_Final
ecolab  Ecolab_2004_Finalecolab  Ecolab_2004_Final
ecolab Ecolab_2004_Finalfinance37
 
ecolab 2003AnnualReport
ecolab  2003AnnualReportecolab  2003AnnualReport
ecolab 2003AnnualReportfinance37
 
ecolab Ecolab_BusDesc_FinHigh
ecolab  Ecolab_BusDesc_FinHighecolab  Ecolab_BusDesc_FinHigh
ecolab Ecolab_BusDesc_FinHighfinance37
 
goodrich 2Q06_Slides
goodrich  2Q06_Slidesgoodrich  2Q06_Slides
goodrich 2Q06_Slidesfinance44
 
goodrich 2Q06_Slides
goodrich  2Q06_Slidesgoodrich  2Q06_Slides
goodrich 2Q06_Slidesfinance44
 
newmont mining Feb_Final_4Q_2006_ER_Presentation
newmont mining Feb_Final_4Q_2006_ER_Presentationnewmont mining Feb_Final_4Q_2006_ER_Presentation
newmont mining Feb_Final_4Q_2006_ER_Presentationfinance37
 
TimkenAnnualReport2005final
TimkenAnnualReport2005finalTimkenAnnualReport2005final
TimkenAnnualReport2005finalfinance39
 
TimkenAnnualReport2005final
TimkenAnnualReport2005finalTimkenAnnualReport2005final
TimkenAnnualReport2005finalfinance39
 
goodrich Q205_Slides
goodrich  Q205_Slidesgoodrich  Q205_Slides
goodrich Q205_Slidesfinance44
 
Ecolab2005AR
Ecolab2005AREcolab2005AR
Ecolab2005ARfinance37
 
ecolab 2003BusinessDescription
ecolab  2003BusinessDescriptionecolab  2003BusinessDescription
ecolab 2003BusinessDescriptionfinance37
 
.monsanto Q3 2006Earning Release
.monsanto Q3 2006Earning Release.monsanto Q3 2006Earning Release
.monsanto Q3 2006Earning Releasefinance28
 
jacobs 2005_single
jacobs 2005_singlejacobs 2005_single
jacobs 2005_singlefinance28
 
jacobs2005_single
jacobs2005_singlejacobs2005_single
jacobs2005_singlefinance28
 

Ähnlich wie foot locker annual reports 2005 (20)

timken AR2004
timken AR2004timken AR2004
timken AR2004
 
AR2004
AR2004AR2004
AR2004
 
Galaxy Gaming (GLXZ) 2011 Earning Conference Call
Galaxy Gaming (GLXZ) 2011 Earning Conference CallGalaxy Gaming (GLXZ) 2011 Earning Conference Call
Galaxy Gaming (GLXZ) 2011 Earning Conference Call
 
fiserv annual reports 2005
fiserv annual reports 2005fiserv annual reports 2005
fiserv annual reports 2005
 
ecolab Ecolab_2004_Final
ecolab  Ecolab_2004_Finalecolab  Ecolab_2004_Final
ecolab Ecolab_2004_Final
 
ecolab 2003AnnualReport
ecolab  2003AnnualReportecolab  2003AnnualReport
ecolab 2003AnnualReport
 
ecolab Ecolab_BusDesc_FinHigh
ecolab  Ecolab_BusDesc_FinHighecolab  Ecolab_BusDesc_FinHigh
ecolab Ecolab_BusDesc_FinHigh
 
goodrich 2Q06_Slides
goodrich  2Q06_Slidesgoodrich  2Q06_Slides
goodrich 2Q06_Slides
 
goodrich 2Q06_Slides
goodrich  2Q06_Slidesgoodrich  2Q06_Slides
goodrich 2Q06_Slides
 
newmont mining Feb_Final_4Q_2006_ER_Presentation
newmont mining Feb_Final_4Q_2006_ER_Presentationnewmont mining Feb_Final_4Q_2006_ER_Presentation
newmont mining Feb_Final_4Q_2006_ER_Presentation
 
GPI2004AR
GPI2004ARGPI2004AR
GPI2004AR
 
GPI2004AR
GPI2004ARGPI2004AR
GPI2004AR
 
TimkenAnnualReport2005final
TimkenAnnualReport2005finalTimkenAnnualReport2005final
TimkenAnnualReport2005final
 
TimkenAnnualReport2005final
TimkenAnnualReport2005finalTimkenAnnualReport2005final
TimkenAnnualReport2005final
 
goodrich Q205_Slides
goodrich  Q205_Slidesgoodrich  Q205_Slides
goodrich Q205_Slides
 
Ecolab2005AR
Ecolab2005AREcolab2005AR
Ecolab2005AR
 
ecolab 2003BusinessDescription
ecolab  2003BusinessDescriptionecolab  2003BusinessDescription
ecolab 2003BusinessDescription
 
.monsanto Q3 2006Earning Release
.monsanto Q3 2006Earning Release.monsanto Q3 2006Earning Release
.monsanto Q3 2006Earning Release
 
jacobs 2005_single
jacobs 2005_singlejacobs 2005_single
jacobs 2005_single
 
jacobs2005_single
jacobs2005_singlejacobs2005_single
jacobs2005_single
 

Mehr von finance38

urs proxy reports 2005
urs proxy reports 2005urs proxy reports 2005
urs proxy reports 2005finance38
 
urs proxy reports 2007
urs proxy reports 2007urs proxy reports 2007
urs proxy reports 2007finance38
 
urs proxy reports 2008
urs proxy reports 2008urs proxy reports 2008
urs proxy reports 2008finance38
 
urs Form 10-K 2004
urs Form 10-K 2004urs Form 10-K 2004
urs Form 10-K 2004finance38
 
urs Form 10-K 2005
urs Form 10-K 2005urs Form 10-K 2005
urs Form 10-K 2005finance38
 
urs Form 10-K 2006
urs Form 10-K 2006urs Form 10-K 2006
urs Form 10-K 2006finance38
 
urs Form 10-K 2007
urs Form 10-K 2007urs Form 10-K 2007
urs Form 10-K 2007finance38
 
urs annual reports 2004
urs annual reports 2004urs annual reports 2004
urs annual reports 2004finance38
 
urs annual reports 2006
urs annual reports 2006urs annual reports 2006
urs annual reports 2006finance38
 
urs annual reports 2005
urs annual reports 2005urs annual reports 2005
urs annual reports 2005finance38
 
urs annual reports 2007
urs annual reports 2007urs annual reports 2007
urs annual reports 2007finance38
 
ntrs_investor_day_ntgi
ntrs_investor_day_ntgintrs_investor_day_ntgi
ntrs_investor_day_ntgifinance38
 
ntrs_investor_day_cis
ntrs_investor_day_cisntrs_investor_day_cis
ntrs_investor_day_cisfinance38
 
ntrs_investor_day_pfs
ntrs_investor_day_pfsntrs_investor_day_pfs
ntrs_investor_day_pfsfinance38
 
ntrs_investor_day_cfo
ntrs_investor_day_cfontrs_investor_day_cfo
ntrs_investor_day_cfofinance38
 
ntrs_investor_day_ceo
ntrs_investor_day_ceontrs_investor_day_ceo
ntrs_investor_day_ceofinance38
 
ntrs_bancanalysts_boston_nov_6_08
ntrs_bancanalysts_boston_nov_6_08ntrs_bancanalysts_boston_nov_6_08
ntrs_bancanalysts_boston_nov_6_08finance38
 
ntrs_citigroup_jan_28_09
ntrs_citigroup_jan_28_09ntrs_citigroup_jan_28_09
ntrs_citigroup_jan_28_09finance38
 
ntrs_2007_proxy
ntrs_2007_proxyntrs_2007_proxy
ntrs_2007_proxyfinance38
 
northerntrust_proxy_2009
northerntrust_proxy_2009northerntrust_proxy_2009
northerntrust_proxy_2009finance38
 

Mehr von finance38 (20)

urs proxy reports 2005
urs proxy reports 2005urs proxy reports 2005
urs proxy reports 2005
 
urs proxy reports 2007
urs proxy reports 2007urs proxy reports 2007
urs proxy reports 2007
 
urs proxy reports 2008
urs proxy reports 2008urs proxy reports 2008
urs proxy reports 2008
 
urs Form 10-K 2004
urs Form 10-K 2004urs Form 10-K 2004
urs Form 10-K 2004
 
urs Form 10-K 2005
urs Form 10-K 2005urs Form 10-K 2005
urs Form 10-K 2005
 
urs Form 10-K 2006
urs Form 10-K 2006urs Form 10-K 2006
urs Form 10-K 2006
 
urs Form 10-K 2007
urs Form 10-K 2007urs Form 10-K 2007
urs Form 10-K 2007
 
urs annual reports 2004
urs annual reports 2004urs annual reports 2004
urs annual reports 2004
 
urs annual reports 2006
urs annual reports 2006urs annual reports 2006
urs annual reports 2006
 
urs annual reports 2005
urs annual reports 2005urs annual reports 2005
urs annual reports 2005
 
urs annual reports 2007
urs annual reports 2007urs annual reports 2007
urs annual reports 2007
 
ntrs_investor_day_ntgi
ntrs_investor_day_ntgintrs_investor_day_ntgi
ntrs_investor_day_ntgi
 
ntrs_investor_day_cis
ntrs_investor_day_cisntrs_investor_day_cis
ntrs_investor_day_cis
 
ntrs_investor_day_pfs
ntrs_investor_day_pfsntrs_investor_day_pfs
ntrs_investor_day_pfs
 
ntrs_investor_day_cfo
ntrs_investor_day_cfontrs_investor_day_cfo
ntrs_investor_day_cfo
 
ntrs_investor_day_ceo
ntrs_investor_day_ceontrs_investor_day_ceo
ntrs_investor_day_ceo
 
ntrs_bancanalysts_boston_nov_6_08
ntrs_bancanalysts_boston_nov_6_08ntrs_bancanalysts_boston_nov_6_08
ntrs_bancanalysts_boston_nov_6_08
 
ntrs_citigroup_jan_28_09
ntrs_citigroup_jan_28_09ntrs_citigroup_jan_28_09
ntrs_citigroup_jan_28_09
 
ntrs_2007_proxy
ntrs_2007_proxyntrs_2007_proxy
ntrs_2007_proxy
 
northerntrust_proxy_2009
northerntrust_proxy_2009northerntrust_proxy_2009
northerntrust_proxy_2009
 

foot locker annual reports 2005

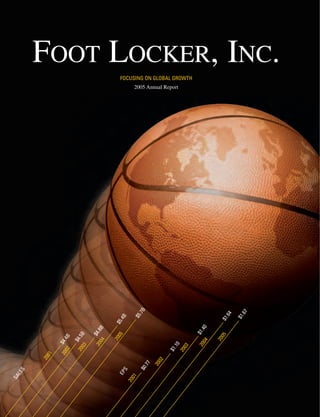
  • 1. SA LE S 20 01 20 $4.4 B 02 $ 20 4.5B 03 20 $4.8 B 04 20 $5 05 EP .4B S 20 01 $5 .7B $0 .77 20 02 $1 2005 Annual Report .10 20 03 FOCUSING ON GLOBAL GROWTH $1 20 .40 04 20 05 $1 .64 $1 .67 FOOT LOCKER, INC.
  • 2. FOOT LOCKER, INC. About the Company Additionally, the Company's Footlocker.com/Eastbay Foot Locker, Inc. (NYSE: FL) is the world's leading business operates a rapidly growing direct-to-customers retailer of athletic footwear and apparel. Headquartered business offering athletic footwear, apparel and equip- in New York City, it operates approximately 4,000 ath- ment through its Internet and catalog channels. letic retail stores in 20 countries in North America, Europe and Australia under the brand names Foot Locker, Footaction, Lady Foot Locker, Kids Foot Locker and Champs Sports. FINANCIAL HIGHLIGHTS (Millions, except per share amounts) 2001 2002 2003 2004 2005 Sales $ 4,379 $ 4,509 $ 4,779 $ 5,355 $5,653 Total operating profit $ 197 $ 269 $ 342 $ 389 $ 409 Income from continuing operations $ 111 $ 162 $ 209 $ 255 $ 263 Diluted EPS from continuing operations $ 0.77 $ 1.10 $ 1.40 $ 1.64 $ 1.67 Cash, cash equivalents and short-term investment position, net of debt $ (184) $ — $ 113 $ 127 $ 261 Athletic stores sales per average gross square foot (dollars) $ 306 $ 316 $ 335 $ 345 $ 361 Table of Contents Shareholders’ Letter 2 Business Overview 5 Foot Locker 6 Champs Sports 8 Footaction 9 Kids Foot Locker/Lady Foot Locker 10 Footlocker.com/Eastbay 11 Community Involvement 12 Form 10-K 13 Board of Directors, Corporate Management, Division Management, Corporate Information IBC Cover image illustrates Sales and Diluted EPS from Continuing Operations.
  • 3. Athletic Stores Sales Per Average Gross $361 Square Foot $345 (dollars) $335 $316 05 $306 04 03 02 01 400 Operating Profit (millions) $409 $389 $342 05 04 $269 300 03 $197 02 01 Income from Continuing Operations $263 (millions) $255 $209 05 04 $162 500 03 $111 02 01 Diluted EPS from Continuing Operations (dollars) $1.67 $1.64 05 $1.40 04 $1.10 03 400 $0.77 02 01 1
  • 4. SHAREHOLDERS’ LETTER Overall, our business produced solid sales and pre-tax earnings increases in 2005 while also generating strong cash flow that we are actively redeploying to benefit our shareholders. Not to be overlooked in 2005 were the gies we are employing, designed to For Foot Locker, Inc., 2005 was a year of steps we continued to take to improve our enhance the sales productivity of our accomplishments, both in positioning our financial footing: We further strengthened store fleet, are working as intended. Company to generate greater value for our balance sheet by reducing our finan- Going forward, we have raised the bar and shareholders, and in aggressively address- cial liabilities, while also significantly currently believe that we can enhance the ing new opportunities and challenges increasing the amount of cash that we productivity of our stores even further alike. For the most part we produced cred- returned to our shareholders through div- and, over time, achieve sales of $400 per itable results during the past year, but fell idends and a share repurchase program. average gross square foot within the next short of the earnings target we set for several years. ourselves at the beginning of the year. 2005 Financial Scoreboard We are also pleased with our continu- In brief, our performance in certain ing success in enhancing the Company's international markets, primarily in Europe, Overall, our business produced solid sales financial position and utilizing our oper- did not meet our expectations. We have and pre-tax earnings increases while also ating cash flow of $355 million to deliver since moved quickly to address several generating strong cash flow that we are increased value for shareholders. Key internal and external factors that con- actively redeploying to benefit our share- investment decisions made during the tributed to profit declines in these mar- holders. year included: kets. To continue our success as a global specialty retailer, we must anticipate The following highlights our achieve- • Investing $163 million in capital worldwide consumer trends and meet or ments in 2005: expenditures exceed the needs of our customers. • Contributing $26 million to our pen- Towards this end, we are working actively • Total sales increased 5.6 percent to sion funds with our suppliers to better assure that we $5.7 billion • Repaying $35 million of long-term provide to our customers, wherever they • Pre-tax profit increased 8.3 percent to debt reside, the most fashionable, highest $405 million • Paying $49 million of dividends to our quality products at compelling and com- • Earnings per share from continuing shareholders petitive prices. operations increased to $1.67 • Repurchasing $35 million of our com- On a more positive note, we are • Cash position, net of debt, increased mon stock pleased with the solid sales and profit by $134 million gains posted by our combined North At year end, the Company's cash and American retail store business and direct- Looking beyond these highlights, 2005 short-term investment position, net of to-customers operations. Our Champs was also a year in which we met a key tar- long-term debt and capital leases, stood Sports and recently-acquired Footaction geted performance metric. We are pleased at $261 million, reflecting our strong businesses were our star performers for that we exceeded our $350 sales per aver- financial position and balance sheet. the year, while our Footlocker.com/ age gross square foot objective -- a goal Eastbay direct-to-customers business that we established earlier this decade. posted our highest division profit margin The improvement in this performance rate. metric provides evidence that the strate- 2
  • 5. Gross Square Footage Store Summary 2005 2006 January 29, January 28, Remodeled/ Average Total Targeted 2005 Opened Closed 2006 Relocated Size Openings (thousands) Foot Locker 1,428 45 75 1,398 124 4,000 5,626 50 Footaction 349 24 10 363 40 4,700 1,718 20 Lady Foot Locker 567 8 21 554 19 2,200 1,241 25 Kids Foot Locker 346 1 20 327 39 2,400 791 20 Foot Locker International 707 30 14 723 38 2,900 2,062 35 Champs Sports 570 11 25 556 56 5,500 3,045 25 Total 3,967 119 165 3,921 316 3,700 14,483 175 Positioned To Win generate a rate of return well in excess of Game Plan -- Expanding Our Reach our cost of capital. Looking to the future, we believe we have As we move forward, we have a number of We continually seek new opportunities many opportunities to accelerate our growth priorities underway that we are to grow our Company profitably, while growth by expanding the reach of our confident will position our Company for prudently maintaining a conservative -- business into both new and existing mar- continued market leadership, strong yet efficient -- capital structure designed kets. We expect that these opportunities financial performance and delivery of to minimize our cost of capital. Reducing will include the continued implementa- greater value to our shareholders. our financial liabilities and strengthening tion of the growth strategy that we have The Company's first growth priority is our balance sheet are important consider- been successfully executing for several to fund capital projects designed to ations as we strive to attain an invest- years, as well as the development of new enhance our existing business. During ment-grade credit rating. With this prior- initiatives that will allow us to reach a 2005, the Company spent approximately ity in mind, during 2005 we repaid $35 larger and more diverse customer base. 80 percent of its $163 million capital million of long-term debt and contributed An integral part of this growth strate- expenditures on store maintenance, $26 million to our pension plans. gy is our real estate program, first remodels and relocations, as well as Our Board of Directors is also commit- embarked upon in 2001, and geared at enhancements to our infrastructure and ed to enhancing shareholder value opening 1,000 new stores over several sales support systems. The remaining 20 through both capital appreciation and years. In line with this strategy, we percent of the Company's 2005 capital dividends. Thus, in November 2005, the opened or acquired 961 new stores over expenditure program was allocated to Board of Directors increased the cash div- the past five years, while also closing 622 opening new retail stores. During the year idend on Foot Locker, Inc.'s common underperforming stores. During this time, we completed 600 real estate projects, stock by 20 percent, to an annualized we also expanded our store base into six opening 119 new stores, remodeling and amount of $0.36 per share, reflecting new countries, including Greece and relocating 316 stores, and closing 165 confidence in the ability of management Switzerland this past year. stores. to continue to increase the Company's As we look toward 2006, we have Acquiring compatible athletic profitability. During the second quarter of increased our capital expenditure plan to footwear and apparel retail companies is 2005, we began to implement a share $190 million. This will enable us to accel- another growth priority for our Company. repurchase program, with 1.6 million erate our store openings to approximate- During the prior year, we explored sever- shares purchased for the full year at a ly 175 new stores and to expand our al potential acquisition opportunities cost of $35 million. Additionally, the reach by testing new markets. We esti- that we believe could be a strategic fit Board of Directors authorized in February mate that 80 percent of the new stores with our Company. We plan to continue to 2006 a new three-year $150 million share will be located in the United States and pursue carefully acquisition opportuni- repurchase program that may be imple- 20 percent in international markets. ties, maintaining a patient posture to mented based upon market prices and During 2006, we also plan to close ensure that potential investments are other factors. approximately 110 underperforming accretive to our earnings per share and 3
  • 6. Looking to the future, we believe that we have many oppor- tunities to accelerate our growth by expanding the reach of our business into both new and existing markets. We believe that our Company also has stores. Therefore, we expect our athletic vide many competitive advantages that the distinct advantage of benefitting store base to increase by 1-to-2 percent benefit our Company today and provide from the strategic direction and counsel in 2006 and, at year end, we will be oper- an edge as we strive to grow our Company of a Board of Directors comprising indi- ating more stores in each of our formats profitably and deliver greater value to our viduals with truly exceptional talents. compared to the beginning of the year. shareholders. Their guidance over the past several years Another strategy to expand our reach Building a winning culture that has as has contributed significantly to our suc- is through an arrangement that we its core a passion for high performance is cess. recently negotiated with a well-estab- of paramount importance to our Finally, we would like to thank our lished third party franchisee to open Foot Company. Today, our associates are fully suppliers, landlords and other business Locker franchises in several countries in engaged in our business, focused on their partners who assist us in providing excep- the Middle East, a region where we do not key responsibilities and encouraged to tional goods and services to our valued currently operate stores. We are working develop new ideas to benefit our organi- customers. together with the franchisee towards a zation. It is through the hard work of our We are confident and optimistic goal of opening six new franchised stores associates -- the Company's most impor- regarding the future of Foot Locker, Inc. in 2006 and a total of 75 new stores in tant asset -- that we have successfully Several important growth opportunities this region over the next four years. increased shareholder value over the have been identified that, when imple- Finally, we continue to seek ways to years. mented, we believe will benefit both our increase sales and profits by leveraging Of course, our focus on strong per- near term and longer term financial our Footlocker.com/Eastbay infrastruc- formance across all aspects of our busi- results. Our organization is strong, our ture. During 2006, we plan to expand our ness also extends to our commitment to financial position is solid, our infrastruc- reach through our direct-to-customers good corporate citizenship. In particular, ture is well equipped, and we look for- channels by developing a new Internet we are very proud of the manner in which ward with great enthusiasm to our excit- website and catalog selling men's and our organization stepped up to the plate ing future and bright prospects. women's leather dress shoes. this year to raise funds for several worthy organizations, including the United Negro Home Court Advantages College Fund, the United Way and the American Cancer Society. Additionally, Sincerely, Today, Foot Locker, Inc. maintains a lead- Foot Locker, Inc. donated more than ership position in the worldwide special- 80,000 pairs of athletic shoes to Save the ty athletic footwear and apparel retail Children, primarily to provide aid to the industry with almost 4,000 stores in 20 victims of the tsunami disaster in Asia. countries. We also operate a highly-prof- Our associates worldwide also made gen- Matthew D. Serra itable direct-to-customers business that erous contributions to assist their fellow Chairman of the Board, President sells athletic footwear, apparel and associates and families who were and Chief Executive Officer equipment through catalogs and the adversely affected by hurricanes Katrina, Internet -- channels that complement our Rita and Wilma. retail stores. Our well-known brands, mar- ket share position and diversification pro- 4
  • 7. BUSINESS OVERVIEW Global diversification is a vital component of the Company's strategic positioning. This diversification is unique in the athletic Footwear and apparel retail industry and provides many distinct advantages. Foot Locker, Inc. has established a strong presence in several global markets within North America, Europe and Australia. 501 European Stores 4 Guam Stores 21 Hawaii Stores 164 Canadian 80 Stores Australian Stores 14 New Zealand Stores 3,058 U.S. Stores 70 Puerto Rico Stores 9 Virgin Islands Stores Primary Customer Merchandise Mix # of Stores Average Store Size Men’s, Women’s and Children’s Athletic Footwear 4,000 Gross 12 to 20 Year Old Men’s Athletic Apparel and Accessories 1,398 Square Feet Men's, Women's and Children's Athletic Footwear 4,700 Gross 15 to 30 Year Old Men’s Athletic Apparel and Accessories 363 Square Feet 14 to 35 Year Old Women’s Athletic Footwear, Apparel 2,200 Gross Female and Accessories 554 Square Feet Children’s Athletic Footwear, Apparel 2,400 Gross 5 to 11 Year Old and Accessories 327 Square Feet Men’s, Women’s and Children’s Athletic Footwear 2,900 Gross 12 to 20 Year Old Men’s Athletic Apparel and Accessories 723 Square Feet Men’s, Women’s and Children’s Athletic Footwear Men’s Athletic Apparel and Accessories 5,500 Gross 12 to 25 Year Old Athletic Equipment 556 Square Feet Men’s, Women’s and Children’s 12 to 35 Year Old Athletic Footwear, Apparel and Equipment 5
  • 8. The Company's largest business, Foot Locker, which was reaching double digits for the first time in its history. first introduced by the Company in 1974, today is the For the past several years, Europe has represented the world's largest athletic footwear and apparel retailer. At most exciting region in which the Company has pursued year-end, Foot Locker operated a total of 2,121 stores store growth. Foot Locker continued to implement suc- around the globe in 20 countries, with 1,398 stores locat- cessfully a store expansion strategy in Europe during ed in the United States, 501 stores in Europe, 128 stores 2005, opening 22 new stores in countries where the in Canada and 94 stores in the Asia/Pacific region. Its Company already operates, as well as testing two new stores average 3,600 gross square feet and target a 12- markets -- Greece and Switzerland. The operating results to-20 year old male customer base that is influenced by for Foot Locker Europe in 2005 were disappointing, as a competitive sports and urban trends. combination of weak economic factors, coupled with a In the North American market, Foot Locker is actively more competitive marketplace, led to a contraction of its implementing several strategies with a goal of driving division profit margin rate, which was, however, still in the comparable-store sales growth and reducing its operat- low double digit range. ing costs as a percentage of sales. These strategies The Company also sees an opportunity for store include enhancing the portfolio of its store fleet by open- growth in the Asia/Pacific region. In the near-term, new ing new stores in markets with high sales potential, clos- store openings will be concentrated in the Australian and ing stores that are losing money and updating the New Zealand markets, which are regions where the appearance of stores through a remodeling and reloca- Company already operates profitably. Store growth into tion program. Of the North American Foot Locker stores new markets in this region is expected in the future, once 2005 financial results, the profit increase of Foot Locker the Company is confident that a profitable business Canada was most notable, with its division profit margin model has been developed. Foot Locker is actively implementing several strategies with a goal of driving sales growth and reducing its operating costs as a percentage of sales. 6
  • 9. 7
  • 10. In terms of number of stores, annual sales volume and, prior year. In fact, the Champs Sports division sales and most importantly, profitability, Champs Sports is the profits reached record levels last year, with a division prof- Company's second largest division in North America. it margin rate in the high single digit range. Additional Champs Sports stores are primarily mall-based and offer quantities of high priced marquee athletic footwear and for sale athletic footwear, apparel and equipment through more fashion-right assortment of private-label and brand- a total of 556 specialty stores, of which 520 are located in ed apparel offerings contributed to the strong sales the United States and 36 in Canada. The typical Champs growth. Sports store averages 5,500 gross square feet, with mer- The Company is encouraged that Champs Sports store chandise that targets a suburban consumer who is 12 to locations and product offerings are well positioned in the 25 years old and is both performance and fashion-con- athletic marketplace and expects the division to post solid scious. increases in sales and profit in 2006. Given the renewed Champs Sports had an outstanding year in 2005, gen- strength of this division, additional store growth is erating a low double digit comparable-store sales planned, primarily in shopping malls located in suburban increase and a significant profit improvement over the markets in the United States. The Company is encouraged that Champs Sports store locations and product offerings are well positioned in the athletic market- place and expects the division to post solid increases in sales and profits in 2006. 8
  • 11. The Company purchased 349 Footaction stores from offerings. Today, store associates are better trained to serv- Footstar, Inc. in May 2004 to expand its reach into urban ice its customers and products are current, fashion-right markets in the United States. Footaction's target customer and well positioned for 2006. is a 15 to 30 year old male who is influenced by the “street” As expected, Footaction made a meaningful sales and and “hip-hop” culture. The benefits gained by the profit contribution to the Company's financial results in Company from acquiring Footaction include providing an 2005. Its division profit margin increased to the mid-single excellent complementary fit with its other athletic formats digit range from a loss in the prior year. The Company and expanding the demographic characteristics of the expects that the division profit of Footaction will continue Company's customer base. to be enhanced in the coming year and that its division mar- Footaction stores, which average 4,700 gross square gin rate will ultimately reach or exceed that of Foot Locker feet, are conveniently located to their primary customers U.S. Given its initial success and expected improvements, and are properly sized to allow an attractive display of a the Company is currently pursuing additional store growth broad array of product choices. During 2005, a key focus of for this chain. the management team of Footaction was to improve cus- tomer service levels and enhance the store's merchandise Given Footaction's success and expected improvements, the Company is currently pursuing additional store growth for this chain. 9
  • 12. Kids Foot Locker is the market leader in selling children's athlet- implementation of several key strategies, including closing ic footwear and apparel, targeting a mother of a 5 to 11 year old underperforming stores. In 2005, Kids Foot Locker produced child. This business, which was developed in 1987 to extend the another solid comparable-store sales gain and achieved record reach of Foot Locker and to appeal to a young consumer, cur- division profit results. With the overall store base currently rently operates 327 stores in the United States that average operating at a much-improved division margin, the Company 2,400 gross square feet. plans to pursue renewed store growth for this division. During the past three years, the Company has significantly increased the profitability of Kids Foot Locker through the Lady Foot Locker operates 554 stores in the United States that Foot Locker built on the early success of this strategy by further average 2,200 gross square feet. This business was developed by developing its private-label apparel program and by working the Company in 1982, with a focus on providing a “women-friend- closely with its suppliers to provide more fashionable branded ly” shopping experience by offering athletically-inspired footwear footwear products that would appeal to a more diverse customer and apparel in a comfortable environment. Today, Lady Foot base. These strategies contributed to solid comparable-store sales Locker is uniquely positioned in the marketplace as a destination gains and a significant increase in division profit last year. location for the active 14 to 35 year old female shopper. Looking ahead, the Company believes that Lady Foot Locker will Two years ago Lady Foot Locker embarked on a strategy continue to benefit from these programs. designed to enhance its branded and private-label apparel offer- ings to have greater appeal to its target customer. In 2005, Lady Kids Foot Locker and Lady Foot Locker continue to produce improving financial results. 10
  • 13. Footlocker.com, the Company's direct-to-customers business, is Amazon.com, United States Olympic Committee, ESPN and several the world's leading retailer that sells athletic footwear, apparel of the Company's key suppliers. and equipment via catalogs and E-commerce websites. This busi- Today, Footlocker.com is a well-run business with its catalog ness includes the well-known Eastbay brand, which the Company and Internet operations integrated within a single, highly effi- acquired almost 10 years ago as a means to expand its customer cient infrastructure, including a distribution center with sufficient base by selling athletic footwear, apparel and equipment through capacity to support management's near-term growth plans. This a well-managed catalog operation. business is complementary to the Company's retail stores due to During the past several years, the business has expanded rapid- its appeal to a wider customer base by offering a greater assort- ly, primarily by developing E-commerce websites capitalizing on the ment of styles and sizes, and more technically oriented sporting Company's highly-recognizable brand names. Another strategy that goods with the convenience of shopping from home. has contributed to this division's success entails arrangements with In 2005, Footlocker.com produced very solid financial results well-known third parties, whereby Footlocker.com provides the with sales increasing 4.1 percent versus last year, to $381 million. development, merchandising, fulfillment and customer service to The division profit of Footlocker.com increased 6.7 percent versus support catalog and E-commerce sales. These third parties include last year to $48 million, maintaining a solid 12.6 percent of sales. the National Basketball Association, Arena Football League, Footlocker.com is the world's leading retailer that sells athletic footwear, apparel and equipment via catalogs and E-commerce websites. 11
  • 14. FOOT LOCKER, INC. Community Involvement the United States. The Company also stepped up its charitable efforts this past year in Throughout its history, Foot Locker, Inc. has response to the devastating hurricanes in the recognized the importance of supporting the United States, including administering associ- communities around the world in which it ates' personal contributions that were directed operates. For this reason, the Company estab- to the victims and their families. lished Foot Locker Foundation, Inc. in 2001 to The support of the American Cancer Society enhance its ability to raise funds and increase by participating in its Annual “Making Strides its ability to contribute to worthy causes. Against Breast Cancer” walk and raising funds Since its inception, Foot Locker Foundation, through the sale of Pink Ribbon tee shirts and Inc. has hosted its annual “On Our Feet” jewelry are ongoing programs in which the fundraising event to benefit various charitable Company and its associates have contributed organizations such as the United Negro College for several years. The Fred Jordan Mission, a Fund, the United Way of New York City and faith-based mission founded in 1944 in Los Reading Is Fundamental. Angeles, California, is another organization 2005 was a year in which Foot Locker, Inc. that the Company supports each year by furthered its commitment to community donating shoes and school supplies to thou- involvement by supporting victims of natural sands of children in the inner city. disasters. This past spring, the Company took Going forward, the Company expects to part in the relief efforts of the tsunami disas- continue to be an active supporter of worth- ter in South Asia, donating a total of 82,500 while causes and organizations. It is with a pairs of athletic footwear to Save the Children, sense of pride that Foot Locker, Inc. seeks to which provides relief aid to children in need improve the quality of life through ongoing around the world. In addition, 14,000 pairs of community involvement programs. footwear were donated to needy children who participated in Save the Children programs in It is with a sense of pride that Foot Locker, Inc. seeks to improve the quality of life through ongoing community involvement programs. 12
  • 15. UNITED STATES SECURITIES AND EXCHANGE COMMISSION Washington, D.C. 20549 FORM 10-K Annual Report Pursuant to Section 13 or 15(d) of the Securities Exchange Act of 1934 For the fiscal year ended January 28, 2006 Commission file number 1-10299 FOOT LOCKER, INC. (Exact name of Registrant as specified in its charter) New York 13-3513936 (State or other jurisdiction of (I.R.S. Employer Identification No.) incorporation or organization) 112 West 34th Street, New York, New York 10120 (Address of principal executive offices) (Zip Code) Registrant’s telephone number, including area code: (212) 720-3700 Securities registered pursuant to Section 12(b) of the Act: Title of each class Name of each exchange on which registered Common Stock, par value $0.01 New York Stock Exchange Securities registered pursuant to Section 12(g) of the Act: None Indicate by check mark if the registrant is a well-known seasoned issuer, as defined in Rule 405 of the Securities Act. Yes H No h Indicate by check mark if the registrant is not required to file reports pursuant to Section 13 or Section 15(d) of the Act. Yes h No H Indicate by check mark whether the Registrant (1) has filed all reports required to be filed by Section 13 or 15(d) of the Securities Exchange Act of 1934 during the preceding 12 months (or for such shorter period that the Registrant was required to file such reports), and (2) has been subject to such filing requirements for the past 90 days. Yes H No h Indicate by check mark if disclosure of delinquent filers pursuant to Item 405 of Regulation S-K is not contained herein, and will not be contained, to the best of Registrant’s knowledge, in definitive proxy or information statements incorporated by reference in Part III of this Form 10-K or any amendment to this Form 10-K. H Indicate by check mark whether the registrant is a large accelerated filer, an accelerated filer, or a non-accelerated filer. See definition of “accelerated filer and large accelerated filer” in Rule 12b-2 of the Exchange Act. Large accelerated filer H Accelerated filer h Non-accelerated filer h Indicate by check mark whether the registrant is a shell company (as defined in Rule 12b-2 of the Act. Yes h No H See pages 59 through 62 for Index of Exhibits. Number of shares of Common Stock outstanding at March 17, 2006: 155,487,431 The aggregate market value of voting stock held by non-affiliates of the Registrant computed by reference to the closing price as of the last business day of the Registrant’s most recently completed second fiscal quarter, July 29, 2005, was approximately: $2,851,036,844* * For purposes of this calculation only (a) all directors plus one executive officer and owners of five percent or more of the Registrant are deemed to be affiliates of the Registrant and (b) shares deemed to be “held” by such persons at July 29, 2005 include only outstanding shares of the Registrant’s voting stock with respect to which such persons had, on such date, voting or investment power. DOCUMENTS INCORPORATED BY REFERENCE Portions of the Registrant’s definitive Proxy Statement (the “Proxy Statement”) to be filed in connection with the Annual Meeting of Shareholders to be held on May 24, 2006: Parts III and IV.
  • 16. TABLE OF CONTENTS PART I Item 1 Business . . . . . . . . . . . . . . . . . . . . . . . . . . . . . . . . . . . . . . . . . . . . . . . . . . . . . . . . . . . . 1 Item 1A Risk Factors . . . . . . . . . . . . . . . . . . . . . . . . . . . . . . . . . . . . . . . . . . . . . . . . . . . . . . . . . 2 Item 1B Unresolved Staff Comments . . . . . . . . . . . . . . . . . . . . . . . . . . . . . . . . . . . . . . . . . . . . . . 4 Item 2 Properties . . . . . . . . . . . . . . . . . . . . . . . . . . . . . . . . . . . . . . . . . . . . . . . . . . . . . . . . . . . 4 Item 3 Legal Proceedings . . . . . . . . . . . . . . . . . . . . . . . . . . . . . . . . . . . . . . . . . . . . . . . . . . . . . 4 Item 4 Submission of Matters to a Vote of Security Holders . . . . . . . . . . . . . . . . . . . . . . . . . . . . . 4 PART II Item 5 Market for the Company’s Common Equity and Related Stockholder Matters and Issuer Purchases of Equity Securities. . . . . . . . . . . . . . . . . . . . . . . . . . . . . . . . . . . . . . . . . . . . . 6 Item 6 Selected Financial Data . . . . . . . . . . . . . . . . . . . . . . . . . . . . . . . . . . . . . . . . . . . . . . . . . 6 Item 7 Management’s Discussion and Analysis of Financial Condition and Results of Operations . . . 6 Item 7A Quantitative and Qualitative Disclosures about Market Risk . . . . . . . . . . . . . . . . . . . . . . . . 19 Item 8 Consolidated Financial Statements and Supplementary Data. . . . . . . . . . . . . . . . . . . . . . . . 20 Item 9 Changes in and Disagreements with Accountants on Accounting and Financial Disclosure . . . 56 Item 9A Controls and Procedures . . . . . . . . . . . . . . . . . . . . . . . . . . . . . . . . . . . . . . . . . . . . . . . . . 56 PART III Item 10 Directors and Executive Officers of the Company. . . . . . . . . . . . . . . . . . . . . . . . . . . . . . . . 56 Item 11 Executive Compensation . . . . . . . . . . . . . . . . . . . . . . . . . . . . . . . . . . . . . . . . . . . . . . . . . 57 Item 12 Security Ownership of Certain Beneficial Owners and Management and Related Stockholder Matters . . . . . . . . . . . . . . . . . . . . . . . . . . . . . . . . . . . . . . . . . . . . . . . . . . . . . . . . . . . . . 57 Item 13 Certain Relationships and Related Transactions . . . . . . . . . . . . . . . . . . . . . . . . . . . . . . . . 57 Item 14 Principal Accountant Fees and Services . . . . . . . . . . . . . . . . . . . . . . . . . . . . . . . . . . . . . . 57 PART IV Item 15 Exhibits and Financial Statement Schedules . . . . . . . . . . . . . . . . . . . . . . . . . . . . . . . . . . . 57
  • 17. PART I Item 1. Business General Foot Locker, Inc., incorporated under the laws of the State of New York in 1989, is a leading global retailer of athletic footwear and apparel, operating as of January 28, 2006, 3,921 primarily mall-based stores in the United States, Canada, Europe and Asia Pacific, which includes Australia and New Zealand. Foot Locker, Inc. and its subsidiaries hereafter are referred to as the “Registrant” or “Company.” Information regarding the business is contained under the “Business Overview” section in “Item 7. Management’s Discussion and Analysis of Financial Condition and Results of Operations.” The Company maintains a website on the Internet at www.footlocker-inc.com. The Company’s filings with the Securities and Exchange Commission, including its annual reports on Form 10-K, quarterly reports on Form 10-Q, current reports on Form 8-K, and all amendments to those reports are available free of charge through this website as soon as reasonably practicable after they are filed with or furnished to the SEC by clicking on the “SEC Filings” link. The Corporate Governance section of the Company’s corporate website contains the Company’s Corporate Governance Guidelines, Committee Charters and the Company’s Code of Business Conduct for directors, officers and employees, including the Chief Executive Officer, Chief Financial Officer and Chief Accounting Officer. Copies of these documents may also be obtained free of charge upon written request to the Company’s Corporate Secretary at 112 West 34th Street, New York, NY 10120. The Company intends to disclose promptly amendments to the Code of Business Conduct and waivers of the Code for directors and executive officers on the corporate governance section of the Company’s corporate website. The Certification of the Chief Executive Officer required by Section 303A.12(a) of The New York Stock Exchange Listing Standards relating to the Company’s compliance with The New York Stock Exchange Corporate Governance Listing Standards was submitted to The New York Stock Exchange on June 15, 2005. Information Regarding Business Segments and Geographic Areas The financial information concerning business segments, divisions and geographic areas is contained under the “Business Overview” and “Segment Information” sections in “Item 7. Management’s Discussion and Analysis of Financial Condition and Results of Operations.” Information regarding sales, operating results and identifiable assets of the Company by business segment and by geographic area is contained under the “Segment Information” footnote in “Item 8. Consolidated Financial Statements and Supplementary Data.” The service marks and trademarks appearing on this page and elsewhere in this report (except for ESPN, NBA, Nike, Amazon.com, Burger King, Popeye’s, The San Francisco Music Box Company and USOC) are owned by Foot Locker, Inc. or its subsidiaries. Employees The Company and its consolidated subsidiaries had 16,403 full-time and 27,873 part-time employees at January 28, 2006. The Company considers employee relations to be satisfactory. Competition The financial information concerning competition is contained under the “Business Risk” section in the “Financial Instruments and Risk Management” footnote in “Item 8. Consolidated Financial Statements and Supplementary Data.” Merchandise Purchases The financial information concerning merchandise purchases is contained under the “Liquidity” section in “Item 7. Management’s Discussion and Analysis of Financial Condition and Results of Operations” and under the “Business Risk” section in the “Financial Instruments and Risk Management” footnote in “Item 8. Consolidated Financial Statements and Supplementary Data.” 1
  • 18. Item 1A. Risk Factors The statements contained in this Annual Report on Form 10-K and incorporated by reference (“Annual Report”) that are not historical facts, including, but not limited to, statements regarding our expected financial position, business and financing plans found in “Item 1. Business” and “Item 7. Management’s Discussion and Analysis of Financial Condition and Results of Operations,” constitute “forward-looking statements” within the meaning of the Private Securities Litigation Reform Act of 1995. The words “may,” “believes,” “expects,” “plans,” “intends,” “anticipates” and similar expressions identify forward-looking statements. The actual results of the future events described in such forward-looking statements could differ materially from those stated in such forward-looking statements. Our actual results may differ materially due to the risks and uncertainties discussed in this Annual Report, including those discussed below. Accordingly, readers of the Annual Report should consider these facts in evaluating the information and are cautioned not to place undue reliance on the forward-looking statements contained herein. We undertake no obligation to update or revise publicly any forward-looking statements, whether as a result of new information, future events or otherwise. The industry in which we operate is dependent upon fashion trends, customer preferences and other fashion- related factors. The athletic footwear and apparel industry is subject to changing fashion trends and customer preferences. We cannot guarantee that our merchandise selection will accurately reflect customer preferences on the date of sale or that we will be able to identify and respond quickly to fashion changes, particularly given the long lead times for ordering much of our merchandise from vendors. For example, we order athletic footwear four to six months prior to delivery to our stores. If we fail to accurately anticipate either the market for the merchandise in our stores or our customers’ purchasing habits, we may be forced to rely on markdowns or promotional sales to dispose of excess, slow-moving inventory, which would have a material adverse effect on our business, financial condition and results of operations. A substantial portion of our highest margin sales are to young males (ages 12–25), many of whom we believe purchase athletic footwear and licensed apparel as a fashion statement and are frequent purchasers of athletic footwear. Any shift in fashion trends that would make athletic footwear or licensed apparel less attractive to these customers would have a material adverse effect on our business, financial condition and results of operations. The businesses in which we operate are highly competitive. The retail athletic footwear and apparel business is highly competitive with relatively low barriers to entry. Our athletic footwear and apparel operations compete primarily with athletic footwear specialty stores, sporting goods stores and superstores, department stores, discount stores, traditional shoe stores and mass merchandisers, many of which are units of national or regional chains that have significant financial and marketing resources. The principal competitive factors in our markets are price, quality, selection of merchandise, reputation, store location, advertising and customer service. We cannot assure you that we will continue to be able to compete successfully against existing or future competitors. Our expansion into markets served by our competitors and entry of new competitors or expansion of existing competitors into our markets could have a material adverse effect on our business, financial condition and results of operations. Although we sell merchandise via the Internet through Footlocker.com and its affiliates, a significant shift in customer buying patterns to purchasing athletic footwear, athletic apparel and sporting goods via the Internet could have a material adverse effect on us. In addition, some of the manufacturers of our products distribute products directly through the Internet and others may follow. Should this occur and if our customers decide to purchase directly from our manufacturers, it could have a material adverse effect on our business, financial condition and results of operations. We depend on mall traffic and our ability to identify suitable store locations. Our sales, particularly in the United States and Canada, are dependent in part on a high volume of mall traffic. Our stores are located primarily in enclosed regional and neighborhood malls. Mall traffic may be adversely affected by, among other things, economic downturns, the closing of anchor department stores or changes in customer preferences or acts of terrorism. A decline in the popularity of mall shopping among our target customers could have a material adverse effect on us. To take advantage of customer traffic and the shopping preferences of our customers, we need to maintain or acquire stores in desirable locations such as in regional and neighborhood malls anchored by major department stores. We cannot assure you that desirable mall locations will continue to be available. 2
  • 19. The effects of natural disasters, terrorism, acts of war and retail industry conditions may adversely affect our business. Natural disasters, including hurricanes, floods and tornados may affect store and distribution center operations. In addition, acts of terrorism, acts of war and military action both in the United States and abroad can have a significant effect on economic conditions and may negatively affect our ability to purchase merchandise from vendors for sale to our customers. Any significant declines in general economic conditions, public safety concerns or uncertainties regarding future economic prospects that affect customer spending habits could have a material adverse effect on customer purchases of our products. A change in the relationship with any of our key vendors or the unavailability of our key products at competitive prices could affect our financial health. Our business is dependent to a significant degree upon our ability to purchase brand-name merchandise at competitive prices, including the receipt of volume discounts and cooperative advertising and other allowances from our vendors. The Company purchased approximately 75 percent of its merchandise in 2005 from its top five vendors, and expects to continue to obtain a significant percentage of its athletic product from these vendors in future periods. Of that amount approximately 49 percent was purchased from one vendor — Nike, Inc. (“Nike”). We have no long-term supply contracts with any of our vendors. Our inability to obtain merchandise in a timely manner from major suppliers (particularly Nike) as a result of business decisions by our suppliers or any disruption in the supply chain could have a material adverse effect on our business, financial condition and results of operations. Because of our strong dependence on Nike, any adverse development in Nike’s financial condition and results of operations or the inability of Nike to develop and manufacture products that appeal to our target customers could also have an adverse effect on our business, financial condition and results of operations. We cannot assure you that we will be able to acquire merchandise at competitive prices or on competitive terms in the future. Merchandise that is high profile and in high demand is allocated by our vendors based upon their internal criteria. Although we have generally been able to purchase sufficient quantities of this merchandise in the past, we cannot assure you that our vendors will continue to allocate sufficient amounts of such merchandise in the future. In addition, our vendors provide support to us through cooperative advertising allowances and promotional events. We cannot assure you that such assistance from our vendors will continue in the future. These risks could have a material adverse effect on our business, financial conditions and results of operations. We may experience fluctuations in and cyclicality of our comparable store sales results. Our comparable store sales have fluctuated significantly in the past, on both an annual and a quarterly basis, and we expect them to continue to fluctuate in the future. A variety of factors affect our comparable store sales results, including, among others, fashion trends, the highly competitive retail store sales environment, economic conditions, timing of promotional events, changes in our merchandise mix, calendar shifts of holiday periods and weather conditions. Many of our products, particularly high-end athletic footwear and licensed apparel, represent discretionary purchases. Accordingly, customer demand for these products could decline in a recession or if our customers develop other priorities for their discretionary spending. These risks could have a material adverse effect on our business, financial condition and results of operations. Our operations may be adversely affected by economic or political conditions in other countries. Approximately 25 percent of our sales and a significant portion of our operating profits for 2005 were attributable to our sales in Europe, Canada, New Zealand and Australia. As a result, our business is subject to the risks generally associated with doing business outside of the United States, such as foreign governmental regulations, foreign customer preferences, political unrest, disruptions or delays in shipments and changes in economic conditions in countries in which we operate. Although we enter into forward foreign exchange contracts and option contracts to reduce the effect of foreign currency exchange rate fluctuations, our operations may be adversely affected by significant changes in the value of the U.S. dollar as it relates to certain foreign currencies. In addition, because we and our suppliers have a substantial amount of our products manufactured in foreign countries, our ability to obtain sufficient quantities of merchandise on favorable terms may be affected by governmental regulations, trade restrictions and economic, labor and other conditions in the countries from which our suppliers obtain their product. 3
  • 20. Our business is subject to economic cycles and retail industry conditions. Purchases of discretionary athletic footwear, apparel and related products, tend to decline during recessionary periods when disposable income is low and customers are hesitant to use available credit. Complications in our distribution centers may affect our business. We operate three distribution centers worldwide to support our athletic business. If complications arise with any one facility or any facility is severely damaged or destroyed, the other distribution centers may not be able to support the resulting additional distribution demands. This may adversely affect our ability to deliver inventory on a timely basis. A major failure of our information systems could harm our business. We depend on information systems to process transactions, manage inventory, operate our website, purchase, sell and ship goods on a timely basis and maintain cost-efficient operations. Any material disruption or slowdown of our systems could cause information to be lost or delayed which could have a negative impact on our business. We may experience operational problems with our information systems as a result of system failures, viruses, computer “hackers” or other causes. We cannot assure that our systems will be adequate to support future growth. Item 1B. Unresolved Staff Comments None. Item 2. Properties The properties of the Company and its consolidated subsidiaries consist of land, leased and owned stores and administrative and distribution facilities. Gross operating square footage and total selling area for the Athletic Stores segment at the end of 2005 was approximately 14.48 and 8.71 million square feet, respectively. These properties are primarily located in the United States, Canada, various European countries, Australia and New Zealand. The Company currently operates three distribution centers, of which one is owned and two are leased, occupying an aggregate of 2.12 million square feet. Two of the three distribution centers are located in the United States and one is in Europe. Item 3. Legal Proceedings Legal proceedings pending against the Company or its consolidated subsidiaries consist of ordinary, routine litigation, including administrative proceedings, incidental to the business of the Company, as well as litigation incidental to the sale and disposition of businesses that have occurred in past years. These legal proceedings include commercial, intellectual property, customer, and labor-and-employment-related claims, including class action lawsuits in which plaintiffs allege violations by the Company of state wage and hour and other laws. Management does not believe that the outcome of such proceedings would have a material adverse effect on the Company’s consolidated financial position, liquidity, or results of operations, taken as a whole. Item 4. Submission of Matters to a Vote of Security Holders There were no matters submitted to a vote of security holders during the fourth quarter of the year ended January 28, 2006. 4
  • 21. Executive Officers of the Company Information with respect to Executive Officers of the Company, as of March 27, 2006, is set forth below: Chairman of the Board, President and Chief Executive Officer Matthew D. Serra President and Chief Executive Officer, Foot Locker, Inc. — U.S.A. Richard T. Mina Senior Vice President, General Counsel and Secretary Gary M. Bahler Senior Vice President — Real Estate Jeffrey L. Berk Senior Vice President and Chief Information Officer Marc D. Katz Senior Vice President and Chief Financial Officer Robert W. McHugh Senior Vice President — Strategic Planning Lauren B. Peters Senior Vice President — Human Resources Laurie J. Petrucci Vice President — Investor Relations and Treasurer Peter D. Brown Vice President and Chief Accounting Officer Giovanna Cipriano Matthew D. Serra, age 61, has served as Chairman of the Board since February 1, 2004, President since April 12, 2000 and Chief Executive Officer since March 4, 2001. Mr. Serra served as Chief Operating Officer from February 2000 to March 3, 2001 and as President and Chief Executive Officer of Foot Locker Worldwide from September 1998 to February 2000. Richard T. Mina, age 49, has served as President and Chief Executive Officer of Foot Locker, Inc.- U.S.A. since February 2, 2003. He served as President and Chief Executive Officer of Champs Sports, an operating division of the Company, from April 1999 to February 1, 2003. Gary M. Bahler, age 54, has served as Senior Vice President since August 1998, General Counsel since February 1993 and Secretary since February 1990. Jeffrey L. Berk, age 50, has served as Senior Vice President — Real Estate since February 2000. Marc D. Katz, age 41, has served as Senior Vice President and Chief Information Officer since May 12, 2003. Mr. Katz served as Vice President and Chief Information Officer from July 2002 to May 11, 2003. During the period of 1999 to 2002, he served in the following capacities at the Financial Services Center of Foot Locker Corporate Services: Vice President and Controller from July 2001 to April 2002 and Controller from December 1999 to July 2001. Robert W. McHugh, age 47, has served as Senior Vice President and Chief Financial Officer since November 21, 2005. He served as Vice President and Chief Accounting Officer from January 2000 to November 20, 2005. Lauren B. Peters, age 44, has served as Senior Vice President — Strategic Planning since April 18, 2002. Ms. Peters served as Vice President — Planning from January 2000 to April 17, 2002. Laurie J. Petrucci, age 47, has served as Senior Vice President — Human Resources since May 2001. Ms. Petrucci served as Senior Vice President — Human Resources of the Foot Locker Worldwide division from March 2000 to May 2001. Peter D. Brown, age 51, has served as Vice President — Investor Relations and Treasurer since October 2001. Mr. Brown served as Vice President — Investor Relations and Corporate Development from April 2001 to October 2001 and as Assistant Treasurer — Investor Relations and Corporate Development from August 2000 to April 2001. Giovanna Cipriano, age 36, has served as Vice President and Chief Accounting Officer since November 21, 2005. She served as as Divisional Vice President, Financial Controller from June 3, 2002 through November 20, 2005 and as Financial Controller from April 2, 1999 through June 2, 2002. There are no family relationships among the executive officers or directors of the Company. 5
  • 22. PART II Item 5. Market for the Company’s Common Equity, Related Stockholder Matters and Issuer Purchases of Equity Securities Information regarding the Company’s market for stock exchange listings, common equity, quarterly high and low prices and dividend policy are contained in the “Shareholder Information and Market Prices” footnote under “Item 8. Consolidated Financial Statements and Supplementary Data.” This table provides information with respect to purchases by the Company of shares of its Common Stock during the fourth quarter of 2005: Average Total Number of Approximate Dollar Value Total Number Price Shares Purchased of Shares that May Yet be of Shares Paid per as Part of Publicly Purchased Under the Announced Program (1) Program (1) Purchased Share October 30, 2005 to November 26, 2005 . . . . . . 50,000 $21.975 50,000 $28,967,188 November 27, 2005 to December 31, 2005 . . . . 629,600 22.183 629,600 15,000,972 January 1, 2006 to January 28, 2006 . . . . . . . . . — — — 15,000,972 Total . . . . . . . . . . . . . . . . . . . . . . . . . . . . . . . . . . . . . . . . . . 679,600 $22.167 679,600 (1) On November 20, 2002, the Company announced that the Board of Directors authorized the purchase of up to $50 million of the Company’s Common Stock; of which 1,589,800 shares have been purchased for approximately $35 million. This authorization terminated on February 3, 2006. On February 15, 2006, the Company announced that its Board of Directors authorized a new $150 million, 3-year repurchase program. Item 6. Selected Financial Data Selected financial data is included as the “Five Year Summary of Selected Financial Data” footnote in “Item 8. Consolidated Financial Statements and Supplementary Data.” Item 7. Management’s Discussion and Analysis of Financial Condition and Results of Operations Business Overview Foot Locker, Inc., through its subsidiaries, operates in two reportable segments — Athletic Stores and Direct-to- Customers. The Athletic Stores segment is one of the largest athletic footwear and apparel retailers in the world, whose formats include Foot Locker, Lady Foot Locker, Kids Foot Locker, Champs Sports and Footaction (beginning May 2004). The Direct-to-Customers segment reflects Footlocker.com, Inc., which sells, through its affiliates, including Eastbay, Inc., to customers through catalogs and Internet websites. The Foot Locker brand is one of the most widely recognized names in the market segments in which the Company operates, epitomizing high quality for the active lifestyle customer. This brand equity has aided the Company’s ability to successfully develop and increase its portfolio of complementary retail store formats, specifically, Lady Foot Locker and Kids Foot Locker, as well as Footlocker.com, Inc., its direct-to-customers business. Through various marketing channels, including television campaigns and sponsorships of various sporting events, Foot Locker, Inc. reinforces its image with a consistent message: namely, that it is the destination store for athletic footwear and apparel with a wide selection of merchandise in a full-service environment. Athletic Stores The Company operates 3,921 stores in the Athletic Stores segment. The following is a brief description of the Athletic Stores segment’s operating businesses: Foot Locker — Foot Locker is a leading athletic footwear and apparel retailer. Its stores offer the latest in athletic- inspired performance products, manufactured primarily by the leading athletic brands. Foot Locker offers products for a wide variety of activities including running, basketball, hiking, tennis, aerobics, fitness, baseball, football and soccer. Its 2,121 stores are located in 20 countries including 1,398 in the United States, Puerto Rico, the United States Virgin Islands and Guam, 128 in Canada, 501 in Europe and a combined 94 in Australia and New Zealand. The domestic stores have an average of 2,100 selling square feet and the international stores have an average of 1,500 selling square feet. 6
  • 23. Champs Sports — Champs Sports is one of the largest mall-based specialty athletic footwear and apparel retailers in the United States. Its product categories include athletic footwear, apparel and accessories, and a focused assortment of equipment. This combination allows Champs Sports to differentiate itself from other mall-based stores by presenting complete product assortments in a select number of sporting activities. Its 556 stores are located throughout the United States, Canada and the United States Virgin Islands. The Champs Sports stores have an average of 3,800 selling square feet. Footaction — Footaction is a national athletic footwear and apparel retailer that offers street-inspired fashion styles. The primary customers are young urban males with the secondary customers being young urban women with diverse fashion needs. Its 363 stores are located throughout the United States and Puerto Rico and focus on marquee allocated footwear and branded apparel. The Footaction stores have an average of 2,900 selling square feet. Lady Foot Locker — Lady Foot Locker is a leading U.S. retailer of athletic footwear, apparel and accessories for women. Its stores carry all major athletic footwear and apparel brands, as well as casual wear and an assortment of proprietary merchandise designed for a variety of activities, including running, basketball, walking and fitness. Its 554 stores are located in the United States, Puerto Rico and the United States Virgin Islands and have an average of 1,300 selling square feet. Kids Foot Locker — Kids Foot Locker is a national children’s athletic retailer that offers the largest selection of brand- name athletic footwear, apparel and accessories for infants, boys and girls, primarily on an exclusive basis. Its stores feature an entertaining environment geared to both parents and children. Its 327 stores are located in the United States, Puerto Rico, and the United States Virgin Islands and have an average of 1,400 selling square feet. Store Profile At At January 29, 2005 Opened Closed January 28, 2006 Foot Locker . . . . . . . . . . . . . . . . . . . . . . . . . . . . . . . 2,135 75 89 2,121 Champs Sports . . . . . . . . . . . . . . . . . . . . . . . . . . . . 570 11 25 556 Footaction . . . . . . . . . . . . . . . . . . . . . . . . . . . . . . . . 349 24 10 363 Lady Foot Locker. . . . . . . . . . . . . . . . . . . . . . . . . . 567 8 21 554 Kids Foot Locker . . . . . . . . . . . . . . . . . . . . . . . . . . 346 1 20 327 Total Athletic Stores . . . . . . . . . . . . . . . . . . . . . . 3,967 119 165 3,921 Direct-to-Customers Footlocker.com — Footlocker.com, Inc., sells, through its affiliates, directly to customers through catalogs and its Internet websites. Eastbay, Inc., one of its affiliates, is one of the largest direct marketers of athletic footwear, apparel, equipment and team licensed private-label merchandise in the United States and provides the Company’s eight full-service e-commerce sites access to an integrated fulfillment and distribution system. The Company has a strategic alliance to offer footwear and apparel on the Amazon.com website and the Foot Locker brands are featured in the Amazon.com specialty stores for apparel and accessories and sporting goods. The Company also has an arrangement with the NBA and Amazon.com whereby Footlocker.com provides the fulfillment services for NBA licensed products sold over the Internet at NBAstore.com and the NBA store on Amazon.com. In addition, the Company has a marketing agreement with the U.S. Olympic Committee (USOC) providing the Company with the exclusive rights to sell USOC licensed products through catalogs and via a new e-commerce site. The Company has an agreement with ESPN for ESPN Shop — an ESPN-branded direct mail catalog and e-commerce site linked to www.ESPNshop.com, where fans can purchase athletic footwear, apparel and equipment which will be managed by Footlocker.com. Both the catalog and the e-commerce site feature a variety of ESPN-branded and non-ESPN-branded athletically inspired merchandise. Overview of Consolidated Results Sales increased by 5.6 percent to $5,653 million representing a comparable-store increase of 2.7 percent. Income from continuing operations before income taxes increased by 8.3 percent to $405 million. Diluted earnings per share was $1.67 from continuing operations in 2005 as compared with $1.64 in the corresponding prior year period. 7
  • 24. Sales All references to comparable-store sales for a given period relate to sales of stores that are open at the period-end and that have been open for more than one year and exclude the effect of foreign currency fluctuations. Accordingly, stores opened and closed during the period are not included. Sales from the Direct-to-Customer segment are included in the calculation of comparable-store sales for all periods presented. All references to comparable-store sales for 2004 exclude the acquisition of the 349 Footaction stores and the 11 stores purchased in the Republic of Ireland. Sales from acquired businesses that include the purchase of inventory will be included in the computation of comparable-store sales after 15 months of operations. Accordingly, Footaction sales are included in the computation of comparable-store sales since August 2005. Sales of $5,653 million in 2005 increased by 5.6 percent from sales of $5,355 million in 2004. The effect of foreign currency fluctuations on sales was not significant. This increase is primarily related to increased sales in the Company’s Footaction and Champs Sports formats. Comparable-store sales increased by 2.7 percent. Sales of $5,355 million in 2004 increased by 12.1 percent from sales of $4,779 million in 2003. Excluding the effect of foreign currency fluctuations, sales increased by 9.8 percent as compared with 2003, primarily as a result of the Company’s acquisition of 349 Footaction stores in May 2004 and the acquisition of 11 stores in the Republic of Ireland in late October 2004, which accounted for $332 million and $5 million in sales, respectively, for 2004. Comparable-store sales increased by 0.9 percent. The remaining increase is a result of the Company’s continuation of the new store-opening program. Gross Margin Gross margin as a percentage of sales was 30.2 percent in 2005, decreasing by 30 basis points from 30.5 percent in 2004. This decline is primarily the result of increased markdowns recorded by the European operation. The effect of vendor allowances on gross margin, as a percentage of sales, as compared with the corresponding prior year period was not significant. Gross margin as a percentage of sales was 30.5 percent in 2004, a decrease of 50 basis points from 31.0 percent in 2003. Of the 50 basis points decrease in 2004, approximately 60 basis points is the result of the Footaction chain, offset, in part, by a decrease in the cost of merchandise. The effect of vendor allowances on gross margin, as a percentage of sales, as compared with the corresponding prior year period was not significant. Division Profit The Company evaluates performance based on several factors, the primary financial measure of which is division profit. Division profit reflects income from continuing operations before income taxes, corporate expense, non-operating income and net interest expense. The following table reconciles division profit by segment to income from continuing operations before income taxes. 2005 2004 2003 (in millions) Athletic Stores . . . . . . . . . . . . . . . . . . . . . . . . . . . . . . . . . . . . . . . . . . . . . . $419 $420 $363 Direct-to-Customers. . . . . . . . . . . . . . . . . . . . . . . . . . . . . . . . . . . . . . . . . 48 45 53 Division profit . . . . . . . . . . . . . . . . . . . . . . . . . . . . . . . . . . . . . . . . . . . . . . 467 465 416 Restructuring charges (1) . . . . . . . . . . . . . . . . . . . . . . . . . . . . . . . . . . . . — (2) (1) Total division profit. . . . . . . . . . . . . . . . . . . . . . . . . . . . . . . . . . . . 467 463 415 Corporate expense . . . . . . . . . . . . . . . . . . . . . . . . . . . . . . . . . . . . . . . . . . (58) (74) (73) Total operating profit . . . . . . . . . . . . . . . . . . . . . . . . . . . . . . . . . . . . . . . 409 389 342 Other income . . . . . . . . . . . . . . . . . . . . . . . . . . . . . . . . . . . . . . . . . . . . . . . 6 — — Interest expense, net . . . . . . . . . . . . . . . . . . . . . . . . . . . . . . . . . . . . . . . (10) (15) (18) Income from continuing operations before income taxes. . . . $405 $374 $324 (1) As more fully described in the notes to the consolidated financial statements, restructuring charges of $2 million and $1 million in 2004 and 2003, respectively, were recorded related to the dispositions of non-core businesses. 8
  • 25. Corporate Expense Corporate expense consists of unallocated general and administrative expenses related to the Company’s corporate headquarters, centrally managed departments, unallocated insurance and benefit programs, certain foreign exchange transaction gains and losses, certain depreciation and amortization expenses and other items. The decrease in corporate expense of $16 million in 2005 comprised several items, and primarily included decreased incentive bonuses of $14 million, a $3 million decrease in costs associated with the Company’s loyalty program as the prior year represented the initial costs to launch the program, and decreased restricted stock expense of $2 million. In addition, the prior year included $5 million for the integration of the Footaction stores. Included in the current year is a settlement of $3 million pursuant to a class action settlement with Visa and MasterCard related to past overcharges for certain debit card transactions. These decreases were offset, in part, by a charge of $4 million due to the potential insolvency of one of the Company’s insurance carriers and legal and settlement costs of $5 million. Depreciation and amortization included in corporate expense amounted to $24 million in 2005, $23 million in 2004 and $25 million in 2003. The increase in corporate expense in 2004 as compared with 2003 was primarily related to decreased incentive bonuses of $9 million, offset by increased expenses related to integration of Footaction of $5 million, restricted stock expense from additional grants of $4 million and costs of $3 million related to the Company’s expanded loyalty program. Integration costs represent incremental costs directly related to the acquisitions, primarily expenses to re-merchandise the Footaction stores during the first three months of operations. Other Income Other income for 2005 represents a $3 million net gain on foreign currency option contracts that were entered into by the Company to mitigate the effect of fluctuating foreign exchange rates on the reporting of euro dominated earnings. Additionally, other income includes $3 million of insurance recoveries in excess of losses associated with Hurricane Katrina. Selling, General and Administrative Expenses Selling, general and administrative (“SG&A”) expenses increased by $41 million to $1,129 million in 2005, or by 3.8 percent, as compared with 2004. SG&A as a percentage of sales decreased to 20.0 percent as compared with 20.3 percent in 2004. The increase in SG&A is primarily related to an increase in payroll and related costs. The effect of including Footaction for the full fiscal year is an incremental $21 million, excluding the integration costs. During 2005, the Company donated 82,500 pairs of athletic footwear with a cost of $2 million to Save the Children Foundation. This donation benefited the tsunami victims in Banda Aceh, Indonesia, as well as Save the Children programs in the United States. The net of both pension expense and postretirement income did not change significantly from the prior year. SG&A increased by $101 million to $1,088 million in 2004, or by 10.2 percent, as compared with 2003. Excluding the effect of foreign currency fluctuations, primarily related to the euro, SG&A increased by $82 million, of which the acquired businesses contributed $68 million. Increased payroll and related costs primarily comprised the balance of the increase. SG&A as a percentage of sales decreased to 20.3 percent compared with 20.7 percent in 2003. Pension expense declined by $2 million primarily as a result of the positive market performance experienced in the prior year. Additionally, postretirement income decreased by $2 million in 2004 as compared with 2003 as the amortization of the unrecognized gains, which are amortized over the average remaining life expectancy, continues to decrease over time. Depreciation and Amortization Depreciation and amortization of $171 million increased by 11.0 percent in 2005 from $154 million in 2004. This increase primarily reflects additional depreciation and amortization for the Athletic Stores segment due to capital spending and, in addition, adjustments to depreciable lives of certain fixed assets. Additionally, depreciation and amortization for the Footaction format increased by $6 million as compared with the prior year primarily due to increased capital expenditures related to store improvements and point-of-sale equipment. Depreciation and amortization of $154 million in 2004 increased 1.3 percent as compared with $152 million in 2003. Depreciation and amortization of acquired businesses amounted to $7 million for 2004. These increases were offset by declines that were a result of older assets becoming fully depreciated. 9
  • 26. Interest Expense, Net 2005 2004 2003 (in millions) Interest expense . . . . . . . . . . . . . . . . . . . . . . . . . . . . . . . . . . . . . . . . . . . . $ 23 $ 22 $ 26 Interest income. . . . . . . . . . . . . . . . . . . . . . . . . . . . . . . . . . . . . . . . . . . . . (13) (7) (8) Interest expense, net . . . . . . . . . . . . . . . . . . . . . . . . . . . . . . . . . . $ 10 $ 15 $ 18 Weighted-average interest rate (excluding facility fees): Short-term debt. . . . . . . . . . . . . . . . . . . . . . . . . . . . . . . . . . . . . . . . —% —% —% Long-term debt . . . . . . . . . . . . . . . . . . . . . . . . . . . . . . . . . . . . . . . . 6.2% 5.2% 6.1% Total debt . . . . . . . . . . . . . . . . . . . . . . . . . . . . . . . . . . . . . . . . . . . . . 6.2% 5.2% 6.1% Short-term debt outstanding during the year: High . . . . . . . . . . . . . . . . . . . . . . . . . . . . . . . . . . . . . . . . . . . . . . . . . . . $— $— $— Weighted-average. . . . . . . . . . . . . . . . . . . . . . . . . . . . . . . . . . . . . . $— $— $— Interest expense of $23 million increased by 4.5 percent in 2005 from $22 million in 2004. Interest rate swap agreements reduced interest expense by approximately $1 million and $3 million in 2005 and 2004, respectively. The increase in 2005 was primarily attributable to higher interest rates. Interest income is generated through the investment of cash equivalents, short-term investments, the accretion of the Northern Group note to its face value and accrual of interest on the outstanding principal, as well as, interest on income tax refunds. The increase in interest income of $6 million in 2005 was primarily related to increased interest income earned on short-term investments due to higher interest rates and increased short-term investment balances. Interest income on the Northern Group note amounted to $2 million in both 2005 and 2004. Interest income related to cash equivalents and short-term investments was $11 million in 2005 and $5 million in 2004. Interest expense of $22 million declined by 15.4 percent in 2004 from $26 million in 2003. The decrease in 2004 was primarily attributable to the Company’s $150 million 5.50 percent convertible subordinated notes that were converted to equity in June 2004. Also contributing to the reduction in interest expense was the repurchase of $19 million of the 8.50 percent debentures payable in 2022 in the latter part of 2003. Interest rate swap agreements reduced interest expense by approximately $3 million and $4 million in 2004 and 2003, respectively. These decreases were offset, in part, by an increase resulting from the interest on the $175 million term loan that commenced in May 2004. Interest income related to cash equivalents and short-term investments decreased by $1 million in 2004 from 2003 as a result of the reduction of interest income earned on tax refunds and settlements as they were received during 2003. Interest income related to cash equivalents and short-term investments was $5 million in 2004 and 2003. Income Taxes The effective tax rate for 2005 was 35.0 percent as compared with 31.7 percent in the prior year. The increase was attributable to less benefit from non-recurring items than in 2004 and a higher percentage of the Company’s income earned in the United States, rather than from lower-taxed international operations. During 2005, the Company restructured its Canadian continuing business, which resulted in a $6 million reduction to its income tax valuation allowance related to Canadian tax loss carry-forwards and unclaimed tax depreciation. Additionally, the Company recorded an income tax benefit of $3 million in discontinued operations related to its former Canadian operations. The effective tax rate for 2004 was 31.7 percent, as compared with 35.5 percent in the prior year. The reduction was principally related to a lower rate of tax on the Company’s foreign operations and the settlement of tax examinations. During 2004, the Commonwealth of Puerto Rico concluded an examination of the Company’s branch income tax returns, including an income tax audit for the years 1994 through 1999 and a branch profit tax audit for the years 1994 through 2002. As a result, the Company reduced its income tax provision for continuing operations by $2 million. Also during 2004, the IRS completed its survey of the Company’s income tax returns for the years from 1999-2001 and its examination of the 2002 year. The IRS and the Company completed a pre-filing review and post-filing review of the Company’s income tax return for 2003. As a result of these actions by the IRS and the completion of the Company’s analysis, the Company reduced its income tax provision for continuing operations by $12 million and discontinued operations by $37 million. The effective rate for 2003 was 35.5 percent, as compared with 34.2 percent in 2002. The increased tax rate was primarily due to the Company recording tax benefits of $5 million in 2003 as compared to $9 million in 2002. In addition 10