VIP Independent Call Girls in Bandra West 🌹 9920725232 ( Call Me ) Mumbai Esc...
ecolab 5_FinancialDiscussion
1. Financial
discussion
The following discussion and analysis provides information that company’s reports to the Securities and Exchange Commission.
management believes is useful in understanding Ecolab’s operating In addition, the company notes that its stock price can be
results, cash flows and financial position. The discussion should affected by fluctuations in quarterly earnings. Despite favorable
be read in conjunction with the consolidated financial statements year over year quarterly comparisons in recent years, there can
and related notes. be no assurances that earnings will continue to increase or that
the degree of improvement will meet investors’ expectations.
Forward-Looking Statements
This financial discussion and other portions of this Annual Report
2000 Overview
to Shareholders (most particularly the “Outlook” sections of the
During 2000, Ecolab continued its trend of exceptionally strong
Review of Operations) contain various “Forward-Looking
financial performance. Results for the year marked a number of
Statements” within the meaning of the Private Securities
record performances and significant accomplishments which
Litigation Reform Act of 1995. These include expectations con-
included:
cerning business progress and expansion, business acquisitions,
The company met or exceeded all three of its long-term
s
investments in the sales-and-service force, global economic
financial objectives during 2000. This was the fourth out of the
conditions and liquidity requirements. These statements, which
last five years the company accomplished all three of these aggres-
represent Ecolab’s expectations or beliefs concerning various future
sive annual goals. These objectives include 15 percent growth in
events, are based on current expectations. Therefore, they involve
diluted income per common share, 20 percent return on beginning
a number of risks and uncertainties that could cause actual
shareholders’ equity and an investment grade balance sheet.
results to differ materially from those of such Forward-Looking
Diluted net income per share rose to a record $1.56 for
s
Statements. These risks and uncertainties include restraints on
2000. Excluding the gain on the sale of the Jackson MSC, Inc.
pricing flexibility due to competitive factors and customer consoli-
(Jackson) business, restructuring expenses recorded in 2000
dations; cost increases due to higher oil prices or unavailability of
and the cumulative effect of a change in accounting for revenue
adequate and reasonably priced raw materials; the occurrence of
recognition, diluted income per share was $1.50, an increase of
capacity constraints, or the loss of a key supplier, which in either
15 percent over $1.31 per diluted share in 1999. The company
case limit the production of certain products; the effect of future
reached its twenty-fourth consecutive quarter of double-digit
acquisitions or divestitures or other corporate transactions, as
increases in diluted income per share growth in the fourth quarter
well as our ability to achieve plans for past acquisitions, including
of 2000.
difficulties in rationalizing acquired businesses and in realizing
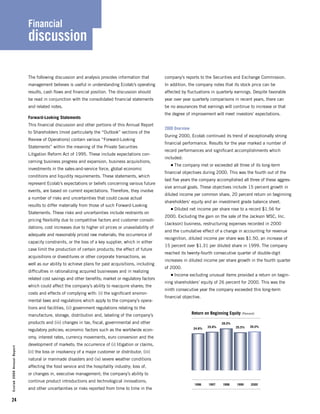
Income excluding unusual items provided a return on begin-
s
related cost savings and other benefits; market or regulatory factors
ning shareholders’ equity of 26 percent for 2000. This was the
which could affect the company’s ability to reacquire shares; the
ninth consecutive year the company exceeded this long-term
costs and effects of complying with: (i) the significant environ-
financial objective.
mental laws and regulations which apply to the company’s opera-
tions and facilities, (ii) government regulations relating to the
Return on Beginning Equity (Percent)
manufacture, storage, distribution and, labeling of the company’s
products and (iii) changes in tax, fiscal, governmental and other 28.0%
26.0%
25.8% 25.5%
24.8%
regulatory policies; economic factors such as the worldwide econ-
omy, interest rates, currency movements, euro conversion and the
development of markets; the occurrence of (i) litigation or claims,
Ecolab 2000 Annual Report
(ii) the loss or insolvency of a major customer or distributor, (iii)
natural or manmade disasters and (iv) severe weather conditions
affecting the food service and the hospitality industry; loss of,
or changes in, executive management; the company’s ability to
continue product introductions and technological innovations;
1996 1997 1998 1999 2000
and other uncertainties or risks reported from time to time in the
24
2. Operating Results
Total Return to Shareholders (Percent)
Consolidated
49.0%
(thousands, except per share) 2000 1999 1998
31.9%
27.3% Net sales $2,264,313 $2,080,012 $1,888,226
33.4%
21.0%
28.6% Operating income $ 343,139 $ 289,951 $ 261,980
23.0%
11.6% Income
9.3%
Continuing operations before
change in accounting $ 208,555 $ 175,786 $ 154,506
(9.1)%
Change in accounting for
revenue recognition (2,428)
1996 1997 1998 1999 2000
Discontinued operations 38,000
Net income $ 206,127 $ 175,786 $ 192,506
Share appreciation plus dividends
S&P 500 Total Return
Diluted income per
common share
Continuing operations before
The company maintained its debt rating within the “A”
s
change in accounting $ 1.58 $ 1.31 $ 1.15
categories of the major rating agencies during 2000. This was Change in accounting for
the eighth consecutive year this objective was accomplished. revenue recognition (0.02)
The company’s strong financial accomplishments were recog- Discontinued operations 0.28
s
Net income $ 1.56 $ 1.31 $ 1.44
nized in the marketplace as Ecolab’s stock price outperformed the
Standard & Poor’s 500 index and rose 10 percent during 2000.
Including cash dividends, Ecolab’s stock yielded a return to share- Supplemental Consolidated Operating Results Information
holders of nearly 12 percent for 2000.
Net sales for 2000 reached an all-time high of nearly Excluding
s
Unusual Unusual
$2.3 billion and increased 9 percent over 1999. (thousands, except per share) Total Items Items
Operating income reached a record $343 million for 2000.
s
Operating income $ 343,139 $ 18,788 $ 324,351
Excluding the gain on the sale of the Jackson business and Interest expense, net (24,605) (24,605)
restructuring expenses, operating income rose 12 percent to Income before income taxes 318,534 18,788 299,746
$324 million. This operating income level was 14.3 percent of Provision for income taxes (129,495) (8,111) (121,384)
net sales, an all-time high compared to the previous record level Equity in earnings of
Henkel-Ecolab 19,516 19,516
of 13.9 percent established in each of the last two years.
Change in accounting (2,428) (2,428)
The company increased its annual dividend rate for the
s
Net income $ 206,127 $ 8,249 $ 197,878
ninth consecutive year. The dividend was increased 8 percent in
Diluted net income per
December 2000 to an annual rate of $0.52 per common share.
common share $ 1.56 $ 0.06 $ 1.50
There were several strategic accomplishments in 2000 which
s
will enhance the company’s future. Management entered into an Consolidated net sales reached an all-time high of nearly
agreement with Henkel KGaA (Henkel) to acquire the remaining $2.3 billion for 2000, an increase of 9 percent over net sales
50 percent of the Henkel-Ecolab joint venture that Ecolab does of nearly $2.1 billion in 1999. This sales growth reflected double-
not own. The acquisition is scheduled to occur on January 2, digit increases in Kay’s and Pest Elimination’s operations and in
2002 and is expected to provide significant growth and leadership sales in the Latin America region, as well as another year of solid
opportunities for the company in Europe. The company completed growth in the company’s core Institutional business. Business
several other business acquisitions during 2000 in order to con- acquisitions also contributed to the overall sales growth for 2000.
Ecolab 2000 Annual Report
tinue to broaden its product and service offerings in line with its
Circle the Customer – Circle the Globe strategy. In the fourth quar-
ter of 2000, the company recorded restructuring expenses as a
result of management actions to improve the company’s future
performance. Also in the fourth quarter of 2000, the company
sold its Jackson dishmachine and manufacturing business, which
was not part of its core offerings.
25
3. Financial
discussion
Businesses acquired in 2000 and the annualized effect of busi- Also, during the fourth quarter of 2000, the company sold its
nesses acquired in 1999 accounted for approximately 40 percent Jackson dishmachine manufacturing business for cash proceeds
of the growth in consolidated sales for 2000. Changes in currency of approximately $36 million. The company realized a gain of
translation had a very modest negative effect on the consolidated $25.9 million ($15.0 million after tax, or $0.11 per diluted
sales growth rate for 2000. The growth in sales also reflected new share) on the sale.
product introductions, a larger and better trained sales-and-service Operating income for 2000 reached $343 million. Excluding
force, new customers and a continuation of generally good condi- the gain on the sale of the Jackson business and restructuring
tions in the hospitality and lodging industries, particularly in the expenses, consolidated operating income for 2000 totaled
United States. $324 million and increased 12 percent over consolidated oper-
The consolidated gross profit margin was 54.7 percent of net ating income of $290 million in 1999. Business acquisitions
sales for 2000, down slightly from a gross profit margin of 54.9 contributed approximately 10 percent of the growth in operating
percent in 1999. This modest decrease reflected the negative income for 2000. As a percentage of net sales, operating income
effects of the lower gross margin businesses the company has excluding the unusual items represented 14.3 percent compared
acquired over the last two years, higher costs of fuel and restruc- with the 1999 operating income of 13.9 percent. These improve-
turing expenses. The gross profit margin for 2000 benefited from ments in operating income reflected strong performance of the
strong Institutional and International performances and sales of new company’s International and U.S. Institutional operations.
products. Selling price increases for 2000 were not significant. The company’s net income for 2000 was $206 million. Net
Selling, general and administrative expenses for 2000 were income included $2.4 million of net expense to reflect the cumu-
40.5 percent of net sales, a decrease from total selling, general lative effect of a change in accounting for revenue recognition.
and administrative expenses of 41.0 percent of net sales in This change resulted from adopting the Securities and Exchange
1999. Selling, general and administrative expenses included Commission’s Staff Accounting Bulletin No. 101, “Revenue
approximately $4 million of expenses related to a large distributor Recognition in Financial Statements.” This amount was recorded
in both 2000 and 1999. Expenses in both years also included a to reflect changes in the company’s policies from recording
significant favorable item: expenses for 2000 were reduced by revenue when products are shipped to the time title transfers to
$4.1 million for reductions in probable losses related to certain the customer. Excluding this charge and the net impact of
environmental matters, and expenses for 1999 included a non- restructuring expenses and the gain on the sale of the Jackson
taxable gain of $1.5 million related to the demutualization of an business, after-tax income for 2000 was $198 million, an
insurance company. Selling, general and administrative expense increase of 13 percent over net income of $176 million in 1999.
improvements for 2000 also reflected lower costs related to retire- This improvement reflected strong operating income growth, a
ment plans, and the benefits of synergies from the effects of busi- lower effective income tax rate and improved equity in earnings
ness acquisitions and cost controls. These benefits were partially of Henkel-Ecolab, partially offset by higher net interest expense.
offset by investments in the sales-and-service force and in new As a percentage of net sales, this after-tax income was 8.7 per-
businesses. cent, up slightly from net income of 8.5 percent in 1999.
During the fourth quarter of 2000, management approved vari-
1999 Compared with 1998
ous actions to improve the long-term efficiency and competitive-
Consolidated net sales approached $2.1 billion for 1999 and
ness of the company and to reduce costs. These actions included
increased 10 percent over net sales of nearly $1.9 billion in
personnel reductions, discontinuance of certain product lines,
1998. Nearly all of the company’s operating segments contributed
changes to certain manufacturing and distribution operations and
to the company’s growth in sales for 1999, with strong growth
the closing of selected sales and administrative offices. As a result
from the core U.S. Institutional and Food & Beverage operations.
of these actions, the company recorded restructuring expenses
Business acquisitions accounted for approximately one-third of
totaling $7.1 million ($4.3 million after tax, or $0.03 per diluted
the growth in consolidated sales for 1999. Changes in currency
share). Further details related to these restructuring expenses are
Ecolab 2000 Annual Report
translation had a very modest negative effect on the consolidated
included in the notes to consolidated financial statements.
sales growth rate for 1999. The growth in sales also reflected the
26
4. benefits of new products, new customers, and a larger and better Operating Segment Performance
trained sales-and-service force. A continuation of generally good
(thousands) 2000 1999 1998
conditions in the hospitality and lodging industries, particularly in
the United States, also had a favorable effect on sales for 1999. Net sales
The company’s consolidated gross profit margin was 54.9 per- United States
Cleaning & Sanitizing $1,532,033 $1,424,037 $1,296,797
cent of sales for 1999 and was unchanged from the prior year.
Other Services 248,317 211,562 160,063
The benefits from increased sales of the higher-margin products
Total 1,780,350 1,635,599 1,456,860
of the company’s U.S. core operations, an improved margin in the
International Cleaning
Asia Pacific region, and sales volume growth of new products were
& Sanitizing 500,322 452,892 433,109
generally offset by the effects of the lower gross profit margins of Total 2,280,672 2,088,491 1,889,969
businesses acquired. Selling price increases during 1999 were Effect of foreign currency
not significant. translation (16,359) (8,479) (1,743)
Consolidated $2,264,313 $2,080,012 $1,888,226
For 1999, selling, general and administrative expenses were
41.0 percent of net sales, unchanged from the prior year. Selling, Operating income
general and administrative expenses included two significant United States
Cleaning & Sanitizing $ 249,182 $ 230,520 $ 218,500
items in 1999. During the third quarter of 1999, the company
Other Services 25,515 25,114 19,084
recognized a non-taxable gain of $1.5 million, or $0.01 per share,
Total 274,697 255,634 237,584
on the receipt of shares from an insurance company that demutu-
International Cleaning
alized and issued shares in a public offering. During the fourth
& Sanitizing 51,978 40,422 31,168
quarter, the company recognized approximately $4 million of bad Total 326,675 296,056 268,572
debt expense related to a large distributor. In addition to these two Corporate 18,491 (4,570) (4,347)
items, the selling, general and administrative expense margin Effect of foreign
currency translation (2,027) (1,535) (2,425)
reflected the benefits of synergies from the effects of business
Consolidated $ 343,139 $ 289,951 $ 261,980
acquisitions, tight cost controls, lower investments in international
areas experiencing difficult economic conditions and strong sales Operating income as a percent
of net sales
growth. These benefits were offset by increased expenses related
United States
to the company’s retirement plans, and higher investments in the
Cleaning & Sanitizing 16.3% 16.2% 16.8%
sales-and-service force and new business development.
Other Services 10.3 11.9 11.9
Consolidated operating income increased 11 percent for 1999
Total 15.4 15.6 16.3
and reached $290 million compared with $262 million in 1998. International Cleaning
Business acquisitions accounted for approximately 10 percent & Sanitizing 10.4% 8.9% 7.2%
of the increase. The consolidated operating income margin was
The company’s operating segments have similar products and
unchanged from the 1998 record level of 13.9 percent. Operating
services and the company is organized to manage its operations
income improvement reflected continued strong growth trends in
geographically. The company’s operating segments have been
the U.S. Institutional, Food & Beverage and Pest Elimination oper-
aggregated into three reportable segments: United States Cleaning
ations, and significant growth in the Asia Pacific region for 1999.
& Sanitizing, United States Other Services, and International
Income from continuing operations rose to $176 million, or
Cleaning & Sanitizing. The company evaluates the performance
$1.31 per diluted share, an increase of 14 percent over income
of its International operations based on fixed management rates
of $155 million, or $1.15 per diluted share in 1998. The increase
of currency exchange. Therefore, International sales and operating
in income reflected double-digit growth in operating income and
income totals, as well as the International financial information
in the company’s equity in earnings of Henkel-Ecolab. As a per-
included in this financial discussion, are based on translation into
centage of net sales, income from continuing operations improved
Ecolab 2000 Annual Report
to 8.5 percent of net sales, compared with 8.2 percent of net
sales in the prior year.
27
5. Financial
discussion
U.S. dollars at the fixed currency exchange rates used by manage- Sales of Professional Products decreased 4 percent for 2000
ment for 2000. All other accounting policies of the reportable reflecting lower sales to the private label and government markets,
segments are consistent with accounting principles generally partially offset by higher sales of specialty healthcare products.
accepted in the United States of America and the accounting The company is focusing on growing Professional Product’s
policies of the company described in Note 2 of the notes to con- distributor and building service contractor businesses. Water Care
solidated financial statements. Additional information about the Services sales increased 6 percent with good growth in sales to
company’s reportable segments is included in Note 16 of the the hospitality and food and beverage markets. Sales of the
notes to consolidated financial statements. company’s Vehicle Care operations were up 5 percent for 2000.
Sales of the company’s United States Cleaning & Sanitizing Excluding the annualized effect of the Blue Coral business
operations exceeded $1.5 billion in 2000 and increased 8 per- acquired in February 1999, Vehicle Care sales decreased 1 per-
cent over net sales of $1.4 billion in 1999. Business acquisitions cent for 2000 reflecting the loss of some customers during the
accounted for approximately 25 percent of the growth in sales integration of the Blue Coral business which included sales force
for 2000. Sales reflected double-digit growth in sales of Kay’s reorganizations and product consolidation. Food & Beverage U.S.
operations and solid growth in the core Institutional operations. sales increased 4 percent for 2000. Strong growth in sales to the
The sales improvement also reflected sales of new products dairy, filtration and beverage markets was offset by declines in
and services, a larger and better trained sales-and-service force, meat and poultry.
aggressive sales efforts and programs and generally good condi- Sales of United States Other Services operations increased
tions in the hospitality and lodging industries. Selling price 17 percent to $248 million in 2000, from $212 million in 1999.
increases during 2000 were not significant. Sales of U.S. Excluding the effects of businesses acquired, sales increased
Institutional operations increased 8 percent for 2000 with good 10 percent for 2000. Pest Elimination reported sales growth of
growth in its specialty, housekeeping and Ecotemp programs, 12 percent for 2000 with high growth in new contract sales and
and modest growth in warewashing and laundry sales. Business a continuation of solid growth across all of its business lines.
acquisitions were not significant to Institutional’s sales growth. Sales of the GCS commercial kitchen equipment parts and repair
Kay’s U.S. operations reported sales growth of 36 percent for 2000. operations rose 36 percent for 2000 as the company continued
Excluding the acquisition of Southwest Sanitary Distributing to expand operations through business acquisitions. Excluding
Company, Kay’s U.S. sales increased 14 percent over the prior the effects of businesses acquired, GCS sales increased 9 percent
year with good growth in sales to the quickservice market and for 2000. In the fourth quarter of 2000, the company sold its
continued growth and expansion of its food retail business. Textile Jackson dishmachine manufacturing business. Jackson’s sales
Care sales decreased 5 percent for 2000. Textile Care markets in 2000, prior to its divestiture, were flat compared with the full
remained very price competitive and management has increased year sales for 1999.
the emphasis on improved service and product performance.
United States Cleaning & Sanitizing Sales United States Other Services Sales
Business Mix Business Mix
(Dollars in Millions) (Dollars in Millions)
$1,532 $248
$1,424
Vehicle Care 3%
Textile Care 4% $1,297 Jackson 5% $212
Water Care
Professional
Services 2% Pest
Products 6% $160
Elimination 63%
$1,424 GCS
Kay 8%
Service 32%
Institutional 59%
Food &
Beverage 18%
Ecolab 2000 Annual Report
2000 1998 1999 2000 2000 1998 1999 2000
28
6. Management rate-based sales of the company’s International income of GCS operations. Growth in the operating income of
Cleaning & Sanitizing operations reached $500 million for 2000, the divested Jackson business was not significant. The operating
an increase of 10 percent over sales of $453 million in 1999. income margin of United States Other Services operations was
Business acquisitions accounted for approximately 50 percent of 10.3 percent of net sales for 2000, down from 11.9 percent of
the increase in International Cleaning & Sanitizing sales for 2000. net sales in 1999. This decrease reflected higher GCS operational
Sales in Asia Pacific, International’s largest region of operation, expenses including fuel surcharges, rising service labor rates and
increased 4 percent for 2000. Excluding business acquisitions, insurance losses, partially offset by growth in the sales of new
Asia Pacific sales increased 3 percent with double-digit growth in Pest Elimination service offerings and cost controls. During 2000
East Asia, good growth in New Zealand and Japan and lower sales the company added 225 sales-and-service associates to its United
in Australia. Asia Pacific sales reflected growth in sales to both States Other Services operations.
the institutional and food and beverage markets. Latin America Operating income of International Cleaning & Sanitizing
reported sales growth of 36 percent for 2000. Excluding operations was $52 million in 2000 and increased 29 percent
businesses acquired, Latin America sales increased 10 percent over operating income of $40 million in 1999. The effects of
with continued significant growth in Mexico and modest growth in businesses acquired accounted for approximately 20 percent of
Brazil. Sales in Canada rose 7 percent for 2000 with solid growth this operating income growth. The International operating income
in sales to institutional markets and improved sales to the food margin improved to 10.4 percent of net sales in 2000 from
and beverage, textile care and professional products markets. 8.9 percent in 1999. All of the company’s international regions
Sales of Africa/Export operations increased 12 percent for 2000 of operations reported double-digit growth in operating income
due to an additional business acquired and good growth in sales and improved operating margins for 2000. These improvements
of Africa’s operations. reflected sales growth from new customers, including sales of new
Operating income of the company’s United States Cleaning products, and tight cost controls. The company added 395 sales-
& Sanitizing operations reached $249 million in 2000 and and-service associates to its International Cleaning & Sanitizing
increased 8 percent over operating income of $231 million in operations during 2000.
1999. Business acquisitions accounted for approximately 10 per- Operating income margins of the company’s International oper-
cent of the growth in operating income for 2000. Operating ations are substantially less than the operating income margins
income included good growth in Kay, Institutional and Water Care realized for the company’s U.S. operations. The lower International
operations and modest growth in Food & Beverage. Operating margins are due to higher costs of importing raw materials and fin-
income of Professional Products, Vehicle Care and Textile Care ished goods, increased investments in dispensing equipment and
was lower than the prior year. As a percentage of net sales, oper- the additional costs of operating in numerous and diverse foreign
ating income increased slightly to 16.3 percent in 2000, from jurisdictions. Proportionately larger investments in sales, technical
16.2 percent in 1999. This margin improvement reflected strong support and administrative personnel are also necessary in order
results of the core Institutional operations, growth in sales of new to facilitate growth of International operations.
products, synergies from the integration of businesses acquired,
modest increases in raw material costs and tight cost controls. International Cleaning & Sanitizing Sales
Business Mix (Dollars in Millions)
These benefits were substantially offset by poor results of
Professional Product’s operations, investments in the sales-and- $500
$453
$433
service force, lower margins of businesses acquired and higher Africa, Export 12%
and Other
fuel costs. The company added 280 sales-and-service associates
$1,424
to its United States Cleaning & Sanitizing operations during 2000. Canada 17%
Operating income of United States Other Services operations
Asia Pacific 52%
rose 2 percent to $26 million in 2000. Excluding operating
Latin America 19%
income of businesses acquired in 2000 and the annualized effect
Ecolab 2000 Annual Report
of 1999 acquisitions, operating income for 2000 was virtually
unchanged from the prior year. Near double-digit growth in Pest
2000 1998 1999 2000
Elimination operating income was offset by lower operating
29
7. Financial
discussion
1999 Compared with 1998 benefited from a larger number of service offerings and gains from
Sales of the company’s United States Cleaning & Sanitizing oper- new customer business. The recently acquired GCS commercial
ations reached $1.4 billion in 1999, an increase of 10 percent kitchen equipment parts and repair business continued to report
over sales of nearly $1.3 million in 1998. Sales benefited from solid growth. The company began focusing on coordinating GCS
business acquisitions and the continued strong performances of operations with the other Ecolab businesses and expanding opera-
the core Institutional and Food & Beverage operations. Business tions to provide national coverage. Sales of the Jackson equipment
acquisitions accounted for approximately 25 percent of the business increased 13 percent for 1999.
growth in United States Cleaning & Sanitizing sales for 1999. Management rate sales for the company’s International
Sales growth also included the benefits from sales of new Cleaning & Sanitizing operations were $453 million in 1999 and
products, investments the company has made in the sales-and- were up 5 percent over sales of $433 million in 1998. The bene-
service force, and generally good conditions in the hospitality and fits of business acquisitions were more than offset by the negative
lodging industries. Selling price increases during 1999 were not effects of a Gibson business which was sold during 1999. These
significant. Sales of the company’s U.S. Institutional operations business changes had a modest negative effect on the sales
increased 8 percent for 1999. Institutional’s growth reflected new growth rate of International Cleaning & Sanitizing operations for
customer business, good customer retention, continued double- 1999. Sales for the Asia Pacific region increased 6 percent for
digit growth in sales of its Ecotemp, specialty and housekeeping 1999. Asia Pacific sales included good growth in Japan, Australia
programs and good growth in warewashing sales. Sales for Kay’s and New Zealand, and double-digit growth in Southeast Asia. Asia
U.S. operations increased 9 percent for 1999 and reflected the Pacific sales reflected good growth in sales to both the food and
continued expansion of its food retail business and good growth beverage and institutional markets. Latin America reported sales
in sales to its core quickservice customers. Sales of Textile Care growth of 8 percent for 1999 which included significant double-
operations were up 5 percent for 1999 and included benefits digit growth in Mexico and Central America, partially offset by
from new product offerings and new customers. Textile Care con- modestly lower sales in Brazil which was affected by a currency
tinued to be challenged by consolidations and pricing pressures in devaluation. Institutional and Food & Beverage sales showed good
its markets. Professional Products reported a 3 percent decrease improvement in the Latin America region. Sales in Canada were
in sales for 1999. Lower sales to the specialty and government up 4 percent for 1999 with higher sales to both the food and bev-
education markets were partially offset by growth in sales to erage and institutional markets. Sales of Africa/Export operations
corporate accounts. Sales of Water Care Services operations increased 21 percent for 1999 due to an acquisition early in the
increased 4 percent for 1999. Water Care sales included new year in South Africa and solid growth in Export operations.
customer business, however, results were limited by a very com- Operating income of the company’s United States Cleaning
petitive business environment. The company’s Food & Beverage & Sanitizing operations increased 6 percent to $231 million in
operations reported sales growth of 11 percent for 1999. 1999, compared with operating income of $219 million in 1998.
Excluding the annualized effect of businesses acquired in 1998, Business acquisitions accounted for approximately 20 percent
Food & Beverage sales increased 8 percent with particularly of the growth in operating income for 1999. Operating income
strong growth in sales to the meat processing and agribusiness growth reflected continued strong growth in the core Institutional
markets. In February 1999, the company acquired substantially and Food & Beverage operations and improved performances by
all of the assets of Blue Coral Systems, a leading manufacturer Textile Care and Water Care during 1999. Operating income of
of branded vehicle cleaning, appearance and specialty products Professional Products decreased during 1999 and income of
to the commercial vehicle wash industry. Blue Coral Systems was Kay’s U.S. operations was modestly lower than the prior year. The
combined with the Grace-Lee business to form the company’s operating income margin for United States Cleaning & Sanitizing
Vehicle Care operations. operations decreased to 16.2 percent of net sales in 1999 from
Sales of the company’s United States Other Services operations 16.8 percent in 1998. This decrease reflected disappointing
totaled $212 million for 1999, an increase of 32 percent over results of Professional Products operations, investments in the
Ecolab 2000 Annual Report
sales of $160 million in 1998. Excluding sales of GCS Service, sales-and-service force to support new business development and
Inc. (GCS) which was acquired in July 1998, sales of United the effects of the lower margins of businesses acquired. The oper-
States Other Services increased 12 percent for 1999. Pest ating income margin benefited from the strong core operation’s
Elimination reported sales growth of 12 percent for 1999 reflect- performance, higher sales volume, sales of new products, modest
ing good growth across all business lines. Pest Elimination sales
30
8. increases in raw material costs and tight cost controls. The com- Henkel-Ecolab Business Mix Ecolab’s Equity in Earnings
pany added 370 sales-and-service associates to its United States (Dollars in Millions)
Cleaning & Sanitizing operations during 1999. $20
$18
Operating income of United States Other Services operations Textile Hygiene 13%
$16
totaled $25 million for 1999 and increased 32 percent over
Institutional 36% $1,424
1998 operating income of $19 million. Excluding GCS, which
Food &
was acquired in July of 1998, operating income of United States Beverage 25%
Other Services increased 22 percent for 1999. The operating
Professional
Hygiene 26%
income margin for United States Other Services was 11.9 percent
for 1999, unchanged from the prior year. The operating income
margin for 1999 reflected substantially increased income of the
2000 1998 1999 2000
Jackson business and an improved Pest Elimination margin due
to good sales growth and productivity improvements. These bene-
During the fourth quarter of 2000, the company entered into
fits were offset by the addition of the lower-margin GCS business.
an agreement with Henkel to acquire the remaining 50 percent of
During 1999 the company added 185 sales-and-service associ-
the Henkel-Ecolab joint venture the company does not own. This
ates to its United States Other Services operations.
acquisition is scheduled to occur on January 2, 2002. Additional
Operating income for the company’s International Cleaning &
details related to this agreement are included in Note 10 of the
Sanitizing operations was $40 million, an increase of 30 percent
notes to consolidated financial statements.
over operating income of $31 million in 1998. The operating
income margin for International operations rose to 8.9 percent of 1999 compared with 1998
net sales in 1999 from 7.2 percent in 1998. Operating income The company’s equity in earnings of Henkel-Ecolab increased
increased significantly during 1999 in Asia Pacific, Latin America 14 percent to $18 million in 1999 from $16 million in 1998.
and Africa/Export operations reflecting good sales growth and When measured in Deutsche marks, earnings of Henkel-Ecolab
tight cost controls. Overall, the total number of sales-and-service increased 24 percent and reflected the benefits of good sales
associates in International Cleaning & Sanitizing operations at growth, improved European economies, and tight cost controls
year-end 1999 was unchanged from the prior year. which more than offset investments made in the sales-and-service
force and expenses related to the year 2000 and euro
Henkel-Ecolab
conversions.
The company operates cleaning and sanitizing businesses in
Sales of Henkel-Ecolab increased 7 percent for 1999 when
Europe through a 50 percent economic interest in Henkel-Ecolab.
measured in Deutsche marks. Excluding the effects of business
The company includes Henkel-Ecolab in its financial statements
acquisitions and a business sold during 1999, sales increased
using the equity method of accounting. The company’s equity in
6 percent. Henkel-Ecolab sales reflected growth across all of its
earnings of Henkel-Ecolab, including royalty income and after
major businesses, the benefits of new product introductions and
deduction of intangible amortization, was $20 million in 2000,
a larger and better trained sales-and-service force. Henkel-Ecolab
an increase of 7 percent over $18 million in 1999. When
sales increased 4 percent for 1999 when measured in U.S. dollars.
measured in Deutsche marks, net income of Henkel-Ecolab for
2000 increased 18 percent and reflected good sales growth, Corporate
improved income margins, a lower effective income tax rate and Corporate operating income totaled $18 million in 2000,
cost controls, partially offset by investments in the sales-and- compared with corporate operating expense of $5 million in 1999
service force. and $4 million in 1998. Historically, corporate operating expense
Henkel-Ecolab sales, although not consolidated in Ecolab’s included overhead costs directly related to the Henkel-Ecolab
financial statements, increased 7 percent when measured in joint venture. However, in 2000, corporate operating income also
Ecolab 2000 Annual Report
Deutsche marks. All major business lines contributed to the included the $25.9 million gain on the sale of the Jackson busi-
overall sales growth for 2000. Sales continued to benefit from ness, restructuring expenses of $7.1 million and income of
expansion of global contracts, new product introductions and $4.1 million for net reductions in probable losses related to
acquisitions. When measured in U.S. dollars, Henkel-Ecolab certain environmental matters.
sales decreased 7 percent due to the negative effects of a
stronger U.S. dollar.
31
9. Financial
discussion
Interest and Income Taxes Total Debt to Capitalization (Percent)
Net interest expense for 2000 was $25 million, an increase of
33%
8 percent over net interest expense of $23 million in 1999. 30%
27%
This increase reflected higher average debt levels during 2000 Shareholders’
Equity 67%
incurred to fund stock repurchases and business acquisitions. $1,424
Net interest expense was $23 million for 1999 and increased Total Debt 33%
4 percent over net interest expense of $22 million in 1998. This
increase reflected lower interest income on lower average levels
of cash and cash equivalents. Total debt levels during 1999 were
generally consistent with the prior year.
The company’s effective income tax rate was 40.7 percent for 2000 1998 1999 2000
2000. Excluding the effects of the sale of Jackson and restructur-
ing expenses the effective income tax rate for 2000 was 40.5 per- Total debt was $371 million at December 31, 2000 and
s
cent, a decrease from the effective income tax rates in 1999 and increased from total debt of $281 million at year-end 1999 and
1998 of 41.1 percent and 42.4 percent, respectively. These $295 million at year-end 1998. Additional commercial paper bor-
decreases were principally due to lower overall effective rates rowings were incurred during 2000 to fund the stock repurchased
on earnings of International operations. International’s effective under the company’s share repurchase program, and to a lesser
income tax rate varies from year-to-year with the pre-tax income extent, to fund business acquisitions. At December 31, 2000,
mix of the various countries in which the company operates. the company had $145.8 million of commercial paper borrowings
The 1999 effective income tax rate also benefited slightly from which were classified as long-term debt. In January 2001, the
a non-taxable one-time gain of $1.5 million related to the demu- company refinanced the commercial paper borrowings through
tualization of an insurance company. the issuance of $150 million of 6.875 percent Notes, due in
2011. The company has reduced debt under its 9.68 percent
Financial Position, Cash Flows and Liquidity
Senior Notes through scheduled debt repayments during both
Financial Position 2000 and 1999. As of December 31, 2000 the ratio of total debt
The company has maintained its long-term financial objective to capitalization rose to 33 percent, from 27 percent at year-end
of an investment-grade balance sheet since 1993. The company’s 1999 and 30 percent at year-end 1998. The higher debt to capi-
debt continued to be rated within the “A” categories by the major talization ratio for 2000 was due to funding for the company’s
rating agencies during 2000. Significant changes in the company’s share repurchase program. The improvement in the total debt to
financial position during 2000 and 1999 included the following: capitalization ratio for 1999 reflected increased shareholders’
Total assets reached $1.7 billion at December 31, 2000, an equity which resulted from strong earnings performances and the
s
increase of 8 percent over total assets of $1.6 billion at year-end 1998 gain from discontinued operations in addition to the lower
1999. During 1999, total assets increased from $1.5 billion at year-end 1999 debt level.
year-end 1998. These increases reflect growth in ongoing opera-
Cash Flows
tions and assets added through business acquisitions over the last
Cash provided by continuing operating activities reached a
two years. The increases in other noncurrent assets are primarily
new all-time high of $315 million for 2000, an increase from
due to the Spartan, Southwest Sanitary Distributing Company and
$293 million in 1999 and $275 million in 1998. Operating
Facilitec acquisitions in 2000 and the Blue Coral acquisition in
cash flow increases over the last two years have benefited from
1999. Accounts receivable, inventories and property, plant and
strong earnings growth, including additional earnings and cash
equipment were also added during 2000 and in 1999 as a result
flows from businesses acquired. Changes in net operating asset
of these acquisitions.
levels negatively affected the operating cash flow by approximately
Working capital levels declined to $69 million at December
s
Ecolab 2000 Annual Report
$2 million in 2000 and $16 million in 1999 and added approxi-
31, 2000 from $107 million at year-end 1999 and $104 million
mately $4 million to operating cash flow in 1998. Operating cash
at year-end 1998 reflecting higher levels of short-term debt,
flows for 1999 included higher dividends from Henkel-Ecolab
accounts payable and other current liabilities.
compared with the prior year.
The decrease in the company’s investment in Henkel-Ecolab
s
over the last two years was principally due to the effects of
currency translation.
32
10. Liquidity
Cash from Continuing
Operating Activities (Dollars in Millions) The company maintains a $275 million committed line of credit
under its Multicurrency Credit Agreement for general corporate
$315
$293
financing needs. The agreement includes a competitive bid fea-
$275
$254
$235 ture to minimize the cost of the company’s borrowings. The com-
pany also has $50 million remaining on its shelf registration as
an additional source of liquidity. The company believes its existing
cash balances, cash generated by operating activities, including
cash flows from Henkel-Ecolab, available credit, and additional
credit available based on a strong financial position, are adequate
to fund all of the requirements which are reasonably foreseeable
1996 1997 1998 1999 2000
for 2001 for growth, possible acquisitions, share repurchases,
new program investments, scheduled debt repayments and divi-
Cash used for discontinued operating activities in 1998 reflects
dend payments.
income taxes paid related to a business which was discontinued
Market Risk
in 1992.
The company enters into contractual arrangements (derivatives)
Cash flows used for investing activities included capital expen-
in the ordinary course of business to manage foreign currency
ditures of $150 million in 2000, $146 million in 1999 and $148
exposure and interest rate risks. The company does not enter into
million in 1998. Worldwide additions of merchandising equipment,
derivatives for trading purposes. The company’s use of derivatives
primarily cleaning and sanitizing product dispensers, accounted
is subject to internal policies which provide guidelines for control,
for approximately 70 percent of each year’s capital expenditures.
counterparty risk and ongoing monitoring and reporting.
The company has also continued to invest in additional manufac-
The company enters into forward contracts, swaps, and foreign
turing facilities through construction and business acquisitions in
currency options to hedge certain intercompany financial arrange-
order to meet sales requirements more efficiently. Cash used for
ments, and to hedge against the effect of exchange rate fluctua-
businesses acquired included Spartan and Facilitec in 2000 and
tions on transactions related to cash flows denominated in
Blue Coral in 1999. Investing activities cash flows also include
currencies other than U.S. dollars.
the proceeds from the sale of the Jackson business in 2000 and
The company manages interest expense using a mix of fixed
the sale of certain Gibson businesses and duplicate facilities in
and floating rate debt. To help manage borrowing costs, the
1999 and 1998 which the company chose not to retain.
company may enter into interest rate swaps. Under these arrange-
Cash used for financing activities included cash used to reac-
ments, the company agrees to exchange, at specified intervals,
quire shares, pay dividends and cash provided and used through
the difference between fixed and floating interest amounts calcu-
the company’s debt arrangements. In May 2000, the company
lated by reference to an agreed-upon notional principal amount.
announced a program to repurchase up to $200 million of its com-
Based on a sensitivity analysis (assuming a 10 percent adverse
mon stock. Actual share repurchases for 2000 totaled $187 mil-
change in market rates) of the company’s foreign exchange and
lion, significantly higher than repurchases of $42 million in 1999
interest rate derivatives and other financial instruments outstand-
and $53 million in 1998. These repurchases were funded with
ing at December 31, 2000, changes in exchange rates or interest
operating cash flows and additional debt. In December 2000,
rates would not materially affect the company’s results of opera-
the company announced a new authorization to repurchase up
tions, financial position or liquidity.
to 5.0 million additional shares of common stock.
In 2000, the company increased its annual dividend rate for
the ninth consecutive year. The company has paid dividends on
its common stock for 64 consecutive years. Cash dividends
Ecolab 2000 Annual Report
declared per share of common stock, by quarter, for each of the
last three years were as follows:
First Second Third Fourth
Quarter Quarter Quarter Quarter Year
2000 $0.12 $0.12 $0.12 $0.13 $0.49
1999 0.105 0.105 0.105 0.12 0.435
1998 0.095 0.095 0.095 0.105 0.39
33
11. consolidated statement
of Income
2000
Year ended December 31 (thousands, except per share) 1999 1998
$2,264,313
Net sales $2,080,012 $1,888,226
Operating expenses (income)
1,025,906
Cost of sales (including restructuring expenses of $1,948 in 2000) 937,612 851,173
916,004
Selling, general and administrative expenses 852,449 775,073
(25,925)
Gain on sale of Jackson business
5,189
Restructuring expenses – other
343,139
Operating income 289,951 261,980
24,605
Interest expense, net 22,713 21,742
Income from continuing operations before income taxes
318,534
and equity in earnings of Henkel-Ecolab 267,238 240,238
129,495
Provision for income taxes 109,769 101,782
19,516
Equity in earnings of Henkel-Ecolab 18,317 16,050
Income from continuing operations before cumulative effect
208,555
of change in accounting 175,786 154,506
(2,428)
Cumulative effect of change in accounting for revenue recognition
Gain from discontinued operations 38,000
$ 206,127
Net income $ 175,786 $ 192,506
Basic income per common share
$ 1.63
Income from continuing operations before change in accounting $ 1.36 $ 1.20
(0.02)
Change in accounting
Gain from discontinued operations 0.29
$ 1.61
Net income $ 1.36 $ 1.49
Diluted income per common share
$ 1.58
Income from continuing operations before change in accounting $ 1.31 $ 1.15
(0.02)
Change in accounting
Gain from discontinued operations 0.28
$ 1.56
Net income $ 1.31 $ 1.44
Weighted-average common shares outstanding
127,753
Basic 129,550 129,157
131,946
Diluted 134,419 134,047
Ecolab 2000 Annual Report
34 The accompanying notes are an integral part of the consolidated financial statements.
12. consolidated
Balance Sheet
2000
December 31 (thousands, except per share) 1999 1998
Assets
Current assets
$ 43,965
Cash and cash equivalents $ 47,748 $ 28,425
326,937
Accounts receivable, net 299,751 246,695
168,220
Inventories 176,369 165,627
50,709
Deferred income taxes 41,701 36,256
10,737
Other current assets 11,752 26,511
600,568
Total current assets 577,321 503,514
501,640
Property, plant and equipment, net 448,116 420,205
199,642
Investment in Henkel-Ecolab 219,003 253,646
412,161
Other assets 341,506 293,630
$1,714,011
Total assets $1,585,946 $1,470,995
Liabilities and Shareholders’ Equity
Current liabilities
$ 136,592
Short-term debt $ 112,060 $ 67,991
146,428
Accounts payable 122,701 124,646
88,330
Compensation and benefits 90,618 79,431
Income taxes 5,743 244
160,684
Other current liabilities 139,552 127,479
532,034
Total current liabilities 470,674 399,791
234,377
Long-term debt 169,014 227,041
117,790
Postretirement health care and pension benefits 97,527 85,793
72,803
Other liabilities 86,715 67,829
Shareholders’ equity (common stock, par value $1.00 per share;
757,007
shares outstanding: 2000 – 127,161; 1999 – 129,416; 1998 – 129,479) 762,016 690,541
$1,714,011
Total liabilities and shareholders’ equity $1,585,946 $1,470,995
Ecolab 2000 Annual Report
35
The accompanying notes are an integral part of the consolidated financial statements.
13. consolidated statement
of Cash Flows
2000
Year ended December 31 (thousands) 1999 1998
Operating Activities
$ 206,127
Net income $ 175,786 $ 192,506
Adjustments to reconcile net income to cash provided by continuing operations:
2,428
Cumulative effect of change in accounting
Gain from discontinued operations (38,000)
119,072
Depreciation 109,946 99,276
29,364
Amortization 24,584 22,695
(11,604)
Deferred income taxes (3,903) (2,012)
(19,516)
Equity in earnings of Henkel-Ecolab (18,317) (16,050)
15,914
Henkel-Ecolab royalties and dividends 21,826 10,451
2,786
Restructuring expenses – asset disposals
(25,925)
Gain on sale of Jackson business
(913)
Other, net (303) 1,526
Changes in operating assets and liabilities:
(30,635)
Accounts receivable (44,643) 1,352
(22,585)
Inventories (8,913) (11,667)
(7,332)
Other assets (23,842) (7,631)
16,626
Accounts payable (4,512) (7,794)
41,679
Other liabilities 65,785 29,877
315,486
Cash provided by continuing operations 293,494 274,529
Cash used for discontinued operations (38,887)
315,486
Cash provided by operating activities 293,494 235,642
Investing Activities
(150,009)
Capital expenditures (145,622) (147,631)
2,092
Property disposals 6,293 7,060
(90,603)
Businesses acquired and investments in affiliates (45,991) (40,206)
35,803
Sale of businesses and assets 12,090 14,226
Other, net (1,246) 4,766
(202,717)
Cash used for investing activities (174,476) (161,785)
Financing Activities
124,080
Net issuances of notes payable 43,896 24,820
Long-term debt borrowings 62,552 117,740
(21,777)
Long-term debt repayments (122,096) (151,143)
(186,516)
Reacquired shares (42,395) (52,984)
(61,644)
Cash dividends on common stock (54,333) (49,000)
Ecolab 2000 Annual Report
30,622
Other, net 13,263 5,679
(115,235)
Cash used for financing activities (99,113) (104,888)
(1,317)
Effect of exchange rate changes on cash (582) (1,713)
Increase (Decrease) in Cash and Cash Equivalents (3,783) 19,323 (32,744)
47,748
Cash and cash equivalents, beginning of year 28,425 61,169
$ 43,965
Cash and cash equivalents, end of year $ 47,748 $ 28,425
36 The accompanying notes are an integral part of the consolidated financial statements.