3. UNISYS CORPORATION
CONSOLIDATED BALANCE SHEETS
(Millions)
March 31, December 31,
2005 2004
---------- ----------
Assets
Current assets
Cash and cash equivalents $441.6 $660.5
Accounts and notes receivable, net 1,050.1 1,136.8
Inventories
Parts and finished equipment 92.2 93.7
Work in process and materials 130.4 122.4
Deferred income taxes 292.1 291.8
Prepaid expense and other
current assets 139.5 112.4
---------- ----------
Total 2,145.9 2,417.6
---------- ----------
Properties 1,271.3 1,305.5
Less accumulated depreciation
and amortization 863.8 881.4
---------- ----------
Properties, net 407.5 424.1
---------- ----------
Outsourcing assets, net 433.3 431.9
Marketable software, net 340.5 336.8
Investments at equity 210.4 197.1
Prepaid pension cost 49.4 52.5
Deferred income taxes 1,394.6 1,394.6
Goodwill 188.4 189.9
Other long-term assets 164.3 176.4
---------- ----------
Total $5,334.3 $5,620.9
========== ==========
Liabilities and stockholders' equity
Current liabilities
Notes payable $2.7 $1.0
Current maturities of long-term debt 1.5 151.7
Accounts payable 365.6 487.4
Other accrued liabilities 1,291.5 1,316.1
Income taxes payable 0.0 66.6
---------- ----------
Total 1,661.3 2,022.8
---------- ----------
Long-term debt 898.6 898.4
Accrued pension liabilities 573.3 537.9
Other long-term liabilities 708.6 655.3
Stockholders' equity
Common stock 3.4 3.4
Accumulated deficit (421.7) (376.2)
Other capital 3,895.8 3,883.8
Accumulated other comprehensive loss (1,985.0) (2,004.5)
---------- ----------
Stockholders' equity 1,492.5 1,506.5
---------- ----------
Total $5,334.3 $5,620.9
========== ==========
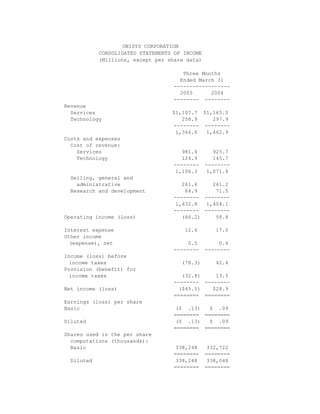
4. UNISYS CORPORATION
CONSOLIDATED STATEMENTS OF CASH FLOWS
(Millions)
Three Months Ended
March 31
-------------------
2005 2004
------- -------
Cash flows from operating activities
Net income (loss) ($45.5) $28.9
Add (deduct) items to reconcile
net income (loss) to net cash
provided by operating activities:
Equity loss (income) 4.3 (5.3)
Depreciation and amortization of properties 30.0 35.8
Depreciation and amortization of
outsourcing assets 34.7 26.6
Amortization of marketable software 28.5 29.3
Increase in deferred income taxes, net (.3) (1.4)
Decrease in receivables, net 90.5 54.2
Increase in inventories (6.5) (19.1)
(Decrease) increase in accounts payable
and other accrued liabilities (158.5) 8.2
Decrease in income taxes payable (66.6) (8.0)
Increase in other liabilities 97.7
Increase in other assets (16.4) (25.4)
Other 34.9 5.4
------- -------
Net cash provided by operating activities 26.8 129.2
------- -------
Cash flows from investing activities
Proceeds from investments 1,779.9 1,408.3
Purchases of investments (1,776.8) (1,413.7)
Investment in marketable software (33.0) (29.0)
Capital additions of properties (22.4) (36.5)
Capital additions of outsourcing assets (41.9) (47.6)
------- -------
Net cash used for investing activities (94.2) (118.5)
------- -------
Cash flows from financing activities
Net proceeds from short-term borrowings 1.7 10.6
Proceeds from employee stock plans 6.6 11.1
Payments of long-term debt (150.3) (1.0)
------- -------
Net cash (used for) provided by
financing activities (142.0) 20.7
------- -------
Effect of exchange rate changes on cash
and cash equivalents (9.5) 4.1
------- -------
(Decrease) increase in cash and cash
equivalents (218.9) 35.5
Cash and cash equivalents, beginning of
period 660.5 635.9
------- -------
Cash and cash equivalents, end of period $441.6 $671.4
======= =======
5. Reconciliation of GAAP to Non-GAAP
Financial Information
The preceding release presents information with and
without pension expense. Unisys believes that this
information will enhance an overall understanding
of its financial performance due to the significant
change in pension expense from period to period
and the non-operational nature of pension expense.
The presentation of non-GAAP information is not
meant to be considered in isolation or as a substitute
for results prepared in accordance with accounting
principles generally accepted in the United States.
6. UNISYS CORPORATION
RECONCILIATION OF GAAP TO NON-GAAP
CONSOLIDATED STATEMENTS OF INCOME
(Millions, except per share data)
Three Months Ended
March 31, 2005
----------------------------
US GAAP Less Without
as Pension Pension
Reported Expense Expense
-------- -------- --------
Revenue $1,366.6 $1,366.6
Costs and expenses
Cost of revenue 1,106.3 ($32.8) 1,073.5
Selling, general and
administrative 261.6 (9.1) 252.5
Research and development 64.9 (4.9) 60.0
-------- -------- --------
1,432.8 (46.8) 1,386.0
-------- -------- --------
Operating income (loss) (66.2) 46.8 (19.4)
Interest expense 12.6 12.6
Other income
(expense), net 0.5 0.5
-------- -------- --------
Income (loss) before
income taxes (78.3) 46.8 (31.5)
Provision (benefit) for
income taxes (32.8) 15.0 (17.8)
-------- -------- --------
Net income (loss) ($45.5) $31.8 ($13.7)
======== ======== ========
Earnings (loss) per share ($ .13) $ .09 ($ .04)
======== ======== ========
Three Months Ended
March 31, 2004
----------------------------
US GAAP Less Without
as Pension Pension
Reported Expense Expense
-------- -------- --------
Revenue $1,462.9 $1,462.9
Costs and expenses
Cost of revenue 1,071.4 ($15.5) 1,055.9
Selling, general and
administrative 261.2 (4.9) 256.3
Research and development 71.5 (1.8) 69.7
-------- -------- --------
1,404.1 (22.2) 1,381.9
-------- -------- --------
Operating income 58.8 22.2 81.0
Interest expense 17.0 17.0
Other income
(expense), net 0.6 0.6
-------- -------- --------
Income before income taxes 42.4 22.2 64.6
Provision for income taxes 13.5 7.1 20.6
-------- -------- --------
Net income $28.9 $15.1 $44.0
======== ======== ========
Earnings per share $ .09 $ .04 $ .13
======== ======== ========
7. UNISYS CORPORATION
RECONCILIATION OF GAAP TO NON-GAAP
SEGMENT RESULTS OF OPERATIONS
(Millions)
Three Months Ended
March 31, 2005
----------------------------
Less Without
As Pension Pension
Reported Expense Expense
-------- -------- --------
Services Segment
Total revenue $1,112.5 $1,112.5
Gross profit 122.2 ($31.8) 154.0
% of revenue 11.0% 13.8%
Operating income (loss) (75.1) (39.4) (35.7)
% of revenue -6.8% -3.2%
Technology Segment
Total revenue 314.0 314.0
Gross profit 149.7 (1.0) 150.7
% of revenue 47.7% 48.0%
Operating income 19.3 (7.4) 26.7
% of revenue 6.1% 8.5%
Total Company
Total revenue 1,366.6 1,366.6
Gross profit 260.3 (32.8) 293.1
% of revenue 19.0% 21.4%
Operating income (loss) (66.2) (46.8) (19.4)
% of revenue -4.8% -1.4%
Three Months Ended
March 31, 2004
----------------------------
Less Without
As Pension Pension
Reported Expense Expense
-------- -------- --------
Services Segment
Total revenue $1,169.8 $1,169.8
Gross profit 222.9 ($15.2) 238.1
% of revenue 19.1% 20.4%
Operating income 29.2 (19.3) 48.5
% of revenue 2.5% 4.1%
Technology Segment
Total revenue 338.8 338.8
Gross profit 163.8 (0.3) 164.1
% of revenue 48.3% 48.4%
Operating income 29.2 (2.9) 32.1
% of revenue 8.6% 9.5%
Total Company
Total revenue 1,462.9 1,462.9
Gross profit 391.5 (15.5) 407.0
% of revenue 26.8% 27.8%
Operating income 58.8 (22.2) 81.0
% of revenue 4.0% 5.5%
8. UNISYS CORPORATION
RECONCILATION OF GAAP TO NON-GAAP
FORWARD-LOOKING ESTIMATED EARNINGS (LOSS) PER SHARE
Three
Months
Ending
6/30/2005
----------
Earnings (loss) per share-
on a GAAP basis (.11)-(.07)
Add back estimated pension expense,
net of tax .09
---------
Earnings (loss) per share-
on a NON-GAAP basis
(excluding pension expense) (.02) -.02
=========
NOTE: See section in press release entitled
quot;Forward-Looking Statementsquot;.