SlideShare ist ein Scribd-Unternehmen logo
1 von 28
Downloaden Sie, um offline zu lesen
VIRGIN MEDIA REPORTS FOURTH QUARTER 2006 RESULTS
London, England, February 28, 2007 – Virgin Media Inc. (NASDAQ: VMED) announces results for the quarter ended December 31,
2006. Virgin Media changed its company name from NTL Incorporated on February 6, 2007. This earnings release contains
historical financial information on both an actual reported basis and a pro forma basis. The pro forma results for the quarter ended
December 31, 2005 assume that the merger with Telewest took place on January 1, 2005. No pro forma financial information has
been presented in respect of the acquisition of Virgin Mobile, which closed on July 4, 2006.

Highlights: Fourth Quarter 2006
      • Rebranded from NTL:Telewest to Virgin Media
      • Revenue growth in all segments
      • 78,100 broadband net RGU additions, 38,500 TV net RGU additions
      • Churn reduced to 1.7%
      • Cable ARPU of £42.82, up £0.34 vs Q3-06
      • Successfully completed first major billing system integration
      • Underlying OCF growth. Impacted by cable merger implementation, other M&A
         activities and rebrand costs
                                                                       Pro forma
                                                   Q4 2006     Q3 2006  Q4 2005
            Revenue                                     £m         £m       £m
              Cable
                  Consumer                            644.4      642.8    631.2
                  Business                            168.8      162.3    168.2
                                                      813.2      805.1    799.4
              Mobile                                  151.7      140.4        -
              Content                                 116.7       79.4    116.7
            Total Revenue                           1,081.6    1,024.9    916.1

               OCF
                     Cable                                              296.8           296.3           283.2
                     Mobile                                              14.2            16.0               -
                     Content                                              2.0             5.5             8.8
               Total OCF                                                313.0           317.8           292.0

               Operating income/(loss)                                     9.2           (9.6)          (19.4)

OCF in the fourth quarter has been negatively impacted by £19.1m of implementation costs relating to the merger with Telewest
(Q3-06: £14.2m), £5.0m of rebrand expenses (Q3-06: £0m) and £2.3m of legal and professional costs related to M&A activity (Q3-
06: £0m). OCF is operating income before depreciation, amortization and other charges and is a non-GAAP financial measure.
Please see Appendix F for reconciliations of non-GAAP financial measures to their nearest GAAP equivalents. The pro forma
results for the quarter ended December 31, 2005 assume that the merger with Telewest took place on January 1, 2005. The pro
forma presentation set forth above and elsewhere in this earnings release is non-GAAP financial information that management
believes facilitates a comparative analysis of developments in our business. Please see Appendices E and F for a discussion of our
pro forma financial information.

Review of 2006 – 12 months of building a strong platform for future growth

          Completed Telewest merger and Virgin Mobile acquisition
     •
          Delivered synergy savings and headcount reductions
     •
          Completed first billing system integration
     •
          Announced rebranding to Virgin Media (implemented Feb 2007)
     •
          Significant ARPU growth
     •
          Launched innovative new product bundles (eg 4 for £40, VIP)
     •
          Completed roll-out of superior products VOD, HDTV and DVR
     •
          Made significant customer care improvements
     •
          Established new management team with track record of success
     •


                                                                 1
Steve Burch, Chief Executive Officer of Virgin Media, said:

      “Our first set of figures released under our new name show continued improvement, with
      revenue growth across all segments, good growth in ARPU and triple play penetration,
      reduced churn and strong broadband and TV net additions. Underlying OCF growth was
      strong before the impact of merger implementation, rebrand and M&A costs.

      Overall, the performance of the underlying business is on track and provides a strong
      foundation for the rebranding to Virgin Media. Consumer reaction to the rebrand, announced
      on February 8, has been very encouraging. Our rebrand and the ongoing improvements to
      our business that it reflects, signal a great opportunity for our customers and investors and
      poses a serious challenge to our competitors.”


Contacts

Investor Relations:
Richard Williams:   +44 (0) 20 7299 5479 / richard.williams@virginmedia.co.uk
Vani Bassi:         +44 (0) 20 7299 5353 / vani.bassi@virginmedia.co.uk

Media:
M: Communications
Lisa Gordon:          +44 (0) 20 7153 1540
Nick Fox:             +44 (0) 20 7153 1548


                                                     2
RESULTS FOR THE THREE MONTHS ENDED DECEMBER 31, 2006

OPERATIONAL REVIEW

The commentary below refers to financial results prepared on both an actual reported and pro forma
basis. The historical actual reported results consolidate Telewest from March 3, 2006, the date of the
closing of the merger between NTL and Telewest and consolidate Virgin Mobile from July 4, 2006, the
date of the closing of its acquisition. The pro forma results for the quarter ended December 31, 2005
assume that the merger with Telewest occurred on January 1, 2005. No pro forma financial information
has been presented in respect of the acquisition of Virgin Mobile. The pro forma financial information is
non-GAAP financial information that management believes facilitates a comparative analysis of
developments in the Company’s business. Please see Appendices E and F for a discussion of our pro
forma financial information.

Unless otherwise indicated, all historical references to operational statistics including customer and
subscriber figures, ARPU and churn are on a pro forma basis assuming the merger with Telewest
occurred on January 1, 2005.

Revenue

Total revenue in the fourth quarter increased to £1,081.6 million (Q3 2006: £1,024.9m) due to revenue
growth in all segments. Year on year revenue growth in the fourth quarter was £597.0 million (Q4 2005:
£484.6m), due to the merger with Telewest and the acquisition of Virgin Mobile.

Cable Segment Revenue

Consumer

Consumer revenue in the fourth quarter was £644.4 million (Q3 2006: £642.8m), reflecting primarily an
increase in ARPU to £42.82 from £42.48. Consumer revenue increased by £13.2 million compared to the
same pro forma period in the previous year, due to an increase in ARPU, reflecting our drive to
encourage triple play bundling and a focus on better quality customers.

Cable ARPU has grown in the quarter due mainly to an increase in RGU per customer from 2.14 to 2.17
and an increase in triple play penetration from 38.7% to 40.6%. We have focused on acquiring new
bundled customers and on cross-selling to existing customers and also made some selected price rises.

Gross customer additions in the fourth quarter were 213,500, down from 229,200 in the third quarter. As
anticipated in our third quarter earnings announcement, this was due to the cessation of installation
activity during a billing system migration and a lower level of installations in the last two weeks of
December because of the holiday season.

Churn in the fourth quarter was 1.7%, down from 1.8% in the third quarter. Gross disconnections were
250,500, down 16,000 compared to the previous quarter. As expected, churn continued to be impacted
by policy and process changes undertaken to align old NTL areas with Telewest.

Net customer losses were 37,000 in the quarter, essentially flat as compared to the previous quarter.

Our current carriage agreement with BSkyB for carriage of its basic channels ends on February 28, 2007.
As of the time of this release, we have not reached agreement with BSkyB to renew this agreement. We
have offered them a binding arbitration process covering both the Sky basics and Virgin Media Television
channel carriage contracts and are awaiting their response. Sky’s premium sports and movie channels
are not impacted by the negotiation and will continue to be available to Virgin Media customers. Despite a
dramatic and sustained decline in the Sky basic channels’ popularity in Virgin Media households (they
have lost an average of 7% of their cable viewing every year over the past four years), Sky demanded a
price that bears no relation to the channels’ popularity and is radically out of line with the way it values our
own Virgin Media TV channels on its own network.

If Sky withdraws its basic channels, we will no longer have to pay BSkyB significant wholesale charges
for its channels. We will divert some of these savings into further content additions to our existing on-


                                                       3
demand library. Although we expect that there may be a short term impact on customer churn and
customer acquisition, we believe our differentiated VOD content, and the excellent value and flexibility of
our product bundles will continue to attract and retain customers.

The Consumer division and its TV, telephony and broadband business was rebranded to Virgin Media on
February 8, 2007 backed by a significant advertising campaign. We believe that the unique flavor and
customer focus of the Virgin brand, underpinned by the progress we have made in customer service and
product innovation, will also give our growth fresh impetus.


Broadband

We continue to experience strong growth in the number of broadband subscribers with net additions of
78,100 in the quarter, continuing at the level experienced in the previous quarter.

As an end-to-end network owner, cable has inbuilt advantages in the quality of broadband service that we
offer. Customers can receive consistent speeds no matter where they live on our network and a top
speed of 10Mb is available throughout our broadband addressable areas. We will be increasing this to
20Mb in June and we are also currently conducting a residential trial of a 50Mb broadband service.

Our product superiority was recognized in February when we were named Best Consumer ISP at the
Internet Services Providers’ Association Awards. The award recognized that we demonstrate outstanding
value for money and customer care.

Television

Digital television net additions were 83,900, following net additions of 85,800 in the previous quarter.
Total TV net additions, which includes analog television, were 38,500 in the quarter, up from 22,200 in the
previous quarter. Growth has been strong due to the continued roll-out of new products alongside
compelling marketing and product propositions.

Video-on-demand (VOD) is now available to all of our digital subscribers. Unlike other providers, our
range of content is extensive with many thousands of hours of content including over 500 movies,
highlights from the previous week’s primetime schedule, over 2,000 hours of top TV series and over
1,000 music videos available every day. We have VOD content available from HBO, Buena Vista,
Warner, BBC, Channel 4, Alliance Atlantis, Virgin Media TV and further major content additions are
expected throughout the year, as we divert some of the savings from the Sky basics channels,
strengthening our line up and adding even more choice for our subscribers.

We have recently launched an innovative new service, Virgin Central, a revolutionary kind of television
channel. Virgin Central heralds a new way to watch TV, combining the simplicity of a traditional channel
with the choice and control of next generation TV-on-demand technology. The channel hosts a
continuously refreshing showcase of blockbuster entertainment around the clock. By pressing one button
and using a simple on-screen guide, viewers have instant access to different episodes of the show they
select. They can then stop, rewind and pause - just like using a DVD player. Virgin Central includes free
access to hit shows like The OC, Nip/Tuck, Little Britain, Criminal Minds, Grey’s Anatomy, Spooks and
West Wing. Content will be updated regularly and, unlike a traditional TV channel, there will be no waiting
for scheduled start times.

The hybrid service marks a step change in the development of TV-on-demand - making access to a
library of additional viewing more exciting and intuitive than using a static on-screen menu. The new
channel complements our existing library of TV-on-demand entertainment.

We have also completed the roll-out of our newly rebranded V+ box, which is a high definition (HDTV)
compatible digital video recorder (DVR). We believe this is the best on the market with 80 hours recording
time, three tuners and full VOD capability. We currently have 79,000 V+ subscribers. We have over 150
hours of HD content and will be expanding this range.


                                                    4
Telephony

Telephony net subscriber losses in the quarter were 64,300, partially as a result of competitive pressure.
The installation shutdown and the holiday season slowdown, referred to above, also had a negative
effect. There was also a small increase in disconnects as telephony continued to be impacted by policy
and process changes undertaken to align old NTL areas with Telewest.

In order to address these subscriber losses, we are refocusing the way we market and sell some of our
bundles to try and ensure that telephony is always pushed at the point of sale. We have also continued
our strategy of increasing the number of subscribers on flat rate packages to reduce the impact of
declining fixed line telephony usage.


Off-net

Off-net revenues were largely from Virgin.net, our wholly owned broadband ISP which offers broadband
and telephony services using BT Group’s wholesale products rather than our own cable network.
Virgin.net also rebranded to Virgin Media on February 8, 2007.

Consumer off-net revenue in the fourth quarter was down slightly at £17.2 million (Q3 2006: £17.6m),
reflecting a reduction in telephony and dial-up customers, but good growth in broadband. By the year-
end, we had 260,800 off-net broadband subscribers following a further 18,000 net additions in the
quarter, up from 7,800 net additions in the previous quarter, and 38,300 off-net telephony subscribers.
Customer growth has been strong on the back of new bundle packages and pricing.

The current year will see an aggressive roll-out of our off-net strategy which is being developed to
leverage the Virgin Media brand nationally by extending it into non-cable areas. We plan for off-net to
represent a significant portion of our growth platform for our national Virgin Media business.

We are close to securing a wholesale local loop unbundling provider, which will enable us to launch new
quad-play product propositions outside of our cable network with only modest capital investment. In
addition, ahead of that, we plan to launch a Virgin Media branded multi-channel Digital Terrestrial TV set
top box that we will bundle with our off-net telephone, broadband and mobile products. We plan to
enhance this proposition significantly in 2008, by offering an IPTV service, including pay broadcast
channels and VOD to customers outside of our cable areas on unbundled exchanges.

A key benefit from our off-net strategy will be our ability to offer a Virgin Media branded quad-play to the
significant number of cable customers who churn because they are moving out of our addressable areas.

Business

Business revenue in the fourth quarter was £168.8 million, up £6.5 million compared to the third quarter
primarily due to increased wholesale revenues from voice and fiber circuit kit sales, and an increase in
retail data sales of £1.9 million. These wholesale increases were at a relatively low gross margin. The kit
sales to a major wholesale mobile customer signify the completion of the build of a Wide Transmission
Network (WTN) and are therefore not expected to recur significantly in 2007. Future wholesale revenues
from that customer will be for operational and maintenance of the WTN and we expect that wholesale
revenues will be approximately £10 million to £15 million lower in the first quarter of 2007.

In the short term, we believe the UK market for voice and wholesale services remains challenging.
However, we are well positioned for further growth in data revenues.

We have a lower unit network cost than our competitors, a strong capable network and a substantial
increase in scale from the Telewest merger, which should enable us to continue to deliver strong
cashflow from our Business services.


                                                     5
Cable Segment OCF

Cable segment OCF in the quarter was £296.8 million, up £0.5 million compared to the previous quarter.
This was due mainly to underlying growth and a £9 million increase in the realization of cost synergies
being partially offset by £5.0 million of rebrand expenses, £2.3 million of legal and professional expenses
relating to Merger and Acquisition activity and a £4.9 million increase in cable merger implementation
costs. Implementation costs increased from the third quarter primarily due to the costs associated with the
billing system migration we completed in December.

Cable segment OCF was up £142.1 million as compared to the same quarter last year due mainly to the
merger with Telewest.


Mobile Segment

Virgin Mobile was acquired on July 4, 2006 and we have consolidated its results of operations from that
date. Total mobile revenue in the fourth quarter was £151.7 million (Q3 2006: £140.4m) comprising
£141.8 million service revenue and £9.9 million equipment revenue.

Revenue growth was primarily due to increased mobile monthly ARPU and a full quarter’s revenue
following the acquisition.

ARPU rose to £10.59 in the fourth quarter (Q3 2006: £10.28) due to an increase in the number of high
ARPU contract customers and higher usage.

Net customer additions in the quarter were 11,100, compared to 122,700 in the previous quarter.
Customer growth was lower than expected due to increased price competition and higher advertising
spend from our mobile competitors. We continued to grow the number of higher ARPU and more valuable
contract customers, as well as overall revenue. We anticipate that net customer additions in the first
quarter of 2007 will be significantly negative, reflecting normal seasonal weakness, which generally
follows the holiday sales period.

We continue to expect good subscriber growth for the full year 2007. Our focus will revolve around the
reinvigoration of our “value” marketing messaging, continuing to focus on our growing contract business,
cross-selling to our cable customer base, exploiting and benefiting from the marketing investment of the
Virgin Media rebrand and further retail store openings. These stores will also sell the full range of Virgin
Media products.

Mobile OCF was £14.2 million in the quarter, down from £16.0 million in the previous quarter due mainly
to seasonally increased marketing and subscriber acquisition costs.


Content Segment

The Content segment consists of Virgin Media Television and Sit-up. Virgin Media Television was
rebranded from Flextech on February 8, 2007.

Total content segment revenue, after inter segment elimination of £5.8 million, was £116.7 million in the
fourth quarter (Q3 2006: £79.4m), comprising £34.7 million from Virgin Media Television and £82.0 million
from Sit-up. This increase was largely due to seasonal growth at Sit-up and advertising growth at Virgin
Media Television.

Virgin Media Television sells programming to the Virgin Media cable business. For consolidation
purposes therefore, these amounts have been eliminated.

Virgin Media Television revenue, after inter segment elimination, was £34.7 million in the quarter, up £2.8
million from the previous quarter. This was due mainly to an increase in advertising revenue from £19.1
million to £20.8 million reflecting an increase in commercial impacts and growth in Virgin Media
Television’s market share of TV advertising. Virgin Media Television revenue, after inter segment


                                                     6
elimination, was up £2.1 million compared to the pro forma fourth quarter of 2005 due mainly to an
increase in advertising revenue.

Virgin Media Television has recently signed a new two-year carriage contract with British Sky
Broadcasting for the carriage of its channels, which runs from January 1, 2007. As a result, subscription
revenue is expected to be approximately £30 million lower in 2007 than in 2006. We believe that BSkyB
has deliberately undervalued these channels purely because they are owned by its principal pay-TV
competitor. The effect on overall group revenue is fairly immaterial as fourth quarter subscription revenue
represented just 0.8% of group revenue. An “off screen” or non-programming cost reduction plan is in
place to address some of this shortfall, but nevertheless 2007 Content OCF is expected to be significantly
affected.

Despite the reduction in subscription revenue, we intend to continue to increase investment in “on screen”
programming costs in order to continue to further strengthen our channels, grow commercial impacts and
secure increased advertising revenue in future years.

Strong growth in Sit-up revenue in the fourth quarter, up £34.5 million to £82.0 million (Q3 2006: £47.5m)
reflects the seasonal impact. Consequently, it is expected that, consistent with our experience in 2006,
first quarter revenue will reflect a material decline of approximately £30 million following the end of the
holiday season.

Content segment OCF in the quarter contributed £2.0 million, down £3.5 million from the prior quarter due
to improved performance at Sit-up being offset by the seasonal increase in programming expense.
Compared to the same pro forma period last year, Content segment OCF was down £6.8 million due
mainly to lower margins at Sit-up.


Operating Income before Depreciation, Amortization and Other Charges (OCF)

OCF was up £158.3 million compared to the fourth quarter of 2005, due to the merger with Telewest and
the acquisition of Virgin Mobile.

OCF of £313.0 million in the fourth quarter (Q3 2006: £317.8m) reflects a number of items relating to the
merger and other corporate expenses.

Approximately £29 million of estimated synergy cost savings were realized from the merger, an increase
of £9 million compared to the previous quarter. This was offset by £5.0 million of rebrand expenses, £2.3
million of legal and professional expenses relating to Merger and Acquisition activity, a £4.9 million
increase to £19.1 million of cable merger implementation costs, and seasonal reductions in Mobile and
Content OCF as discussed above.

We continue to expect to achieve a run rate of approximately £250 million of estimated synergy savings
by the end of 2007, consisting of £200 million of operational expenditure savings and £50 million of
capital expenditure savings.

In January, we began the extensive marketing campaign behind our new Virgin Media brand. We expect
this to increase our normal marketing and communication costs by over £25 million in 2007, with
approximately £16 million to be incurred in the first quarter.

We expect OCF in the first quarter to be negatively impacted by lower Business wholesale revenues and
increased brand marketing spend as discussed above.

OCF is a non-GAAP financial measure. See Appendix F for reconciliations of non-GAAP financial
measures to their nearest GAAP equivalents.


                                                    7
Operating Income/Loss and Loss From Continuing Operations

Operating income in the fourth quarter was £9.2 million (Q3 2006: £9.6 million loss) and compares with
an operating loss of £34.4 million in the fourth quarter of 2005 due to the merger with Telewest and the
acquisition of Virgin Mobile.

Loss from continuing operations was £88.1 million (Q3 2006: £104.2m). This loss was £31.9 million
higher than in the fourth quarter of 2005 due mainly to the merger with Telewest and the acquisition of
Virgin Mobile.


Capital Expenditure

Fixed asset additions (accrual basis) in the quarter were £178.6 million (Q3 2006: £147.3m). This
benefited from approximately £9 million of estimated synergy cost savings resulting from the merger. This
was more than offset, however, by the fixed asset merger integration expense incurred in the quarter of
£32.0 million mainly relating to the first major billing system integration.

Compared to the fourth quarter of 2005, fixed asset additions (accrual basis) were up £84.0 million due
mainly to the merger with Telewest.

The total purchase of fixed assets was £147.8 million in the quarter, compared to £133.6 million in the
previous quarter and £71.8 million in the same quarter last year.

Fixed asset additions (accrual basis) is a non-GAAP financial measure. See Appendix F for
reconciliations of non-GAAP financial measures to their nearest GAAP equivalents.


Net Debt

As of December 31, 2006, net debt was £5,741 million. This consisted of £5,025 million outstanding
under the Senior Credit Facility, £1,024 million of Senior Notes, and £110 million of capital leases and
other, offset by £418 million of cash and cash equivalents. Total liabilities as of December 31, 2006 were
£8,013 million.

Cash interest paid (exclusive of amounts capitalized) was £59 million in the quarter and £327 million for
the full year.

Net debt is a non-GAAP financial measure. See Appendix F for reconciliations of non-GAAP financial
measures to their nearest GAAP equivalents.


                                                    8
“Safe Harbor” Statement under the Private Securities Litigation Reform Act of 1995:
Various statements contained in this document constitute “forward looking statements” as that term is
defined under the Private Securities Litigation Reform Act of 1995. Words like “believe,” “anticipate,”
“should,” “intend,” “plan,” “will,” “expects,” “estimates,” “projects,” “positioned,” “strategy,” and similar
expressions identify these forward looking statements, which involve known and unknown risks,
uncertainties and other factors that may cause our actual results, performance or achievements or
industry results to be materially different from those contemplated, projected, forecasted, estimated or
budgeted, whether expressed or implied, by these forward looking statements. These factors include: (1)
the ability to compete with a range of other communications and content providers; (2) the ability to
control customer churn; (3) the effect of technological changes on our businesses; (4) the ability to use
the Virgin name and logo; (5) the ability to maintain and upgrade our networks in a cost-effective and
timely manner; (6) possible losses in revenues due to systems failures; (7) the ability to provide attractive
programming at a reasonable cost; (8) the reliance on single-source suppliers for some equipment,
software and services and third party distributors of our mobile services; (9) the functionality or market
acceptance of new products that we may introduce; (10) the failure to obtain and retain expected
synergies from the merger of our legacy NTL and Telewest businesses and the acquisition of Virgin
Mobile; (11) the rate of success in executing, managing and integrating key acquisitions, including the
merger with Telewest and the acquisition of Virgin Mobile; (12) the ability to achieve business plans for
the combined company; (13) the ability to fund debt service obligations through operating cash flow; (14)
the ability to obtain additional financing in the future and react to competitive and technological changes;
(15) the ability to comply with restrictive covenants in our indebtedness agreements; and (16) the extent
to which our future earnings will be sufficient to cover our fixed charges.

These and other factors are discussed in more detail under “Risk Factors” and elsewhere in Virgin
Media’s Form 10-K filed with the SEC on February 28, 2006, Virgin Media Holdings Inc.’s Form 10-K filed
with the SEC on March 1, 2006 and Virgin Media’s Forms 10-Q filed with the SEC on May 10, 2006,
August 9, 2006 and November 9, 2006. We assume no obligation to update our forward looking
statements to reflect actual results, changes in assumptions or changes in factors affecting these
statements.


                                                     9
Change of Company Name

On February 6, 2007, NTL Incorporated changed its name to Virgin Media Inc.

NTL-Telewest Merger

On March 3, 2006, NTL Holdings Inc. (formerly known as NTL Incorporated and now known as Virgin
Media Holdings Inc.), merged with a subsidiary of NTL Incorporated formerly known as Telewest Global,
Inc. and now known as Virgin Media Inc. Because this transaction was accounted for as a reverse
acquisition, the actual reported financial information included in this release is of the corporation now
known as Virgin Media Holdings Inc. for the period through March 3, 2006 and thereafter it reflects the
reverse acquisition of Telewest Global, Inc. The pro forma financial information treats the merger as if it
occurred at the beginning of the relevant year.

Virgin Mobile Acquisition

On July 4, 2006, we completed the acquisition of Virgin Mobile Holdings (UK) plc, or Virgin Mobile. Virgin
Mobile is the largest mobile virtual network operator in the United Kingdom, with approximately 4.5 million
customers. We have entered into a long-term trademark license agreement with Virgin Enterprises
Limited pursuant to which we have re-branded our existing consumer and part of our content businesses
with the Virgin brand.

Non-GAAP Financial Measures

We use non-GAAP financial measures with a view to providing investors with a better understanding of
the operating results and underlying trends to measure past and future performance and liquidity.

We evaluate operating performance based on several non-GAAP financial measures, including (i)
operating income before depreciation, amortization and other charges (OCF), (ii) fixed asset additions
(accrual basis) and (iii) net debt, as we believe these are important measures of the operational strength
of our business. Since these measures are not calculated in accordance with GAAP, they should not be
considered as substitutes for operating income (loss), purchase of fixed assets and total liabilities,
respectively, or as indicators of our operating performance, expenditure for fixed assets and total
liabilities.

Please see Appendix F for a discussion of our use of non-GAAP financial measures and reconciliations to
their nearest GAAP equivalents.

Pro Forma Financial Information

The pro forma presentation of our financial results contained herein is non-GAAP financial information.
We have included the pro forma information to provide a useful basis for evaluating developments in our
business over time, but it should not be viewed as a substitute for our GAAP financial information. Please
see Appendix E.


                                                    10
Appendices:

    A) Financial Statements
           Condensed Consolidated Statement of Operations
           Condensed Consolidated Balance Sheet
           Condensed Consolidated Statement of Cashflows
           Quarterly Condensed Consolidated Statement of Operations
    B) Group Residential Operations Statistics
    C) Segmental Analysis
    D) Fixed Asset Additions (Accrual basis)
    E) Pro Forma Combined Condensed Financial Information
    F) Use of Non-GAAP Financial Measures and Reconciliations to GAAP


                                            11
Appendices

A)     Financial Statements

CONDENSED CONSOLIDATED STATEMENT OF OPERATIONS
(in £ millions, except per share data)

                                                                              Three months ended       Year ended
                                                                                  December 31,        December 31,
                                                                               2006          2005      2006            2005

Revenue                                                                      1,081.6        484.6    3,602.2     1,947.6

Costs and expenses
   Operating costs (exclusive of depreciation shown separately below)          510.4       205.2     1,572.8       808.3
   Selling, general and administrative expenses                                258.2       124.7       906.9       483.0
   Other charges                                                                15.6        22.4        67.0        24.8
   Depreciation                                                                207.9       139.5       799.1       541.7
   Amortization                                                                 80.3        27.2       246.6       109.5
   Total costs and expenses                                                  1,072.4       519.0     3,592.4     1,967.3
Operating income (loss)                                                          9.2       (34.4)        9.8       (19.7)

Other income(expense)
    Interest income and other, net                                              10.4          7.8       34.7           29.4
    Interest expense                                                          (124.8)       (55.6)    (457.4)        (235.8)
    Share of income from equity investments                                      4.1            -       12.5              -
    Foreign currency transaction gains (losses)                                  7.7         35.2      (90.1)           5.3
    Gain (loss) on extinguishment of debt                                        0.1            -      (32.8)          (2.0)
    Gains on derivative instruments                                              3.2          0.9        1.3            0.9
Loss from continuing operations before income taxes,
minority interest and cumulative effect of changes in accounting principle     (90.1)       (46.1)    (522.0)        (221.9)
Income tax benefit (expense)                                                     1.0        (10.1)      11.8          (18.8)
Minority interest                                                                1.0            -        1.0           (1.0)
Loss from continuing operations                                                (88.1)       (56.2)    (509.2)        (241.7)

Discontinued operations
    Income from discontinued operations before income taxes                        -          0.2           -           5.7
    Gain on disposal of assets                                                  (0.2)            -       7.9         657.2
    Income tax expense                                                             -         (0.2)          -          (0.2)
    Income from discontinued operations                                         (0.2)          0.0        7.9         662.7

Cumulative effect of changes in accounting principle                           (33.8)           -      (32.6)             -

Net (loss)income                                                              (122.1)       (56.2)    (533.9)        421.0


Basic and diluted loss from continuing operations per share                   (£0.27)      (£0.26)    (£1.74)        (£1.13)

Basic and diluted income from discontinued operations per share                £0.00        £0.00      £0.03          £3.10

Basic and diluted loss from cumulative effect of changes in
    accounting principle per share                                            (£0.10)           -     (£0.11)             -

Basic and diluted net (loss)income per share                                  (£0.37)      (£0.26)    (£1.82)         £1.97

Dividends per share                                                            £0.01            -      £0.03              -

Average number of shares outstanding (in millions)                             323.8        212.8      292.9          213.8


                                                                  12
CONDENSED CONSOLIDATED BALANCE SHEET
(in £ millions)
                                                                                  December 31,   September 30, December 31,
                                                                                     2006           2006          2005

 Assets
 Current assets
     Cash and cash equivalents                                                         418.5          302.2         735.2
     Restricted cash                                                                     6.0            6.7           3.4
     Marketable securities                                                                 -              -          96.9
     Accounts receivable - trade, less allowance for doubtful accounts of
          £51.8 (Dec. 31, 2006) £58.9 (Sep. 30, 2006) and £41.7 (Dec. 31, 2005)        461.2          409.7         191.8
     Inventory                                                                          65.3           67.6             -
     Prepaid expenses and other current assets                                          87.4           94.7         112.4
         Total current assets                                                        1,038.4          880.9       1,139.7

 Fixed assets, net                                                                   6,026.3        6,088.6       3,294.9
 Goodwill and other indefinite-lived intangible assets                               2,516.5        2,484.0         193.0
 Intangible assets, net                                                              1,120.5        1,178.0         250.0
 Equity investments                                                                    371.5          387.5             -
 Other assets, net of accumulated amortization of £21.8 (Dec. 31, 2006)
      £15.7 (Sep. 30, 2006) and £32.2 (Dec. 31, 2005)                                  170.3          173.9         110.9
 Total assets                                                                       11,243.5       11,192.9       4,988.5

 Liabilities and shareholders' equity
 Current liabilities
     Accounts payable                                                                  379.6          369.8         176.9
     Accrued expenses and other current liabilities                                    485.5          433.7         202.3
     VAT and employee taxes payable                                                     82.8           77.7          43.5
     Restructuring liabilities                                                         126.8          126.4          45.3
     Interest payable                                                                  158.2           94.4          37.8
     Deferred revenue                                                                  268.0          263.2         103.2
     Current portion of long term debt                                                 141.9          151.5           0.8
          Total current liabilities                                                  1,642.8        1,516.7         609.8

 Long term debt, net of current portion                                              6,017.2        6,055.5       2,279.2
 Deferred revenue and other long term liabilities                                      276.2          194.1         134.3
 Defered income taxes                                                                   77.2           77.0           9.2
 Total liabilities                                                                   8,013.4        7,843.3       3,032.5
 Commitments and contingent liabilities
 Minority interest                                                                         -            1.0           1.0
 Shareholders' equity
     Common stock                                                                        1.8            1.8           1.2
     Additional paid-in capital                                                      4,303.4        4,285.8       2,671.0
     Treasury stock                                                                        -              -        (114.0)
     Accumulated other comprehensive income                                            116.0          126.6          45.5
     Accumulated deficit                                                            (1,191.1)      (1,065.6)       (648.7)
          Total shareholders' equity                                                 3,230.1        3,348.6       1,955.0
 Total liabilities and shareholders' equity                                         11,243.5       11,192.9       4,988.5


                                                              13
CONDENSED CONSOLIDATED STATEMENT OF CASHFLOWS
(in £ millions)

                                                                               Year ended
                                                                              December 31,
                                                                           2006         2005

 Net cash provided by operating activities                                   786.1           325.6

 Investing activities
     Purchase of fixed assets                                                (544.8)     (288.1)
     Purchase of intangible assets                                            (10.0)          -
     Income from equity investments                                            15.7         0.7
     Acquisitions, net of cash acquired                                    (2,423.1)          -
     Proceeds from the sale of fixed assets                                     2.4         2.6
     Decrease in restricted cash                                                5.8        12.4
     Proceeds from sale of Broadcast operations, net                              -     1,229.0
     Proceeds from sale of Ireland operations, net                                -       216.2
           Net cash (used in) provided by investing activites              (2,954.0)    1,172.8

 Financing activities
     Proceeds from employee stock option exercises                             38.7         5.0
     Purchase of stock                                                            -      (114.0)
     New borrowings, net of financing fees                                  8,935.6           -
     Principal payments on long-term debt                                  (7,053.4)     (782.0)
     Capital lease payments                                                   (47.2)       (4.6)
     Dividends paid                                                            (8.5)          -
            Net cash provided by (used in) financing activities             1,865.2      (895.6)

 Cash flow from discontinued operations
     Net cash used in operating activities                                        -          (14.3)
     Net cash used in investing activities                                        -           (4.1)
           Net cash used in discontinued operations                               -          (18.4)

 Effect of exchange rate changes on cash and cash equivalents                 (14.0)          25.6

 (Decrease) increase in cash and cash equivalents                           (316.7)          610.0

 Cash and cash equivalents, at beginning of year                             735.2           125.2
 Cash and cash equivalents, at end of year                                   418.5           735.2

 Supplemental disclosure of cash flow information
 Cash paid during the year for interest exclusive of amounts capitalized      327.1          216.8
 Income taxes paid                                                              7.7            2.2


                                                                14
QUARTERLY CONDENSED CONSOLIDATED STATEMENT OF OPERATIONS
 (in £ millions, except share and per share data) (unaudited)


                                                                                                 Three months ended
                                                                           Dec 31,    Sep 30,        Jun 30,    Mar 31,   Dec 31,
                                                                              2006       2006          2006       2006      2005

Revenue                                                                    1,081.6    1,024.9         884.3       611.4    484.6

Costs and expenses
      Operating costs (exclusive of depreciation shown separately below)    510.4      440.0          367.5      254.9     205.2
      Selling, general and administrative expenses                          258.2      267.1          223.5      158.1     124.7
      Other charges                                                          15.6       30.9           12.1        8.4      22.4
      Depreciation                                                          207.9      222.6          219.3      149.3     139.5
      Amortization                                                           80.3       73.9           55.6       36.8      27.2
     Total costs and expenses                                              1,072.4    1,034.5         878.0      607.5     519.0
Operating income (loss)                                                        9.2       (9.6)          6.3        3.9     (34.4)

Other income (expense)
      Interest income and other, net                                         10.4         7.1           8.6        8.6       7.8
      Interest expense                                                      (124.8)    (113.2)       (135.6)     (83.8)    (55.6)
      Share of income from equity investments                                  4.1        3.9           3.1        1.4       0.9
      Foreign currency transaction gains(losses)                               7.7        6.3         (94.1)     (10.0)     35.2
      Gain(loss) on extinguishment of debt                                     0.1       (0.5)            -      (32.4)        -
      Gains(losses) on derivative instruments                                  3.2        1.6           5.7       (9.2)        -
Loss from continuing operations before income taxes, minority
interest and cumulative effect of changes in accounting principle            (90.1)    (104.4)       (206.0)    (121.5)    (46.1)
Income tax benefit(expense)                                                    1.0        0.9           9.9          -     (10.1)
Minority interest                                                              1.0       (0.7)          0.3        0.4         -
Loss from continuing operations                                              (88.1)    (104.2)       (195.8)    (121.1)    (56.2)

Discontinued operations
     Income from discontinued operations before income taxes                     -          -             -          -       0.2
     Gain on disposal of assets                                               (0.2)       8.1             -          -      (0.2)
      Income tax expense                                                         -          -             -           -         -
      Income from discontinued operations                                     (0.2)       8.1           0.0         0.0       0.0

Cumulative effect of changes in accounting principle                         (33.8)         -             -        1.2         -

Net (loss)income                                                            (122.1)     (96.1)       (195.8)    (119.9)    (56.2)


Basic and diluted loss from continuing operations per share                 (£0.27)    (£0.32)       (£0.68)    (£0.49)   (£0.26)

Basic and diluted income from discontinued operations per share              £0.00      £0.02         £0.00       £0.00    £0.00

Basic and diluted loss from cumulative effect of changes in
      accounting principle per share                                        (£0.10)         -             -       £0.00        -

Basic and diluted net loss per share                                        (£0.37)    (£0.30)       (£0.68)    (£0.49)   (£0.26)


                                                                             323.8      322.0         287.9       245.5    212.8
Average number of shares outstanding (in millions)


                                                                    15
B)      GROUP RESIDENTIAL OPERATIONS STATISTICS
        (data in 000’s)
                                                                                            Group (1)
                                                                     Q4-06        Q3-06          Q2-06          Q1-06              Q4-05
Group RGUs
 Opening RGUs                                                      15,271.4     15,100.0       15,015.3      14,805.6         14,432.3
 Data Cleanse (2)                                                                                 (69.0)                         (43.1)
                                                                         -             -                             -
 Adjusted Opening RGUs                                             15,271.4     15,100.0       14,946.3      14,805.6         14,389.2
 Net RGU adds                                                          76.9        171.4          153.7         209.7            428.7
 Reduction to customer count (3)                                                                                                 (12.3)
                                                                         -             -              -              -
Closing Group RGUs                                                 15,348.3     15,271.4       15,100.0      15,015.3         14,805.6

Group RGUs
 On-net Telephone                                                   4,114.0      4,178.3        4,233.0       4,268.1          4,260.0
 On-net TV                                                          3,353.9      3,315.4        3,293.1       3,315.9          3,310.3
 On-net Broadband                                                   3,058.5      2,980.4        2,902.3       2,821.7          2,630.3
Total On-net                                                       10,526.4     10,474.1       10,428.4      10,405.7         10,200.6
 Off-net Telephone                                                     38.3         42.8           47.6          53.2             60.3
 Off-net Broadband                                                    260.8        242.8          235.0         224.8            198.7
Total Off-net                                                         299.1        285.6          282.6         278.0            259.0
Mobile                                                              4,522.8      4,511.7        4,389.0       4,331.6          4,346.0
Total RGUs                                                         15,348.3     15,271.4       15,100.0      15,015.3         14,805.6

Net RGU adds
 On-net Telephone                                                    (64.3)        (54.6)        (21.6)            8.1                0.8
 On-net TV                                                             38.5          22.2           8.3            5.6              23.3
 On-net Broadband                                                      78.1          78.1        104.9          191.4              191.7
Total On-net                                                           52.3          45.7          91.7         205.1              215.8
 Off-net Telephone                                                    (4.5)         (4.8)         (5.6)          (7.1)              (4.1)
 Off-net Broadband                                                     18.0           7.8          10.2           26.1              24.4
Total Off-net                                                          13.5           3.0           4.6           19.0              20.3
Mobile                                                                 11.1        122.7           57.4         (14.4)             192.6
Total Net RGU adds                                                     76.9        171.4         153.7          209.7              428.7


Notes
(1) Subscriber information is on a pro forma combined basis assuming that the merger with Telewest and the acquisition of Virgin
    Mobile had occurred on January 1, 2005.

(2)   Data cleanse activity in Q2-06 resulted in a decrease of 69,000 RGUs, a decrease of approximately 13,500 Telephone, 24,400
      Broadband and 31,100 TV RGUs. Data cleanse activity in Q2-06 is a result of more closely aligning customer definitions between
      old NTL and old Telewest together with the removal of approximately 20,000 inactive backlog customers in old NTL.
      Data cleanse activity in Q4-05 resulted in a decrease in old NTL of 43,100 RGUs, a decrease of approximately 17,700 Telephone,
      26,600 Broadband and an increase of 1,300 net TV RGUs.

      Review of inactive backlog customers in Q4-05 resulted in an adjustment to remove an additional 10,000 customers, representing
(3)
      approximatley 12,300 RGUs.


                                                              16
RESIDENTIAL CABLE OPERATIONS STATISTICS (excluding Off-net and Mobile)
(data in 000’s except percentages, RGU/Customer and ARPU)


                                                                              Pro forma Virgin Media (1)
                                                                   Q4-06          Q3-06         Q2-06          Q1-06            Q4-05
Customers
 Opening Customers                                               4,891.5        4,928.7        4,983.8        4,958.0         4,945.4
 Data Cleanse (2)                                                      -              -          (36.2)             -           (18.1)
 Adjusted Opening Customers                                      4,891.5        4,928.7        4,947.6        4,958.0         4,927.3

 Gross customer adds                                               213.5          229.2          192.3          218.1           248.9
 Total Customer disconnections                                   (250.5)        (266.5)        (211.2)        (192.3)         (208.2)
 Net customer adds                                                (37.0)         (37.3)         (18.9)           25.8            40.7
 Reduction to customer count (3)                                       -              -              -              -           (10.0)
Closing Customers                                                4,854.5        4,891.5        4,928.7        4,983.8         4,958.0

Monthly customer churn %                                            1.7%           1.8%           1.5%          1.3%             1.4%

Cable RGUs
 Opening RGUs                                                   10,474.1       10,428.4       10,405.7       10,200.6        10,040.2
 Data Cleanse (2)                                                      -              -          (69.0)             -           (43.1)
 Adjusted Opening RGUs                                          10,474.1       10,428.4       10,336.7       10,200.6         9,997.1
 Net RGU adds                                                       52.3           45.7            91.7         205.1           215.8
 Reduction to RGU count (3)                                            -              -               -             -           (12.3)
Closing RGUs                                                    10,526.4       10,474.1       10,428.4       10,405.7        10,200.6

Net RGU Adds
 Telephone                                                         (64.3)         (54.6)         (21.6)           8.1             0.8
 Television                                                          38.5           22.2            8.3           5.6            23.3
   DTV                                                              83.9           85.8           73.8           70.6            85.5
 Broadband                                                           78.1           78.1         104.9          191.4           191.7
Total Net RGU Adds                                                   52.3           45.7           91.7         205.1           215.8

Revenue Generating Units (RGUs)
 Telephone                                                       4,114.0        4,178.3        4,233.0        4,268.1         4,260.0
 Television                                                      3,353.9        3,315.4        3,293.1        3,315.9         3,310.3
   DTV                                                           3,005.9        2,922.0        2,836.2        2,786.5         2,715.9
 Broadband                                                       3,058.5        2,980.4        2,902.3        2,821.7         2,630.3
Total RGUs                                                      10,526.4       10,474.1       10,428.4       10,405.7        10,200.6

RGU / Customer                                                      2.17           2.14           2.12           2.09             2.06

Internet Customers
  Dial-up and DTV access                                            73.3           97.0          113.3          140.4           181.6
  Broadband                                                      3,058.5        2,980.4        2,902.3        2,821.7         2,630.3
Total Internet                                                   3,131.9        3,077.4        3,015.6        2,962.1         2,811.9

Bundled Customers
 Dual RGU                                                        1,725.7        1,798.3        1,838.9        1,939.1         2,033.2
 Triple RGU                                                      1,972.8        1,892.1        1,830.4        1,741.4         1,604.6
 Percentage of dual or triple RGUs                                76.2%          75.4%          74.4%          73.8%           73.4%
 Percentage of triple RGUs                                        40.6%          38.7%          37.1%          34.9%           32.4%

Cable ARPU                                                        £42.82         £42.48         £42.21         £41.50          £41.27
 ARPU calculation:
 On-net revenues                                                £626,700      £625,400       £628,400       £618,600         £613,400
 Average customers                                                4,878.8       4,907.4        4,962.3        4,969.2         4,954.1

Homes Marketable On-net
 Telephone                                                      12,431.4       12,427.1       12,312.7       12,311.2        12,299.7
 ATV                                                            12,509.7       12,505.5       12,661.1       12,656.7        12,652.8
 DTV                                                            11,986.3       11,982.2       12,009.7       11,989.2        11,972.3
 Broadband                                                      11,819.6       11,815.4       11,766.2       11,745.7        11,613.6
 Total homes                                                    12,509.7       12,505.5       12,661.1       12,656.7        12,652.8

Penetration of Homes Marketable On-net
 Telephone                                                        33.1%           33.6%         34.4%          34.7%            34.6%
 Television - Total                                               26.8%           26.5%         26.0%          26.2%            26.2%
 Television - DTV                                                 25.1%           24.4%         23.6%          23.2%            22.7%
 Broadband                                                        25.9%           25.2%         24.7%          24.0%            22.6%
 Total Customer                                                   38.8%           39.1%         38.9%          39.4%            39.2%
     Notes
     (1) Subscriber information is on a pro forma combined basis assuming that the old Telewest and old NTL merger had occurred on
         January 1, 2005 and reflects old Telewest and old NTL reported on-net with prior periods restated for policy alignments, where
         applicable.
     (2) Data cleanse activity in Q2-06 resulted in a decrease of 36,200 customers and 69,000 RGUs, a decrease of approximately
         13,500 Telephone, 24,400 Broadband and 31,100 TV RGUs. Data cleanse activity in Q2-06 is a result of more closely aligning
         customer definitions between old NTL and old Telewest together with the removal of approximately 20,000 inactive backlog
         customers in old NTL.
         Data cleanse activity in Q4-05 resulted in a decrease in old NTL of 18,100 customers and 43,100 RGUs, a decrease of
         approximately 17,700 Telephone, 26,600 Broadband and an increase of 1,300 net TV RGUs.
     (3) Review of inactive backlog customers in Q4-05 resulted in an adjustment to remove an additional 10,000 customers, representing
         approximatley 12,300 RGUs.
     (4) A table showing old NTL operational statistics for Q1-06 on an actual basis reflecting the merger with old Telewest on March 3,
         2006 can be found in our Form 10Q for Q1-06, filed with the SEC on May 10, 2006.

                                                                             17
RESIDENTIAL CABLE OPERATIONS STATISTICS (excluding Off-net and Mobile)
(data in 000’s except percentages, RGU/Customer and ARPU)


                                                    Old Telewest (1&4)                                      Old NTL on-net (1)
                                           Q4-06      Q3-06     Q2-06      Q1-06     Q4-05      Q4-06       Q3-06       Q2-06       Q1-06      Q4 05
Customers
 Opening Customers                        1,894.4    1,886.8   1,886.8    1,868.2   1,848.1    2,997.1     3,042.0     3,097.0     3,089.8    3,097.3
 Data Cleanse (2)                                                 (3.7)                                                  (32.5)                 (18.1)
                                                -         -                    -         -           -           -                       -
 Adjusted Opening Customers               1,894.4    1,886.8   1,883.1    1,868.2   1,848.1    2,997.1     3,042.0     3,064.5     3,089.8    3,079.2

 Gross customer adds                         84.8       87.9      73.2       79.2      86.1       128.7      141.3        119.2      138.9      162.8
 Total Customer disconnections             (72.4)     (80.3)    (69.5)     (60.6)    (66.0)     (178.1)    (186.2)      (141.7)    (131.7)    (142.2)
 Net customer adds                          12.4         7.6       3.7      18.6      20.1       (49.4)     (44.9)       (22.5)        7.2       20.6
 Reduction to customer count (3)                                                                                                                (10.0)
                                                -         -          -         -         -           -           -           -           -
Closing Customers                         1,906.8    1,894.4   1,886.8    1,886.8   1,868.2    2,947.7     2,997.1     3,042.0     3,097.0    3,089.8

Monthly customer churn %                    1.3%       1.4%      1.2%       1.1%      1.2%        2.0%       2.1%         1.6%       1.5%       1.6%

Cable RGUs
 Opening RGUs                             4,273.3    4,212.9   4,164.9    4,059.6   3,955.2    6,200.8     6,215.5     6,240.8     6,141.0    6,085.0
 Data Cleanse (2)                                                 (4.6)                                                  (64.4)                 (43.1)
                                                -         -                    -         -           -           -                       -
 Adjusted Opening RGUs                    4,273.3    4,212.9   4,160.3    4,059.6   3,955.2    6,200.8     6,215.5     6,176.4     6,141.0    6,041.9
 Net RGU adds                                80.5       60.4      52.6      105.3     104.4      (28.2)      (14.7)        39.1       99.8      111.4
 Reduction to RGU count (3)                                                                                                                     (12.3)
                                                -         -          -         -         -           -           -           -           -
Closing RGUs                              4,353.8    4,273.3   4,212.9    4,164.9   4,059.6    6,172.6     6,200.8     6,215.5     6,240.8    6,141.0

Net RGU Adds
 Telephone                                  (2.6)      (5.1)      1.2      11.5        0.5       (61.7)     (49.5)       (22.8)      (3.4)        0.3
 Television                                 27.8       17.1       1.2       3.3       19.0         10.7        5.2          7.1        2.3        4.3
   DTV                                      36.0       26.3      15.2      21.4       42.6        47.9       59.5         58.6       49.2       42.9
 Broadband                                  55.3       48.5      50.1      90.5       84.9        22.8       29.6         54.8      100.9      106.8
Total Net RGU Adds                           80.5       60.4      52.5     105.3      104.4      (28.2)     (14.7)         39.1       99.8      111.4

Revenue Generating Units (RGUs)
 Telephone                                1,691.2    1,693.8   1,698.9    1,698.4   1,686.9    2,422.8     2,484.5     2,534.0     2,569.7    2,573.1
 Television                               1,415.0    1,387.2   1,370.2    1,370.9   1,367.6    1,938.9     1,928.1     1,922.9     1,945.0    1,942.7
   DTV                                    1,368.1    1,332.1   1,305.8    1,292.2   1,270.8    1,637.8     1,589.9     1,530.4     1,494.3    1,445.1
 Broadband                                1,247.6    1,192.3   1,143.8    1,095.6   1,005.1    1,810.9     1,788.1     1,758.5     1,726.1    1,625.2
Total RGUs                                4,353.8    4,273.3   4,212.9    4,164.9   4,059.6    6,172.6     6,200.8     6,215.5     6,240.8    6,141.0

RGU / Customer                               2.28       2.26      2.23       2.21      2.17       2.09        2.07        2.04        2.02       1.99

Internet Customers
  Dial-up and DTV access                     22.6        29.1    32.3    44.3    57.9              50.7       67.9         81.0       96.1      123.7
  Broadband                               1,247.6     1,192.3 1,143.8 1,095.6 1,005.1           1,810.9    1,788.1      1,758.5    1,726.1    1,625.2
Total Internet                           1,270.2     1,221.4 1,176.1 1,139.9 1,063.0           1,861.7    1,856.0      1,839.5    1,822.2    1,748.9

Bundled Customers
 Dual RGU                                  674.1      695.2     721.8      756.9     794.0     1,051.6    1,103.1      1,117.2    1,182.2    1,239.2
 Triple RGU                                886.4      841.9     802.2      760.6     698.6     1,086.4    1,050.2      1,028.2      980.8      906.0
 Percentage of dual or triple RGUs         81.8%      81.1%     80.8%      80.4%     79.9%       72.5%      71.8%        70.5%      69.8%      69.4%
 Percentage of triple RGUs                 46.5%      44.4%     42.5%      40.3%     37.4%       36.9%      35.0%        33.8%      31.7%      29.3%

Cable ARPU                                 £46.55     £45.61   £45.46     £45.15    £45.13      £40.43      £40.52      £40.21      £39.28     £38.96
 ARPU calculation:
 On-net revenues                         £265,700 £258,300 £257,600 £254,300 £251,900         £361,000    £367,100    £370,800    £364,300   £361,500
 Average customers                        1,902.4  1,887.9 1,888.6 1,877.4 1,860.6              2,976.4    3,019.5      3,073.7    3,091.8    3,093.5

Homes Marketable On-net
 Telephone                                4,706.8    4,702.5   4,700.2    4,701.2   4,698.4    7,724.6    7,724.6      7,612.5    7,610.0    7,601.3
 ATV                                      4,711.1    4,706.9   4,704.8    4,702.9   4,700.8    7,798.6    7,798.6      7,956.3    7,953.8    7,952.0
 DTV                                      4,593.0    4,588.9   4,586.5    4,568.5   4,525.2    7,393.3    7,393.3      7,423.2    7,420.7    7,447.1
 Broadband                                4,593.0    4,588.9   4,586.5    4,568.5   4,525.2    7,226.6    7,226.6      7,179.7    7,177.2    7,088.4

Penetration of Homes Marketable On-net
 Telephone                                 35.9%      36.0%     36.1%      36.1%     35.9%      31.4%       32.2%       33.3%       33.8%      33.9%
 Television - Total                        30.0%      29.5%     29.1%      29.1%     29.1%      24.9%       24.7%       24.2%       24.5%      24.4%
 Television - DTV                          29.8%      29.0%     28.5%      28.3%     28.1%      22.2%       21.5%       20.6%       20.1%      19.4%
 Broadband                                 27.2%      26.0%     24.9%      24.0%     22.2%      25.1%       24.7%       24.5%       24.0%      22.9%
 Total Customer                            40.5%      40.2%     40.1%      40.1%     39.7%      37.8%       38.4%       38.2%       38.9%      38.9%


Notes
(1) Subscriber information reflects old Telewest and old NTL reported on-net with prior periods restated for policy alignments, where applicable.
(2) Data cleanse activity in Q2-06 resulted in a decrease in old Telewest of 3,700 customers and 4,600 RGUs, a decrease of approximately 700 Telephone,
    2,000 Broadband and 1,900 TV RGUs, and in old NTL of 32,500 customers and 64,400 RGUs, a decrease of approximately 12,800 Telephone,
    22,400 Broadband and 29,200 TV RGUs. Data cleanse activity in Q2-06 is a result of more closely aligning customer definitions betwwen old NTL
    and old Telewest together with the removal of approximately 20,000 inactive backlog customers in old NTL.
    Data cleanse activity in Q4-05 resulted in a decrease in old NTL of 18,100 customers and 43,100 RGUs, a decrease of approximately 17,700 Telephone,
    26,600 Broadband and an increase of 1,300 net TV RGUs.
(3) Review of inactive backlog customers in Q4-05 resulted in an adjustment to remove 10,000 inactive backlog disconnects, representing approximately
    12,300 RGUs.
(4) Old Telewest operational statistics given above for Q1-06 are for the full 3 months ended March 31, 2006 on a pro forma basis including
    the period prior to the merger with old NTL.

                                                                              18
MOBILE OPERATIONS STATISTICS
(data in 000's except ARPU)

                                                                                               Mobile
                                                                     Q4-06          Q3-06           Q2-06          Q1-06             Q4-05
Mobile Customers (90 day active) (1 & 2)
 Opening Customers                                                  4,511.7        4,389.0        4,331.6         4,346.0           4,153.4
 Net customer adds                                                     11.1          122.7           57.4           (14.4)            192.6
Closing Mobile Customers (90 day active)                            4,522.8        4,511.7        4,389.0         4,331.6           4,346.0

Mobile monthly ARPU (3)                                             £10.59          £10.28
 ARPU calculation:
 Service revenue                                                  £141,800       £132,500
 Average customers                                                  4,465.4        4,294.8


Notes
(1) Mobile customer information prior to acquisition has been taken, without adjustment, from Virgin Mobile's historical information.

(2)   90 day active customers - Prepay customers are defined as active customers if they have made an outbound event in the preceding
      90 days. Contract customers are defined as active customers if they have been provisioned and have not been disconnected.

(3)   Mobile monthly ARPU is calculated on service revenue for the periods since acquisition divided by the average 90 day active
      customers for the periods since acquisition, divided by three.


NTL OFF-NET OPERATIONS STATISTICS
(data in 000's)

                                                                                               Off-net
                                                                     Q4-06          Q3-06           Q2-06          Q1-06             Q4-05
Off-net RGUs
 Opening RGUs                                                         285.6          282.6          278.0           259.0            238.7
 Net RGU adds                                                          13.5            3.0            4.6            19.0             20.3
Closing off-net RGUs                                                  299.1          285.6          282.6           278.0            259.0

RGUs
 Telephone                                                             38.3           42.8           47.6            53.2             60.3
 Broadband                                                            260.8          242.8          235.0           224.8            198.7
Total RGUs                                                            299.1          285.6          282.6           278.0            259.0

Net RGU Adds
 Telephone                                                             (4.5)          (4.8)          (5.6)           (7.1)              (4.1)
 Broadband                                                             18.0             7.8          10.2            26.1               24.4
Total Net RGU Adds                                                     13.5             3.0            4.6           19.0               20.3


                                                                     19
C) SEGMENTAL ANALYSIS
(£ millions) (unaudited)


 Actual Reported                                                                   Three months ended
                                                             Dec 31,     Sep 30,       Jun 30,    Mar 31,       Dec 31,
                                                               2006        2006          2006       2006          2005
 Revenue
     Cable segment
           Consumer                                           645.4       643.7         645.1       461.7        379.4
           Business                                           169.0       162.3         160.1       122.8        105.2
           Total                                              814.4       806.0         805.2       584.5        484.6
           Inter segment revenue                               (1.2)       (0.9)         (0.4)       (0.3)           -
                                                              813.2       805.1         804.8       584.2        484.6
      Mobile segment
            Virgin Mobile                                     151.4       140.4             -            -            -
            Inter segment revenue                               0.3           -             -            -            -
                                                              151.7       140.4             -            -            -
      Content segment
            Flextech                                           40.5        37.8          40.1        12.8             -
            Sit-up                                             82.0        47.5          45.1        16.2             -
            Total                                             122.5        85.3          85.2        29.0             -
            Inter segment revenue                              (5.8)       (5.9)         (5.7)       (1.8)            -
                                                              116.7        79.4          79.5        27.2             -

 Total revenue                                               1,081.6     1,024.9        884.3        611.4        484.6

 Segment OCF
     Cable segment OCF                                        296.8       296.3         284.5       195.4        154.7
     Mobile segment OCF                                        14.2        16.0             -           -            -
     Content segment OCF                                        2.0         5.5           8.8         3.0            -
     OCF (Total)                                              313.0       317.8         293.3       198.4        154.7

 Pro Forma (for merger with Telewest)                                           Three months ended
                                                             Dec 31,    Sep 30,     Jun 30,     Mar 31,     Dec 31,
                                                               2006       2006        2006        2006        2005
                                                          (Reported) (Reported) (Reported) (Pro Forma) (Pro Forma)
 Revenue
     Cable segment
           Consumer                                           645.4       643.7         645.1       637.2        631.6
           Business                                           169.0       162.3         160.1       165.6        168.2
           Total                                              814.4       806.0         805.2       802.8        799.8
           Inter segment revenue                               (1.2)       (0.9)         (0.4)       (0.5)        (0.4)
                                                              813.2       805.1         804.8       802.3        799.4
      Mobile segment
            Virgin Mobile                                     151.4       140.4             -            -            -
            Inter segment revenue                               0.3           -             -            -            -
                                                              151.7       140.4             -            -            -
      Content segment
            Flextech                                           40.5        37.8          40.1        39.9         37.7
            Sit-up                                             82.0        47.5          45.1        51.9         84.1
            Total                                             122.5        85.3          85.2        91.8        121.8
            Inter segment revenue                              (5.8)       (5.9)         (5.7)       (5.3)        (5.1)
                                                              116.7        79.4          79.5        86.5        116.7

 Total revenue                                               1,081.6     1,024.9        884.3        888.8        916.1

 Segment OCF
      Cable segment OCF                                     296.8       296.3          284.5       267.6        283.2
      Mobile segment OCF                                      14.2        16.0             -            -            -
      Content segment OCF                                      2.0         5.5           8.8         9.4           8.8
      OCF (Total)                                           313.0       317.8          293.3       277.0        292.0
 Notes:
 Segment OCF includes inter segment revenue and costs as applicable. OCF (Total) is a non-GAAP financial measure - see Appendix F.
 The pro forma information presented in this schedule in respect of the three month periods ended March 31, 2006 and December 31, 2005
 have been prepared on a basis as if the merger with Telewest had occurred on January 1, 2006 and January 1, 2005, respectively - see
                                                          20
 Appendix E.
D)   Fixed Asset Additions (Accrual Basis)
     (in £ millions) (unaudited)
                                                                        Three months ended
                                                            Dec 31,    Sep 30, Jun 30, Mar 31,         Dec 31,
                                                              2006       2006    2006     2006           2005

NCTA Fixed Asset Additions
 CPE                                                           59.0       57.8       48.6      40.2       31.6
 Scaleable infrastructure                                      44.9       45.0       46.0      51.4       48.7
 Commercial                                                    18.5       16.5       19.6      13.4        6.2
 Line extensions                                                0.9        1.3        1.0       0.7             -
 Upgrade/rebuild                                                0.8        0.5        1.3       1.1        2.5
 Support capital                                               49.5       18.0       16.3      10.6        7.5
Total NCTA Fixed Asset Additions                              173.6      139.1      132.8     117.4       96.5
Non NCTA Fixed Asset Additions                                   5.0        8.2       1.1       0.4       (1.9)
Total Fixed Asset Additions (accrual basis)                   178.6      147.3      133.9     117.8       94.6

Change in capital accruals                                    (20.8)     (13.7)      (5.8)     17.5     (22.8)

Total Purchase of Fixed Assets and Intangible Assets          157.8      133.6      128.1     135.3       71.8

Comprising:
Purchase of Fixed Assets                                      147.8     133.6      128.1     135.3       71.8
Purchase of Intangible Assets                                  10.0           -         -         -             -
                                                              157.8     133.6       128.1     135.3       71.8

Note: Virgin Media is not a member of NCTA and is providing this information solely for comparative purposes.
Fixed Asset Additions (accrual basis) are from continuing operations. See Appendix F for a discussion of the
use of Fixed Asset Additions (accrual basis) as a non-GAAP financial measure and the reconciliation of Fixed
Asset Additions (accrual basis) to GAAP Purchase of Fixed Assets and Purchase of Intangible Assets.

Certain NCTA Fixed Asset Additions have been reallocated for the quarters ended March 31, June 30 and
September 30, 2006.


                                                      21
E) PRO FORMA COMBINED CONDENSED FINANCIAL INFORMATION
(in £ millions) (unaudited)

                                                                                                        Three months ended
                                                                               Dec 31,            Sep 30,      Jun 30,     Mar 31,              Dec 31,
                                                                                2006               2006         2006        2006                 2005
                                                                             (Reported)         (Reported)      (Reported)     (Pro Forma)     (Pro Forma)
Revenue                                                                         1,081.6             1,024.9          884.3           888.8           916.1
Costs and expenses
 Operating costs (exclusive of depreciation shown separately below)                510.4              440.0          367.5           369.0          399.1
 Selling, general and administrative expenses                                      258.2              267.1          223.5           242.8          225.0
 Other charges                                                                      15.6               30.9           12.1             8.9           22.4
 Depreciation                                                                      207.9              222.6          219.3           210.4          229.2
 Amortization                                                                       80.3               73.9           55.6            58.6           59.8
                                                                                 1,072.4            1,034.5          878.0           889.7          935.5
Operating (loss)income                                                               9.2               (9.6)           6.3            (0.9)         (19.4)
Other income (expense)
 Interest income and other, net                                                     10.4                 7.1            8.6             8.3            7.4
 Interest expense                                                                 (124.8)             (113.2)        (135.6)         (112.0)        (126.9)
 Gain (loss) on extinguishment of debt                                               0.1                (0.5)           -             (32.4)           -
 Other, net                                                                          3.2                 1.6            5.7            (9.2)           4.0
 Share of income from equity investments                                             4.1                 3.9            3.1             5.0            2.5
 Foreign currency transaction gains (losses)                                         7.7                 6.3          (94.1)           (8.6)          33.0
(Loss) from continuing operations before income taxes                              (90.1)             (104.4)        (206.0)         (149.8)         (99.4)
Income tax benefit (expense)                                                         1.0                 0.9            9.9             -            (12.6)
Minority interest                                                                    1.0                (0.7)           0.3             0.4            -
(Loss) from continuing operations                                                  (88.1)             (104.2)        (195.8)         (149.4)        (112.0)

Reconciliation of Pro Forma OCF to Pro Forma Operating income (loss)
Pro Forma OCF                                                                      313.0              317.8          293.3           277.0          292.0
Less:
  Other charges                                                                    (15.6)              (30.9)         (12.1)           (8.9)         (22.4)
  Depreciation                                                                    (207.9)             (222.6)        (219.3)         (210.4)        (229.2)
  Amortization                                                                     (80.3)              (73.9)         (55.6)          (58.6)         (59.8)
Pro Forma Operating income (loss)                                                    9.2                (9.6)           6.3            (0.9)         (19.4)

The pro forma information presented in these schedules in respect of the three months ended March 31, 2006 has been prepared
on a basis as if the merger with Telewest had occurred on January 1, 2006 and the pro forma information in respect of the three
months ended on December 31, 2005 has been prepared on a basis as if the merger with Telewest had occurred on
January 1, 2005 and includes adjustments to reflect the purchase accounting impact on our historical results. Readers should
refer to the notes below for further explanation of the adjustments made.

These pro forma operating results are not necessarily indicative of the results that would have been achieved if the merger with
Telewest had occurred on January 1, 2006 or January 1, 2005, and undue reliance should not be placed on this information.

No pro forma financial information has been included in these schedules in respect of the results of Virgin Mobile prior to its acquisition.

The presentation does not include all the information and footnotes required by generally accepted accounting principles in the
United States to be included in pro forma financial statements.


                                                                      22
Proforma Combined Condensed Financial Information
Three months ended March 31, 2006 (in £ millions) (unaudited)

                                                                             NTL Inc.        Telewest           Total           Pro Forma
                                                                            As reported     Jan 1 - Mar 3    Adjustments        Combined


Revenue                                                                           611.4            279.9                (2.5)        888.8
Costs and expenses
  Operating costs (exclusive of depreciation shown separately below)              254.9              88.5            25.6            369.0
  Selling, general and administrative expenses                                    158.1            110.0            (25.3)           242.8
  Other charges                                                                      8.4              0.5               -               8.9
  Depreciation                                                                    149.3              66.1               (5.0)        210.4
  Amortization                                                                      36.8              8.4            13.4             58.6
                                                                                  607.5            273.5                8.7          889.7
Operating income (loss)                                                              3.9              6.4           (11.2)             (0.9)
Other income (expense)
  Interest income and other, net                                                     8.6              4.0               (4.3)           8.3
  Interest expense                                                                 (83.8)           (22.2)              (6.0)       (112.0)
  (Loss) on extinguishment of debt                                                 (32.4)             -                 -             (32.4)
  Other, net                                                                        (9.2)             -                 -              (9.2)
  Share of income from equity investments                                            1.4              3.6               -               5.0
  Foreign currency transaction (losses) gains                                      (10.0)             1.4               -              (8.6)
(Loss) from continuing operations before income taxes                             (121.5)            (6.8)          (21.5)          (149.8)
Income tax (expense) benefit                                                         -                -                 -               -
Minority interest                                                                    0.4              -                 -               0.4
Cumulative effect of a change in accounting principle                                1.2              0.8               -               2.0
(Loss) from continuing operations                                                 (119.9)            (6.0)          (21.5)          (147.4)


For the three months ended March 31, 2006, the unaudited pro forma combined condensed financial information contains the actual
combined operating results of NTL with the results of Telewest for the period from January 1, 2006 to March 3, 2006 adjusted to include the
pro forma impact of: the elimination of transactions between the former NTL and the former Telewest; the adjustment of amortization of
acquired intangible assets and depreciation of fixed assets based on the preliminary purchase price allocation; the adjustment of interest
income based on the reduced cash balance after the merger transaction; the adjustment of interest expense based on the refinancing in
March 2006 using the new senior credit facility and bridge facility borrowing rates; to reflect the impact of income taxes on the pro forma
adjustments utilizing NTL's statutory tax rate of 35% and certain accounting policy alignment adjustments. Readers can refer to the
Unaudited Pro Forma Combined Condensed Financial Data filed on Form 8-K/A on May 10, 2006, for detailed descriptions of the
adjustments made to this information.


                                                              23
Proforma Combined Condensed Financial Information
Three months ended December 31, 2005 (in £ millions) (unaudited)

                                                                             Historical     Historical       Total           Pro Forma
                                                                                NTL         Telewest      Adjustments        Combined


Revenue                                                                           484.6         434.5                (3.0)       916.1
Costs and expenses

  Operating costs (exclusive of depreciation shown separately below)              205.2         163.9             30.0           399.1
  Selling, general and administrative expenses                                    124.7         133.8            (33.5)          225.0
  Other charges                                                                    22.4            -                 -             22.4
  Depreciation                                                                    139.5           97.9               (8.2)       229.2
  Amortization                                                                     27.2           16.0            16.6             59.8
                                                                                  519.0         411.6                4.9         935.5
Operating income (loss)                                                           (34.4)          22.9               (7.9)        (19.4)
Other income (expense)
  Interest income and other, net                                                      7.8          6.1               (6.5)          7.4
  Interest expense                                                                (55.6)         (43.1)          (28.2)          (126.9)
  (Loss) on extinguishment of debt                                                    -            -                 -              -
  Other, net                                                                          0.9          3.1               -              4.0
  Share of income from equity investments                                             -            2.5               -              2.5
  Foreign currency transaction (losses) gains                                      35.2           (2.2)              -             33.0
(Loss) from continuing operations before income taxes                             (46.1)         (10.7)          (42.6)           (99.4)
Income tax (expense) benefit                                                      (10.1)          (2.5)              -            (12.6)
Minority interest                                                                     -            -                 -              -
(Loss) from continuing operations                                                 (56.2)         (13.2)          (42.6)          (112.0)


For the three months ended December 31, 2005, the unaudited pro forma combined condensed financial information contains the
actual combined operating results of NTL and the former Telewest adjusted to include the pro forma impact of: the elimination of
transactions between the former NTL and the former Telewest; the adjustment of amortization of acquired intangible assets and
depreciation of fixed assets based on the preliminary purchase price allocation; the adjustment of interest income based on the
reduced cash balance after the transaction; the adjustment of interest expense based on the refinancing in March 2006 using the new
senior credit facility and bridge facility borrowing rates; to reflect the impact of income taxes on the pro forma adjustments utilizing
NTL's statutory tax rate of 35% and certain accounting policy alignment adjustments. Readers can refer to the Unaudited Pro Forma
Combined Condensed Financial Data filed on Form 8-K/A on May 10, 2006, for detailed descriptions of the adjustments made to this
information.


                                                            24
virgin media.FINALVM_Q406_PressRelease

Weitere ähnliche Inhalte

Was ist angesagt?

Quarterly report (Q2) 2007
Quarterly report (Q2) 2007Quarterly report (Q2) 2007
Quarterly report (Q2) 2007Tele2
 
virgin media. Q3_07_PressRelease
virgin media. Q3_07_PressReleasevirgin media. Q3_07_PressRelease
virgin media. Q3_07_PressReleasefinance28
 
Press Releases 3 Q05 En
Press Releases 3 Q05 EnPress Releases 3 Q05 En
Press Releases 3 Q05 EnTIM RI
 
'GCap Media' by Grant Goddard
'GCap Media' by Grant Goddard'GCap Media' by Grant Goddard
'GCap Media' by Grant GoddardGrant Goddard
 
celanese mr_q1_2005_e
celanese mr_q1_2005_ecelanese mr_q1_2005_e
celanese mr_q1_2005_efinance44
 
230155 FY 2016 half year
230155 FY 2016 half year230155 FY 2016 half year
230155 FY 2016 half yearRebecca Hick
 
Interim results Q4 2009
Interim results Q4 2009Interim results Q4 2009
Interim results Q4 2009EDB
 
virgin media. 5F9EF289-C398-4329-BA49-891BADC51F1D_FINAL_VM_Q4-08_Press_Release
virgin media. 5F9EF289-C398-4329-BA49-891BADC51F1D_FINAL_VM_Q4-08_Press_Releasevirgin media. 5F9EF289-C398-4329-BA49-891BADC51F1D_FINAL_VM_Q4-08_Press_Release
virgin media. 5F9EF289-C398-4329-BA49-891BADC51F1D_FINAL_VM_Q4-08_Press_Releasefinance28
 
091021 Mtg Q3 Ppt
091021 Mtg Q3 Ppt091021 Mtg Q3 Ppt
091021 Mtg Q3 Pptbanski
 
'United Kingdom Commercial Radio In Numbers: Q3 2009' by Grant Goddard
'United Kingdom Commercial Radio In Numbers: Q3 2009' by Grant Goddard'United Kingdom Commercial Radio In Numbers: Q3 2009' by Grant Goddard
'United Kingdom Commercial Radio In Numbers: Q3 2009' by Grant GoddardGrant Goddard
 
Investing in Growth – Capital Markets Day 2011
Investing in Growth – Capital Markets Day 2011Investing in Growth – Capital Markets Day 2011
Investing in Growth – Capital Markets Day 2011Modern Times Group MTG AB
 
Crompton greaves ru4 qfy2010-180510
Crompton greaves ru4 qfy2010-180510Crompton greaves ru4 qfy2010-180510
Crompton greaves ru4 qfy2010-180510Angel Broking
 

Was ist angesagt? (18)

Q1 2010 Financial results presentation
Q1 2010 Financial results presentationQ1 2010 Financial results presentation
Q1 2010 Financial results presentation
 
Quarterly report (Q2) 2007
Quarterly report (Q2) 2007Quarterly report (Q2) 2007
Quarterly report (Q2) 2007
 
virgin media. Q3_07_PressRelease
virgin media. Q3_07_PressReleasevirgin media. Q3_07_PressRelease
virgin media. Q3_07_PressRelease
 
Press Releases 3 Q05 En
Press Releases 3 Q05 EnPress Releases 3 Q05 En
Press Releases 3 Q05 En
 
Q1 2006 Presentation
Q1 2006 PresentationQ1 2006 Presentation
Q1 2006 Presentation
 
'GCap Media' by Grant Goddard
'GCap Media' by Grant Goddard'GCap Media' by Grant Goddard
'GCap Media' by Grant Goddard
 
Q1 2007 Presentation
Q1 2007 PresentationQ1 2007 Presentation
Q1 2007 Presentation
 
celanese mr_q1_2005_e
celanese mr_q1_2005_ecelanese mr_q1_2005_e
celanese mr_q1_2005_e
 
230155 FY 2016 half year
230155 FY 2016 half year230155 FY 2016 half year
230155 FY 2016 half year
 
Interim results Q4 2009
Interim results Q4 2009Interim results Q4 2009
Interim results Q4 2009
 
virgin media. 5F9EF289-C398-4329-BA49-891BADC51F1D_FINAL_VM_Q4-08_Press_Release
virgin media. 5F9EF289-C398-4329-BA49-891BADC51F1D_FINAL_VM_Q4-08_Press_Releasevirgin media. 5F9EF289-C398-4329-BA49-891BADC51F1D_FINAL_VM_Q4-08_Press_Release
virgin media. 5F9EF289-C398-4329-BA49-891BADC51F1D_FINAL_VM_Q4-08_Press_Release
 
091021 Mtg Q3 Ppt
091021 Mtg Q3 Ppt091021 Mtg Q3 Ppt
091021 Mtg Q3 Ppt
 
'United Kingdom Commercial Radio In Numbers: Q3 2009' by Grant Goddard
'United Kingdom Commercial Radio In Numbers: Q3 2009' by Grant Goddard'United Kingdom Commercial Radio In Numbers: Q3 2009' by Grant Goddard
'United Kingdom Commercial Radio In Numbers: Q3 2009' by Grant Goddard
 
Q1 2009 Presentation
Q1 2009 PresentationQ1 2009 Presentation
Q1 2009 Presentation
 
Telefonica 171109
Telefonica 171109Telefonica 171109
Telefonica 171109
 
Investing in Growth – Capital Markets Day 2011
Investing in Growth – Capital Markets Day 2011Investing in Growth – Capital Markets Day 2011
Investing in Growth – Capital Markets Day 2011
 
Q4 2005 Presentation
Q4 2005 PresentationQ4 2005 Presentation
Q4 2005 Presentation
 
Crompton greaves ru4 qfy2010-180510
Crompton greaves ru4 qfy2010-180510Crompton greaves ru4 qfy2010-180510
Crompton greaves ru4 qfy2010-180510
 

Andere mochten auch

monsanto 04-02-08
monsanto 04-02-08monsanto 04-02-08
monsanto 04-02-08finance28
 
virgin media. FINAL_VM_Q308_Press_Release
virgin media. FINAL_VM_Q308_Press_Releasevirgin media. FINAL_VM_Q308_Press_Release
virgin media. FINAL_VM_Q308_Press_Releasefinance28
 
monsanto 01_08_09
monsanto 01_08_09monsanto 01_08_09
monsanto 01_08_09finance28
 
.monsanto supplemental_toolkit
.monsanto  supplemental_toolkit.monsanto  supplemental_toolkit
.monsanto supplemental_toolkitfinance28
 
virgin media. _q12008_final
virgin media. _q12008_finalvirgin media. _q12008_final
virgin media. _q12008_finalfinance28
 
virgin media. _q42007_final
virgin media. _q42007_finalvirgin media. _q42007_final
virgin media. _q42007_finalfinance28
 
monsanto 06_25_08
monsanto 06_25_08monsanto 06_25_08
monsanto 06_25_08finance28
 

Andere mochten auch (7)

monsanto 04-02-08
monsanto 04-02-08monsanto 04-02-08
monsanto 04-02-08
 
virgin media. FINAL_VM_Q308_Press_Release
virgin media. FINAL_VM_Q308_Press_Releasevirgin media. FINAL_VM_Q308_Press_Release
virgin media. FINAL_VM_Q308_Press_Release
 
monsanto 01_08_09
monsanto 01_08_09monsanto 01_08_09
monsanto 01_08_09
 
.monsanto supplemental_toolkit
.monsanto  supplemental_toolkit.monsanto  supplemental_toolkit
.monsanto supplemental_toolkit
 
virgin media. _q12008_final
virgin media. _q12008_finalvirgin media. _q12008_final
virgin media. _q12008_final
 
virgin media. _q42007_final
virgin media. _q42007_finalvirgin media. _q42007_final
virgin media. _q42007_final
 
monsanto 06_25_08
monsanto 06_25_08monsanto 06_25_08
monsanto 06_25_08
 

Ähnlich wie virgin media.FINALVM_Q406_PressRelease

virgin media.FINAL_VM_Q1_07_Press_Release
virgin media.FINAL_VM_Q1_07_Press_Releasevirgin media.FINAL_VM_Q1_07_Press_Release
virgin media.FINAL_VM_Q1_07_Press_Releasefinance28
 
sprint nextel Quarterly Results 2006 3rd
sprint nextel Quarterly Results 2006 3rdsprint nextel Quarterly Results 2006 3rd
sprint nextel Quarterly Results 2006 3rdfinance6
 
virgin media. _q12008_final
virgin media. _q12008_finalvirgin media. _q12008_final
virgin media. _q12008_finalfinance28
 
virgin media.FINAL_Q4_06_Presentation_VMED
virgin media.FINAL_Q4_06_Presentation_VMEDvirgin media.FINAL_Q4_06_Presentation_VMED
virgin media.FINAL_Q4_06_Presentation_VMEDfinance28
 
virgin media.FINAL_Q4_06_Presentation_VMED
virgin media.FINAL_Q4_06_Presentation_VMEDvirgin media.FINAL_Q4_06_Presentation_VMED
virgin media.FINAL_Q4_06_Presentation_VMEDfinance28
 
qwest communications Q3 04
qwest communications Q3 04qwest communications Q3 04
qwest communications Q3 04finance19
 
liberty global Q3_2008__Presentation
liberty global Q3_2008__Presentationliberty global Q3_2008__Presentation
liberty global Q3_2008__Presentationfinance43
 
liberty global Q3_2008__Presentation
liberty global Q3_2008__Presentationliberty global Q3_2008__Presentation
liberty global Q3_2008__Presentationfinance43
 
Com Hem - Interim Report Q2 2014 – Presentation
Com Hem - Interim Report Q2 2014 – PresentationCom Hem - Interim Report Q2 2014 – Presentation
Com Hem - Interim Report Q2 2014 – Presentationcomhemgroup
 
qwest communications q_q4 04er
qwest communications q_q4 04erqwest communications q_q4 04er
qwest communications q_q4 04erfinance19
 
sprint nextel Quarterly Results 2006 4th
sprint nextel Quarterly Results 2006 4thsprint nextel Quarterly Results 2006 4th
sprint nextel Quarterly Results 2006 4thfinance6
 
qwest communications 1Q 06 Earnings
qwest communications 1Q 06 Earningsqwest communications 1Q 06 Earnings
qwest communications 1Q 06 Earningsfinance19
 
Tim Q2-2020-Financial Results
Tim Q2-2020-Financial ResultsTim Q2-2020-Financial Results
Tim Q2-2020-Financial ResultsGruppo TIM
 
Q4 2014 earnings slides final
Q4 2014 earnings slides finalQ4 2014 earnings slides final
Q4 2014 earnings slides finalInvestorBruker
 
Internap Q4 2014 Earnings Presentation
Internap Q4 2014 Earnings PresentationInternap Q4 2014 Earnings Presentation
Internap Q4 2014 Earnings PresentationInternap
 
virgin media.Q1_07_Analyst_presentation_FINAL
virgin media.Q1_07_Analyst_presentation_FINALvirgin media.Q1_07_Analyst_presentation_FINAL
virgin media.Q1_07_Analyst_presentation_FINALfinance28
 
virgin media.Q1_07_Analyst_presentation_FINAL
virgin media.Q1_07_Analyst_presentation_FINALvirgin media.Q1_07_Analyst_presentation_FINAL
virgin media.Q1_07_Analyst_presentation_FINALfinance28
 
dbAccess TMT Conference
dbAccess TMT ConferencedbAccess TMT Conference
dbAccess TMT ConferenceGruppo TIM
 
Q1 2006 Earnings Release
Q1 2006 Earnings ReleaseQ1 2006 Earnings Release
Q1 2006 Earnings Releasefinance7
 

Ähnlich wie virgin media.FINALVM_Q406_PressRelease (20)

virgin media.FINAL_VM_Q1_07_Press_Release
virgin media.FINAL_VM_Q1_07_Press_Releasevirgin media.FINAL_VM_Q1_07_Press_Release
virgin media.FINAL_VM_Q1_07_Press_Release
 
sprint nextel Quarterly Results 2006 3rd
sprint nextel Quarterly Results 2006 3rdsprint nextel Quarterly Results 2006 3rd
sprint nextel Quarterly Results 2006 3rd
 
virgin media. _q12008_final
virgin media. _q12008_finalvirgin media. _q12008_final
virgin media. _q12008_final
 
virgin media.FINAL_Q4_06_Presentation_VMED
virgin media.FINAL_Q4_06_Presentation_VMEDvirgin media.FINAL_Q4_06_Presentation_VMED
virgin media.FINAL_Q4_06_Presentation_VMED
 
virgin media.FINAL_Q4_06_Presentation_VMED
virgin media.FINAL_Q4_06_Presentation_VMEDvirgin media.FINAL_Q4_06_Presentation_VMED
virgin media.FINAL_Q4_06_Presentation_VMED
 
qwest communications Q3 04
qwest communications Q3 04qwest communications Q3 04
qwest communications Q3 04
 
CBS qr1q 01
CBS qr1q 01CBS qr1q 01
CBS qr1q 01
 
liberty global Q3_2008__Presentation
liberty global Q3_2008__Presentationliberty global Q3_2008__Presentation
liberty global Q3_2008__Presentation
 
liberty global Q3_2008__Presentation
liberty global Q3_2008__Presentationliberty global Q3_2008__Presentation
liberty global Q3_2008__Presentation
 
Com Hem - Interim Report Q2 2014 – Presentation
Com Hem - Interim Report Q2 2014 – PresentationCom Hem - Interim Report Q2 2014 – Presentation
Com Hem - Interim Report Q2 2014 – Presentation
 
qwest communications q_q4 04er
qwest communications q_q4 04erqwest communications q_q4 04er
qwest communications q_q4 04er
 
sprint nextel Quarterly Results 2006 4th
sprint nextel Quarterly Results 2006 4thsprint nextel Quarterly Results 2006 4th
sprint nextel Quarterly Results 2006 4th
 
qwest communications 1Q 06 Earnings
qwest communications 1Q 06 Earningsqwest communications 1Q 06 Earnings
qwest communications 1Q 06 Earnings
 
Tim Q2-2020-Financial Results
Tim Q2-2020-Financial ResultsTim Q2-2020-Financial Results
Tim Q2-2020-Financial Results
 
Q4 2014 earnings slides final
Q4 2014 earnings slides finalQ4 2014 earnings slides final
Q4 2014 earnings slides final
 
Internap Q4 2014 Earnings Presentation
Internap Q4 2014 Earnings PresentationInternap Q4 2014 Earnings Presentation
Internap Q4 2014 Earnings Presentation
 
virgin media.Q1_07_Analyst_presentation_FINAL
virgin media.Q1_07_Analyst_presentation_FINALvirgin media.Q1_07_Analyst_presentation_FINAL
virgin media.Q1_07_Analyst_presentation_FINAL
 
virgin media.Q1_07_Analyst_presentation_FINAL
virgin media.Q1_07_Analyst_presentation_FINALvirgin media.Q1_07_Analyst_presentation_FINAL
virgin media.Q1_07_Analyst_presentation_FINAL
 
dbAccess TMT Conference
dbAccess TMT ConferencedbAccess TMT Conference
dbAccess TMT Conference
 
Q1 2006 Earnings Release
Q1 2006 Earnings ReleaseQ1 2006 Earnings Release
Q1 2006 Earnings Release
 

Mehr von finance28

virgin media.Q2-07_Analyst_presentation
virgin media.Q2-07_Analyst_presentationvirgin media.Q2-07_Analyst_presentation
virgin media.Q2-07_Analyst_presentationfinance28
 
virgin media.Q2-07_Analyst_presentation
virgin media.Q2-07_Analyst_presentationvirgin media.Q2-07_Analyst_presentation
virgin media.Q2-07_Analyst_presentationfinance28
 
virgin media.Q3_07_AnalystPresentation
virgin media.Q3_07_AnalystPresentationvirgin media.Q3_07_AnalystPresentation
virgin media.Q3_07_AnalystPresentationfinance28
 
virgin media.Q3_07_AnalystPresentation
virgin media.Q3_07_AnalystPresentationvirgin media.Q3_07_AnalystPresentation
virgin media.Q3_07_AnalystPresentationfinance28
 
virgin media.UBS_vmed_December07_FINAL
virgin media.UBS_vmed_December07_FINALvirgin media.UBS_vmed_December07_FINAL
virgin media.UBS_vmed_December07_FINALfinance28
 
virgin media.UBS_vmed_December07_FINAL
virgin media.UBS_vmed_December07_FINALvirgin media.UBS_vmed_December07_FINAL
virgin media.UBS_vmed_December07_FINALfinance28
 
virgin media._Q12008_presentation
virgin media._Q12008_presentationvirgin media._Q12008_presentation
virgin media._Q12008_presentationfinance28
 
virgin media.VMED_Q12008_presentation
virgin media.VMED_Q12008_presentationvirgin media.VMED_Q12008_presentation
virgin media.VMED_Q12008_presentationfinance28
 
virgin media.FINAL_Q208_Presentation
virgin media.FINAL_Q208_Presentationvirgin media.FINAL_Q208_Presentation
virgin media.FINAL_Q208_Presentationfinance28
 
virgin media.FINAL_Q208_Presentation
virgin media.FINAL_Q208_Presentationvirgin media.FINAL_Q208_Presentation
virgin media.FINAL_Q208_Presentationfinance28
 
virgin media.Q3_08_Presentation
virgin media.Q3_08_Presentationvirgin media.Q3_08_Presentation
virgin media.Q3_08_Presentationfinance28
 
virgin media.Q3_08_Presentation
virgin media.Q3_08_Presentationvirgin media.Q3_08_Presentation
virgin media.Q3_08_Presentationfinance28
 
virgin media.Analyst_day_november112008
virgin media.Analyst_day_november112008virgin media.Analyst_day_november112008
virgin media.Analyst_day_november112008finance28
 
virgin media.Analyst_day_november112008
virgin media.Analyst_day_november112008virgin media.Analyst_day_november112008
virgin media.Analyst_day_november112008finance28
 
virgin media.london_nov132008
virgin media.london_nov132008virgin media.london_nov132008
virgin media.london_nov132008finance28
 
virgin media.london_nov132008
virgin media.london_nov132008virgin media.london_nov132008
virgin media.london_nov132008finance28
 
virgin media.6941D70A-3672-40B9-ACBC-FC9BD36E1DFF_Q4-08_Presentation_FINAL
virgin media.6941D70A-3672-40B9-ACBC-FC9BD36E1DFF_Q4-08_Presentation_FINALvirgin media.6941D70A-3672-40B9-ACBC-FC9BD36E1DFF_Q4-08_Presentation_FINAL
virgin media.6941D70A-3672-40B9-ACBC-FC9BD36E1DFF_Q4-08_Presentation_FINALfinance28
 
virgin media.FINAL_VM_Q2-07_Press_Release
virgin media.FINAL_VM_Q2-07_Press_Releasevirgin media.FINAL_VM_Q2-07_Press_Release
virgin media.FINAL_VM_Q2-07_Press_Releasefinance28
 
virgin media._Q2-07_Press_Release
 virgin media._Q2-07_Press_Release virgin media._Q2-07_Press_Release
virgin media._Q2-07_Press_Releasefinance28
 

Mehr von finance28 (20)

virgin media.Q2-07_Analyst_presentation
virgin media.Q2-07_Analyst_presentationvirgin media.Q2-07_Analyst_presentation
virgin media.Q2-07_Analyst_presentation
 
virgin media.Q2-07_Analyst_presentation
virgin media.Q2-07_Analyst_presentationvirgin media.Q2-07_Analyst_presentation
virgin media.Q2-07_Analyst_presentation
 
virgin media.Q3_07_AnalystPresentation
virgin media.Q3_07_AnalystPresentationvirgin media.Q3_07_AnalystPresentation
virgin media.Q3_07_AnalystPresentation
 
virgin media.Q3_07_AnalystPresentation
virgin media.Q3_07_AnalystPresentationvirgin media.Q3_07_AnalystPresentation
virgin media.Q3_07_AnalystPresentation
 
virgin media.UBS_vmed_December07_FINAL
virgin media.UBS_vmed_December07_FINALvirgin media.UBS_vmed_December07_FINAL
virgin media.UBS_vmed_December07_FINAL
 
virgin media.UBS_vmed_December07_FINAL
virgin media.UBS_vmed_December07_FINALvirgin media.UBS_vmed_December07_FINAL
virgin media.UBS_vmed_December07_FINAL
 
virgin media._Q12008_presentation
virgin media._Q12008_presentationvirgin media._Q12008_presentation
virgin media._Q12008_presentation
 
virgin media.VMED_Q12008_presentation
virgin media.VMED_Q12008_presentationvirgin media.VMED_Q12008_presentation
virgin media.VMED_Q12008_presentation
 
virgin media.FINAL_Q208_Presentation
virgin media.FINAL_Q208_Presentationvirgin media.FINAL_Q208_Presentation
virgin media.FINAL_Q208_Presentation
 
virgin media.FINAL_Q208_Presentation
virgin media.FINAL_Q208_Presentationvirgin media.FINAL_Q208_Presentation
virgin media.FINAL_Q208_Presentation
 
virgin media.Q3_08_Presentation
virgin media.Q3_08_Presentationvirgin media.Q3_08_Presentation
virgin media.Q3_08_Presentation
 
virgin media.Q3_08_Presentation
virgin media.Q3_08_Presentationvirgin media.Q3_08_Presentation
virgin media.Q3_08_Presentation
 
virgin media.Analyst_day_november112008
virgin media.Analyst_day_november112008virgin media.Analyst_day_november112008
virgin media.Analyst_day_november112008
 
virgin media.Analyst_day_november112008
virgin media.Analyst_day_november112008virgin media.Analyst_day_november112008
virgin media.Analyst_day_november112008
 
virgin media.london_nov132008
virgin media.london_nov132008virgin media.london_nov132008
virgin media.london_nov132008
 
virgin media.london_nov132008
virgin media.london_nov132008virgin media.london_nov132008
virgin media.london_nov132008
 
virgin media.6941D70A-3672-40B9-ACBC-FC9BD36E1DFF_Q4-08_Presentation_FINAL
virgin media.6941D70A-3672-40B9-ACBC-FC9BD36E1DFF_Q4-08_Presentation_FINALvirgin media.6941D70A-3672-40B9-ACBC-FC9BD36E1DFF_Q4-08_Presentation_FINAL
virgin media.6941D70A-3672-40B9-ACBC-FC9BD36E1DFF_Q4-08_Presentation_FINAL
 
virgin media.6941D70A-3672-40B9-ACBC-FC9BD36E1DFF_Q4-08_Presentation_FINAL
virgin media.6941D70A-3672-40B9-ACBC-FC9BD36E1DFF_Q4-08_Presentation_FINALvirgin media.6941D70A-3672-40B9-ACBC-FC9BD36E1DFF_Q4-08_Presentation_FINAL
virgin media.6941D70A-3672-40B9-ACBC-FC9BD36E1DFF_Q4-08_Presentation_FINAL
 
virgin media.FINAL_VM_Q2-07_Press_Release
virgin media.FINAL_VM_Q2-07_Press_Releasevirgin media.FINAL_VM_Q2-07_Press_Release
virgin media.FINAL_VM_Q2-07_Press_Release
 
virgin media._Q2-07_Press_Release
 virgin media._Q2-07_Press_Release virgin media._Q2-07_Press_Release
virgin media._Q2-07_Press_Release
 

Kürzlich hochgeladen

Amil Baba In Pakistan amil baba in Lahore amil baba in Islamabad amil baba in...
Amil Baba In Pakistan amil baba in Lahore amil baba in Islamabad amil baba in...Amil Baba In Pakistan amil baba in Lahore amil baba in Islamabad amil baba in...
Amil Baba In Pakistan amil baba in Lahore amil baba in Islamabad amil baba in...amilabibi1
 
AnyConv.com__FSS Advance Retail & Distribution - 15.06.17.ppt
AnyConv.com__FSS Advance Retail & Distribution - 15.06.17.pptAnyConv.com__FSS Advance Retail & Distribution - 15.06.17.ppt
AnyConv.com__FSS Advance Retail & Distribution - 15.06.17.pptPriyankaSharma89719
 
原版1:1复刻堪萨斯大学毕业证KU毕业证留信学历认证
原版1:1复刻堪萨斯大学毕业证KU毕业证留信学历认证原版1:1复刻堪萨斯大学毕业证KU毕业证留信学历认证
原版1:1复刻堪萨斯大学毕业证KU毕业证留信学历认证jdkhjh
 
Bladex 1Q24 Earning Results Presentation
Bladex 1Q24 Earning Results PresentationBladex 1Q24 Earning Results Presentation
Bladex 1Q24 Earning Results PresentationBladex
 
2024 Q1 Crypto Industry Report | CoinGecko
2024 Q1 Crypto Industry Report | CoinGecko2024 Q1 Crypto Industry Report | CoinGecko
2024 Q1 Crypto Industry Report | CoinGeckoCoinGecko
 
Kempen ' UK DB Endgame Paper Apr 24 final3.pdf
Kempen ' UK DB Endgame Paper Apr 24 final3.pdfKempen ' UK DB Endgame Paper Apr 24 final3.pdf
Kempen ' UK DB Endgame Paper Apr 24 final3.pdfHenry Tapper
 
NO1 WorldWide Love marriage specialist baba ji Amil Baba Kala ilam powerful v...
NO1 WorldWide Love marriage specialist baba ji Amil Baba Kala ilam powerful v...NO1 WorldWide Love marriage specialist baba ji Amil Baba Kala ilam powerful v...
NO1 WorldWide Love marriage specialist baba ji Amil Baba Kala ilam powerful v...Amil baba
 
NO1 WorldWide Genuine vashikaran specialist Vashikaran baba near Lahore Vashi...
NO1 WorldWide Genuine vashikaran specialist Vashikaran baba near Lahore Vashi...NO1 WorldWide Genuine vashikaran specialist Vashikaran baba near Lahore Vashi...
NO1 WorldWide Genuine vashikaran specialist Vashikaran baba near Lahore Vashi...Amil baba
 
Role of Information and technology in banking and finance .pptx
Role of Information and technology in banking and finance .pptxRole of Information and technology in banking and finance .pptx
Role of Information and technology in banking and finance .pptxNarayaniTripathi2
 
Economic Risk Factor Update: April 2024 [SlideShare]
Economic Risk Factor Update: April 2024 [SlideShare]Economic Risk Factor Update: April 2024 [SlideShare]
Economic Risk Factor Update: April 2024 [SlideShare]Commonwealth
 
Market Morning Updates for 16th April 2024
Market Morning Updates for 16th April 2024Market Morning Updates for 16th April 2024
Market Morning Updates for 16th April 2024Devarsh Vakil
 
Stock Market Brief Deck for "this does not happen often".pdf
Stock Market Brief Deck for "this does not happen often".pdfStock Market Brief Deck for "this does not happen often".pdf
Stock Market Brief Deck for "this does not happen often".pdfMichael Silva
 
Managing Finances in a Small Business (yes).pdf
Managing Finances  in a Small Business (yes).pdfManaging Finances  in a Small Business (yes).pdf
Managing Finances in a Small Business (yes).pdfmar yame
 
SBP-Market-Operations and market managment
SBP-Market-Operations and market managmentSBP-Market-Operations and market managment
SBP-Market-Operations and market managmentfactical
 
Vp Girls near me Delhi Call Now or WhatsApp
Vp Girls near me Delhi Call Now or WhatsAppVp Girls near me Delhi Call Now or WhatsApp
Vp Girls near me Delhi Call Now or WhatsAppmiss dipika
 
Call Girls Near Me WhatsApp:+91-9833363713
Call Girls Near Me WhatsApp:+91-9833363713Call Girls Near Me WhatsApp:+91-9833363713
Call Girls Near Me WhatsApp:+91-9833363713Sonam Pathan
 
project management information system lecture notes
project management information system lecture notesproject management information system lecture notes
project management information system lecture notesongomchris
 
NO1 Certified Amil Baba In Lahore Kala Jadu In Lahore Best Amil In Lahore Ami...
NO1 Certified Amil Baba In Lahore Kala Jadu In Lahore Best Amil In Lahore Ami...NO1 Certified Amil Baba In Lahore Kala Jadu In Lahore Best Amil In Lahore Ami...
NO1 Certified Amil Baba In Lahore Kala Jadu In Lahore Best Amil In Lahore Ami...Amil baba
 

Kürzlich hochgeladen (20)

Amil Baba In Pakistan amil baba in Lahore amil baba in Islamabad amil baba in...
Amil Baba In Pakistan amil baba in Lahore amil baba in Islamabad amil baba in...Amil Baba In Pakistan amil baba in Lahore amil baba in Islamabad amil baba in...
Amil Baba In Pakistan amil baba in Lahore amil baba in Islamabad amil baba in...
 
AnyConv.com__FSS Advance Retail & Distribution - 15.06.17.ppt
AnyConv.com__FSS Advance Retail & Distribution - 15.06.17.pptAnyConv.com__FSS Advance Retail & Distribution - 15.06.17.ppt
AnyConv.com__FSS Advance Retail & Distribution - 15.06.17.ppt
 
Q1 2024 Newsletter | Financial Synergies Wealth Advisors
Q1 2024 Newsletter | Financial Synergies Wealth AdvisorsQ1 2024 Newsletter | Financial Synergies Wealth Advisors
Q1 2024 Newsletter | Financial Synergies Wealth Advisors
 
原版1:1复刻堪萨斯大学毕业证KU毕业证留信学历认证
原版1:1复刻堪萨斯大学毕业证KU毕业证留信学历认证原版1:1复刻堪萨斯大学毕业证KU毕业证留信学历认证
原版1:1复刻堪萨斯大学毕业证KU毕业证留信学历认证
 
Bladex 1Q24 Earning Results Presentation
Bladex 1Q24 Earning Results PresentationBladex 1Q24 Earning Results Presentation
Bladex 1Q24 Earning Results Presentation
 
2024 Q1 Crypto Industry Report | CoinGecko
2024 Q1 Crypto Industry Report | CoinGecko2024 Q1 Crypto Industry Report | CoinGecko
2024 Q1 Crypto Industry Report | CoinGecko
 
Kempen ' UK DB Endgame Paper Apr 24 final3.pdf
Kempen ' UK DB Endgame Paper Apr 24 final3.pdfKempen ' UK DB Endgame Paper Apr 24 final3.pdf
Kempen ' UK DB Endgame Paper Apr 24 final3.pdf
 
NO1 WorldWide Love marriage specialist baba ji Amil Baba Kala ilam powerful v...
NO1 WorldWide Love marriage specialist baba ji Amil Baba Kala ilam powerful v...NO1 WorldWide Love marriage specialist baba ji Amil Baba Kala ilam powerful v...
NO1 WorldWide Love marriage specialist baba ji Amil Baba Kala ilam powerful v...
 
NO1 WorldWide Genuine vashikaran specialist Vashikaran baba near Lahore Vashi...
NO1 WorldWide Genuine vashikaran specialist Vashikaran baba near Lahore Vashi...NO1 WorldWide Genuine vashikaran specialist Vashikaran baba near Lahore Vashi...
NO1 WorldWide Genuine vashikaran specialist Vashikaran baba near Lahore Vashi...
 
Role of Information and technology in banking and finance .pptx
Role of Information and technology in banking and finance .pptxRole of Information and technology in banking and finance .pptx
Role of Information and technology in banking and finance .pptx
 
Economic Risk Factor Update: April 2024 [SlideShare]
Economic Risk Factor Update: April 2024 [SlideShare]Economic Risk Factor Update: April 2024 [SlideShare]
Economic Risk Factor Update: April 2024 [SlideShare]
 
Market Morning Updates for 16th April 2024
Market Morning Updates for 16th April 2024Market Morning Updates for 16th April 2024
Market Morning Updates for 16th April 2024
 
Stock Market Brief Deck for "this does not happen often".pdf
Stock Market Brief Deck for "this does not happen often".pdfStock Market Brief Deck for "this does not happen often".pdf
Stock Market Brief Deck for "this does not happen often".pdf
 
Managing Finances in a Small Business (yes).pdf
Managing Finances  in a Small Business (yes).pdfManaging Finances  in a Small Business (yes).pdf
Managing Finances in a Small Business (yes).pdf
 
🔝+919953056974 🔝young Delhi Escort service Pusa Road
🔝+919953056974 🔝young Delhi Escort service Pusa Road🔝+919953056974 🔝young Delhi Escort service Pusa Road
🔝+919953056974 🔝young Delhi Escort service Pusa Road
 
SBP-Market-Operations and market managment
SBP-Market-Operations and market managmentSBP-Market-Operations and market managment
SBP-Market-Operations and market managment
 
Vp Girls near me Delhi Call Now or WhatsApp
Vp Girls near me Delhi Call Now or WhatsAppVp Girls near me Delhi Call Now or WhatsApp
Vp Girls near me Delhi Call Now or WhatsApp
 
Call Girls Near Me WhatsApp:+91-9833363713
Call Girls Near Me WhatsApp:+91-9833363713Call Girls Near Me WhatsApp:+91-9833363713
Call Girls Near Me WhatsApp:+91-9833363713
 
project management information system lecture notes
project management information system lecture notesproject management information system lecture notes
project management information system lecture notes
 
NO1 Certified Amil Baba In Lahore Kala Jadu In Lahore Best Amil In Lahore Ami...
NO1 Certified Amil Baba In Lahore Kala Jadu In Lahore Best Amil In Lahore Ami...NO1 Certified Amil Baba In Lahore Kala Jadu In Lahore Best Amil In Lahore Ami...
NO1 Certified Amil Baba In Lahore Kala Jadu In Lahore Best Amil In Lahore Ami...
 

virgin media.FINALVM_Q406_PressRelease

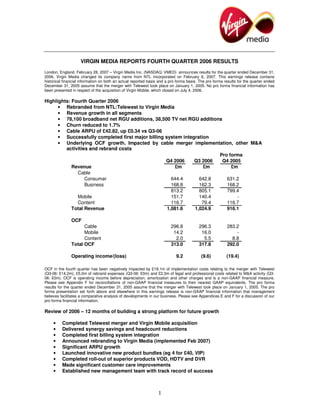
  • 1. VIRGIN MEDIA REPORTS FOURTH QUARTER 2006 RESULTS London, England, February 28, 2007 – Virgin Media Inc. (NASDAQ: VMED) announces results for the quarter ended December 31, 2006. Virgin Media changed its company name from NTL Incorporated on February 6, 2007. This earnings release contains historical financial information on both an actual reported basis and a pro forma basis. The pro forma results for the quarter ended December 31, 2005 assume that the merger with Telewest took place on January 1, 2005. No pro forma financial information has been presented in respect of the acquisition of Virgin Mobile, which closed on July 4, 2006. Highlights: Fourth Quarter 2006 • Rebranded from NTL:Telewest to Virgin Media • Revenue growth in all segments • 78,100 broadband net RGU additions, 38,500 TV net RGU additions • Churn reduced to 1.7% • Cable ARPU of £42.82, up £0.34 vs Q3-06 • Successfully completed first major billing system integration • Underlying OCF growth. Impacted by cable merger implementation, other M&A activities and rebrand costs Pro forma Q4 2006 Q3 2006 Q4 2005 Revenue £m £m £m Cable Consumer 644.4 642.8 631.2 Business 168.8 162.3 168.2 813.2 805.1 799.4 Mobile 151.7 140.4 - Content 116.7 79.4 116.7 Total Revenue 1,081.6 1,024.9 916.1 OCF Cable 296.8 296.3 283.2 Mobile 14.2 16.0 - Content 2.0 5.5 8.8 Total OCF 313.0 317.8 292.0 Operating income/(loss) 9.2 (9.6) (19.4) OCF in the fourth quarter has been negatively impacted by £19.1m of implementation costs relating to the merger with Telewest (Q3-06: £14.2m), £5.0m of rebrand expenses (Q3-06: £0m) and £2.3m of legal and professional costs related to M&A activity (Q3- 06: £0m). OCF is operating income before depreciation, amortization and other charges and is a non-GAAP financial measure. Please see Appendix F for reconciliations of non-GAAP financial measures to their nearest GAAP equivalents. The pro forma results for the quarter ended December 31, 2005 assume that the merger with Telewest took place on January 1, 2005. The pro forma presentation set forth above and elsewhere in this earnings release is non-GAAP financial information that management believes facilitates a comparative analysis of developments in our business. Please see Appendices E and F for a discussion of our pro forma financial information. Review of 2006 – 12 months of building a strong platform for future growth Completed Telewest merger and Virgin Mobile acquisition • Delivered synergy savings and headcount reductions • Completed first billing system integration • Announced rebranding to Virgin Media (implemented Feb 2007) • Significant ARPU growth • Launched innovative new product bundles (eg 4 for £40, VIP) • Completed roll-out of superior products VOD, HDTV and DVR • Made significant customer care improvements • Established new management team with track record of success • 1
  • 2. Steve Burch, Chief Executive Officer of Virgin Media, said: “Our first set of figures released under our new name show continued improvement, with revenue growth across all segments, good growth in ARPU and triple play penetration, reduced churn and strong broadband and TV net additions. Underlying OCF growth was strong before the impact of merger implementation, rebrand and M&A costs. Overall, the performance of the underlying business is on track and provides a strong foundation for the rebranding to Virgin Media. Consumer reaction to the rebrand, announced on February 8, has been very encouraging. Our rebrand and the ongoing improvements to our business that it reflects, signal a great opportunity for our customers and investors and poses a serious challenge to our competitors.” Contacts Investor Relations: Richard Williams: +44 (0) 20 7299 5479 / richard.williams@virginmedia.co.uk Vani Bassi: +44 (0) 20 7299 5353 / vani.bassi@virginmedia.co.uk Media: M: Communications Lisa Gordon: +44 (0) 20 7153 1540 Nick Fox: +44 (0) 20 7153 1548 2
  • 3. RESULTS FOR THE THREE MONTHS ENDED DECEMBER 31, 2006 OPERATIONAL REVIEW The commentary below refers to financial results prepared on both an actual reported and pro forma basis. The historical actual reported results consolidate Telewest from March 3, 2006, the date of the closing of the merger between NTL and Telewest and consolidate Virgin Mobile from July 4, 2006, the date of the closing of its acquisition. The pro forma results for the quarter ended December 31, 2005 assume that the merger with Telewest occurred on January 1, 2005. No pro forma financial information has been presented in respect of the acquisition of Virgin Mobile. The pro forma financial information is non-GAAP financial information that management believes facilitates a comparative analysis of developments in the Company’s business. Please see Appendices E and F for a discussion of our pro forma financial information. Unless otherwise indicated, all historical references to operational statistics including customer and subscriber figures, ARPU and churn are on a pro forma basis assuming the merger with Telewest occurred on January 1, 2005. Revenue Total revenue in the fourth quarter increased to £1,081.6 million (Q3 2006: £1,024.9m) due to revenue growth in all segments. Year on year revenue growth in the fourth quarter was £597.0 million (Q4 2005: £484.6m), due to the merger with Telewest and the acquisition of Virgin Mobile. Cable Segment Revenue Consumer Consumer revenue in the fourth quarter was £644.4 million (Q3 2006: £642.8m), reflecting primarily an increase in ARPU to £42.82 from £42.48. Consumer revenue increased by £13.2 million compared to the same pro forma period in the previous year, due to an increase in ARPU, reflecting our drive to encourage triple play bundling and a focus on better quality customers. Cable ARPU has grown in the quarter due mainly to an increase in RGU per customer from 2.14 to 2.17 and an increase in triple play penetration from 38.7% to 40.6%. We have focused on acquiring new bundled customers and on cross-selling to existing customers and also made some selected price rises. Gross customer additions in the fourth quarter were 213,500, down from 229,200 in the third quarter. As anticipated in our third quarter earnings announcement, this was due to the cessation of installation activity during a billing system migration and a lower level of installations in the last two weeks of December because of the holiday season. Churn in the fourth quarter was 1.7%, down from 1.8% in the third quarter. Gross disconnections were 250,500, down 16,000 compared to the previous quarter. As expected, churn continued to be impacted by policy and process changes undertaken to align old NTL areas with Telewest. Net customer losses were 37,000 in the quarter, essentially flat as compared to the previous quarter. Our current carriage agreement with BSkyB for carriage of its basic channels ends on February 28, 2007. As of the time of this release, we have not reached agreement with BSkyB to renew this agreement. We have offered them a binding arbitration process covering both the Sky basics and Virgin Media Television channel carriage contracts and are awaiting their response. Sky’s premium sports and movie channels are not impacted by the negotiation and will continue to be available to Virgin Media customers. Despite a dramatic and sustained decline in the Sky basic channels’ popularity in Virgin Media households (they have lost an average of 7% of their cable viewing every year over the past four years), Sky demanded a price that bears no relation to the channels’ popularity and is radically out of line with the way it values our own Virgin Media TV channels on its own network. If Sky withdraws its basic channels, we will no longer have to pay BSkyB significant wholesale charges for its channels. We will divert some of these savings into further content additions to our existing on- 3
  • 4. demand library. Although we expect that there may be a short term impact on customer churn and customer acquisition, we believe our differentiated VOD content, and the excellent value and flexibility of our product bundles will continue to attract and retain customers. The Consumer division and its TV, telephony and broadband business was rebranded to Virgin Media on February 8, 2007 backed by a significant advertising campaign. We believe that the unique flavor and customer focus of the Virgin brand, underpinned by the progress we have made in customer service and product innovation, will also give our growth fresh impetus. Broadband We continue to experience strong growth in the number of broadband subscribers with net additions of 78,100 in the quarter, continuing at the level experienced in the previous quarter. As an end-to-end network owner, cable has inbuilt advantages in the quality of broadband service that we offer. Customers can receive consistent speeds no matter where they live on our network and a top speed of 10Mb is available throughout our broadband addressable areas. We will be increasing this to 20Mb in June and we are also currently conducting a residential trial of a 50Mb broadband service. Our product superiority was recognized in February when we were named Best Consumer ISP at the Internet Services Providers’ Association Awards. The award recognized that we demonstrate outstanding value for money and customer care. Television Digital television net additions were 83,900, following net additions of 85,800 in the previous quarter. Total TV net additions, which includes analog television, were 38,500 in the quarter, up from 22,200 in the previous quarter. Growth has been strong due to the continued roll-out of new products alongside compelling marketing and product propositions. Video-on-demand (VOD) is now available to all of our digital subscribers. Unlike other providers, our range of content is extensive with many thousands of hours of content including over 500 movies, highlights from the previous week’s primetime schedule, over 2,000 hours of top TV series and over 1,000 music videos available every day. We have VOD content available from HBO, Buena Vista, Warner, BBC, Channel 4, Alliance Atlantis, Virgin Media TV and further major content additions are expected throughout the year, as we divert some of the savings from the Sky basics channels, strengthening our line up and adding even more choice for our subscribers. We have recently launched an innovative new service, Virgin Central, a revolutionary kind of television channel. Virgin Central heralds a new way to watch TV, combining the simplicity of a traditional channel with the choice and control of next generation TV-on-demand technology. The channel hosts a continuously refreshing showcase of blockbuster entertainment around the clock. By pressing one button and using a simple on-screen guide, viewers have instant access to different episodes of the show they select. They can then stop, rewind and pause - just like using a DVD player. Virgin Central includes free access to hit shows like The OC, Nip/Tuck, Little Britain, Criminal Minds, Grey’s Anatomy, Spooks and West Wing. Content will be updated regularly and, unlike a traditional TV channel, there will be no waiting for scheduled start times. The hybrid service marks a step change in the development of TV-on-demand - making access to a library of additional viewing more exciting and intuitive than using a static on-screen menu. The new channel complements our existing library of TV-on-demand entertainment. We have also completed the roll-out of our newly rebranded V+ box, which is a high definition (HDTV) compatible digital video recorder (DVR). We believe this is the best on the market with 80 hours recording time, three tuners and full VOD capability. We currently have 79,000 V+ subscribers. We have over 150 hours of HD content and will be expanding this range. 4
  • 5. Telephony Telephony net subscriber losses in the quarter were 64,300, partially as a result of competitive pressure. The installation shutdown and the holiday season slowdown, referred to above, also had a negative effect. There was also a small increase in disconnects as telephony continued to be impacted by policy and process changes undertaken to align old NTL areas with Telewest. In order to address these subscriber losses, we are refocusing the way we market and sell some of our bundles to try and ensure that telephony is always pushed at the point of sale. We have also continued our strategy of increasing the number of subscribers on flat rate packages to reduce the impact of declining fixed line telephony usage. Off-net Off-net revenues were largely from Virgin.net, our wholly owned broadband ISP which offers broadband and telephony services using BT Group’s wholesale products rather than our own cable network. Virgin.net also rebranded to Virgin Media on February 8, 2007. Consumer off-net revenue in the fourth quarter was down slightly at £17.2 million (Q3 2006: £17.6m), reflecting a reduction in telephony and dial-up customers, but good growth in broadband. By the year- end, we had 260,800 off-net broadband subscribers following a further 18,000 net additions in the quarter, up from 7,800 net additions in the previous quarter, and 38,300 off-net telephony subscribers. Customer growth has been strong on the back of new bundle packages and pricing. The current year will see an aggressive roll-out of our off-net strategy which is being developed to leverage the Virgin Media brand nationally by extending it into non-cable areas. We plan for off-net to represent a significant portion of our growth platform for our national Virgin Media business. We are close to securing a wholesale local loop unbundling provider, which will enable us to launch new quad-play product propositions outside of our cable network with only modest capital investment. In addition, ahead of that, we plan to launch a Virgin Media branded multi-channel Digital Terrestrial TV set top box that we will bundle with our off-net telephone, broadband and mobile products. We plan to enhance this proposition significantly in 2008, by offering an IPTV service, including pay broadcast channels and VOD to customers outside of our cable areas on unbundled exchanges. A key benefit from our off-net strategy will be our ability to offer a Virgin Media branded quad-play to the significant number of cable customers who churn because they are moving out of our addressable areas. Business Business revenue in the fourth quarter was £168.8 million, up £6.5 million compared to the third quarter primarily due to increased wholesale revenues from voice and fiber circuit kit sales, and an increase in retail data sales of £1.9 million. These wholesale increases were at a relatively low gross margin. The kit sales to a major wholesale mobile customer signify the completion of the build of a Wide Transmission Network (WTN) and are therefore not expected to recur significantly in 2007. Future wholesale revenues from that customer will be for operational and maintenance of the WTN and we expect that wholesale revenues will be approximately £10 million to £15 million lower in the first quarter of 2007. In the short term, we believe the UK market for voice and wholesale services remains challenging. However, we are well positioned for further growth in data revenues. We have a lower unit network cost than our competitors, a strong capable network and a substantial increase in scale from the Telewest merger, which should enable us to continue to deliver strong cashflow from our Business services. 5
  • 6. Cable Segment OCF Cable segment OCF in the quarter was £296.8 million, up £0.5 million compared to the previous quarter. This was due mainly to underlying growth and a £9 million increase in the realization of cost synergies being partially offset by £5.0 million of rebrand expenses, £2.3 million of legal and professional expenses relating to Merger and Acquisition activity and a £4.9 million increase in cable merger implementation costs. Implementation costs increased from the third quarter primarily due to the costs associated with the billing system migration we completed in December. Cable segment OCF was up £142.1 million as compared to the same quarter last year due mainly to the merger with Telewest. Mobile Segment Virgin Mobile was acquired on July 4, 2006 and we have consolidated its results of operations from that date. Total mobile revenue in the fourth quarter was £151.7 million (Q3 2006: £140.4m) comprising £141.8 million service revenue and £9.9 million equipment revenue. Revenue growth was primarily due to increased mobile monthly ARPU and a full quarter’s revenue following the acquisition. ARPU rose to £10.59 in the fourth quarter (Q3 2006: £10.28) due to an increase in the number of high ARPU contract customers and higher usage. Net customer additions in the quarter were 11,100, compared to 122,700 in the previous quarter. Customer growth was lower than expected due to increased price competition and higher advertising spend from our mobile competitors. We continued to grow the number of higher ARPU and more valuable contract customers, as well as overall revenue. We anticipate that net customer additions in the first quarter of 2007 will be significantly negative, reflecting normal seasonal weakness, which generally follows the holiday sales period. We continue to expect good subscriber growth for the full year 2007. Our focus will revolve around the reinvigoration of our “value” marketing messaging, continuing to focus on our growing contract business, cross-selling to our cable customer base, exploiting and benefiting from the marketing investment of the Virgin Media rebrand and further retail store openings. These stores will also sell the full range of Virgin Media products. Mobile OCF was £14.2 million in the quarter, down from £16.0 million in the previous quarter due mainly to seasonally increased marketing and subscriber acquisition costs. Content Segment The Content segment consists of Virgin Media Television and Sit-up. Virgin Media Television was rebranded from Flextech on February 8, 2007. Total content segment revenue, after inter segment elimination of £5.8 million, was £116.7 million in the fourth quarter (Q3 2006: £79.4m), comprising £34.7 million from Virgin Media Television and £82.0 million from Sit-up. This increase was largely due to seasonal growth at Sit-up and advertising growth at Virgin Media Television. Virgin Media Television sells programming to the Virgin Media cable business. For consolidation purposes therefore, these amounts have been eliminated. Virgin Media Television revenue, after inter segment elimination, was £34.7 million in the quarter, up £2.8 million from the previous quarter. This was due mainly to an increase in advertising revenue from £19.1 million to £20.8 million reflecting an increase in commercial impacts and growth in Virgin Media Television’s market share of TV advertising. Virgin Media Television revenue, after inter segment 6
  • 7. elimination, was up £2.1 million compared to the pro forma fourth quarter of 2005 due mainly to an increase in advertising revenue. Virgin Media Television has recently signed a new two-year carriage contract with British Sky Broadcasting for the carriage of its channels, which runs from January 1, 2007. As a result, subscription revenue is expected to be approximately £30 million lower in 2007 than in 2006. We believe that BSkyB has deliberately undervalued these channels purely because they are owned by its principal pay-TV competitor. The effect on overall group revenue is fairly immaterial as fourth quarter subscription revenue represented just 0.8% of group revenue. An “off screen” or non-programming cost reduction plan is in place to address some of this shortfall, but nevertheless 2007 Content OCF is expected to be significantly affected. Despite the reduction in subscription revenue, we intend to continue to increase investment in “on screen” programming costs in order to continue to further strengthen our channels, grow commercial impacts and secure increased advertising revenue in future years. Strong growth in Sit-up revenue in the fourth quarter, up £34.5 million to £82.0 million (Q3 2006: £47.5m) reflects the seasonal impact. Consequently, it is expected that, consistent with our experience in 2006, first quarter revenue will reflect a material decline of approximately £30 million following the end of the holiday season. Content segment OCF in the quarter contributed £2.0 million, down £3.5 million from the prior quarter due to improved performance at Sit-up being offset by the seasonal increase in programming expense. Compared to the same pro forma period last year, Content segment OCF was down £6.8 million due mainly to lower margins at Sit-up. Operating Income before Depreciation, Amortization and Other Charges (OCF) OCF was up £158.3 million compared to the fourth quarter of 2005, due to the merger with Telewest and the acquisition of Virgin Mobile. OCF of £313.0 million in the fourth quarter (Q3 2006: £317.8m) reflects a number of items relating to the merger and other corporate expenses. Approximately £29 million of estimated synergy cost savings were realized from the merger, an increase of £9 million compared to the previous quarter. This was offset by £5.0 million of rebrand expenses, £2.3 million of legal and professional expenses relating to Merger and Acquisition activity, a £4.9 million increase to £19.1 million of cable merger implementation costs, and seasonal reductions in Mobile and Content OCF as discussed above. We continue to expect to achieve a run rate of approximately £250 million of estimated synergy savings by the end of 2007, consisting of £200 million of operational expenditure savings and £50 million of capital expenditure savings. In January, we began the extensive marketing campaign behind our new Virgin Media brand. We expect this to increase our normal marketing and communication costs by over £25 million in 2007, with approximately £16 million to be incurred in the first quarter. We expect OCF in the first quarter to be negatively impacted by lower Business wholesale revenues and increased brand marketing spend as discussed above. OCF is a non-GAAP financial measure. See Appendix F for reconciliations of non-GAAP financial measures to their nearest GAAP equivalents. 7
  • 8. Operating Income/Loss and Loss From Continuing Operations Operating income in the fourth quarter was £9.2 million (Q3 2006: £9.6 million loss) and compares with an operating loss of £34.4 million in the fourth quarter of 2005 due to the merger with Telewest and the acquisition of Virgin Mobile. Loss from continuing operations was £88.1 million (Q3 2006: £104.2m). This loss was £31.9 million higher than in the fourth quarter of 2005 due mainly to the merger with Telewest and the acquisition of Virgin Mobile. Capital Expenditure Fixed asset additions (accrual basis) in the quarter were £178.6 million (Q3 2006: £147.3m). This benefited from approximately £9 million of estimated synergy cost savings resulting from the merger. This was more than offset, however, by the fixed asset merger integration expense incurred in the quarter of £32.0 million mainly relating to the first major billing system integration. Compared to the fourth quarter of 2005, fixed asset additions (accrual basis) were up £84.0 million due mainly to the merger with Telewest. The total purchase of fixed assets was £147.8 million in the quarter, compared to £133.6 million in the previous quarter and £71.8 million in the same quarter last year. Fixed asset additions (accrual basis) is a non-GAAP financial measure. See Appendix F for reconciliations of non-GAAP financial measures to their nearest GAAP equivalents. Net Debt As of December 31, 2006, net debt was £5,741 million. This consisted of £5,025 million outstanding under the Senior Credit Facility, £1,024 million of Senior Notes, and £110 million of capital leases and other, offset by £418 million of cash and cash equivalents. Total liabilities as of December 31, 2006 were £8,013 million. Cash interest paid (exclusive of amounts capitalized) was £59 million in the quarter and £327 million for the full year. Net debt is a non-GAAP financial measure. See Appendix F for reconciliations of non-GAAP financial measures to their nearest GAAP equivalents. 8
  • 9. “Safe Harbor” Statement under the Private Securities Litigation Reform Act of 1995: Various statements contained in this document constitute “forward looking statements” as that term is defined under the Private Securities Litigation Reform Act of 1995. Words like “believe,” “anticipate,” “should,” “intend,” “plan,” “will,” “expects,” “estimates,” “projects,” “positioned,” “strategy,” and similar expressions identify these forward looking statements, which involve known and unknown risks, uncertainties and other factors that may cause our actual results, performance or achievements or industry results to be materially different from those contemplated, projected, forecasted, estimated or budgeted, whether expressed or implied, by these forward looking statements. These factors include: (1) the ability to compete with a range of other communications and content providers; (2) the ability to control customer churn; (3) the effect of technological changes on our businesses; (4) the ability to use the Virgin name and logo; (5) the ability to maintain and upgrade our networks in a cost-effective and timely manner; (6) possible losses in revenues due to systems failures; (7) the ability to provide attractive programming at a reasonable cost; (8) the reliance on single-source suppliers for some equipment, software and services and third party distributors of our mobile services; (9) the functionality or market acceptance of new products that we may introduce; (10) the failure to obtain and retain expected synergies from the merger of our legacy NTL and Telewest businesses and the acquisition of Virgin Mobile; (11) the rate of success in executing, managing and integrating key acquisitions, including the merger with Telewest and the acquisition of Virgin Mobile; (12) the ability to achieve business plans for the combined company; (13) the ability to fund debt service obligations through operating cash flow; (14) the ability to obtain additional financing in the future and react to competitive and technological changes; (15) the ability to comply with restrictive covenants in our indebtedness agreements; and (16) the extent to which our future earnings will be sufficient to cover our fixed charges. These and other factors are discussed in more detail under “Risk Factors” and elsewhere in Virgin Media’s Form 10-K filed with the SEC on February 28, 2006, Virgin Media Holdings Inc.’s Form 10-K filed with the SEC on March 1, 2006 and Virgin Media’s Forms 10-Q filed with the SEC on May 10, 2006, August 9, 2006 and November 9, 2006. We assume no obligation to update our forward looking statements to reflect actual results, changes in assumptions or changes in factors affecting these statements. 9
  • 10. Change of Company Name On February 6, 2007, NTL Incorporated changed its name to Virgin Media Inc. NTL-Telewest Merger On March 3, 2006, NTL Holdings Inc. (formerly known as NTL Incorporated and now known as Virgin Media Holdings Inc.), merged with a subsidiary of NTL Incorporated formerly known as Telewest Global, Inc. and now known as Virgin Media Inc. Because this transaction was accounted for as a reverse acquisition, the actual reported financial information included in this release is of the corporation now known as Virgin Media Holdings Inc. for the period through March 3, 2006 and thereafter it reflects the reverse acquisition of Telewest Global, Inc. The pro forma financial information treats the merger as if it occurred at the beginning of the relevant year. Virgin Mobile Acquisition On July 4, 2006, we completed the acquisition of Virgin Mobile Holdings (UK) plc, or Virgin Mobile. Virgin Mobile is the largest mobile virtual network operator in the United Kingdom, with approximately 4.5 million customers. We have entered into a long-term trademark license agreement with Virgin Enterprises Limited pursuant to which we have re-branded our existing consumer and part of our content businesses with the Virgin brand. Non-GAAP Financial Measures We use non-GAAP financial measures with a view to providing investors with a better understanding of the operating results and underlying trends to measure past and future performance and liquidity. We evaluate operating performance based on several non-GAAP financial measures, including (i) operating income before depreciation, amortization and other charges (OCF), (ii) fixed asset additions (accrual basis) and (iii) net debt, as we believe these are important measures of the operational strength of our business. Since these measures are not calculated in accordance with GAAP, they should not be considered as substitutes for operating income (loss), purchase of fixed assets and total liabilities, respectively, or as indicators of our operating performance, expenditure for fixed assets and total liabilities. Please see Appendix F for a discussion of our use of non-GAAP financial measures and reconciliations to their nearest GAAP equivalents. Pro Forma Financial Information The pro forma presentation of our financial results contained herein is non-GAAP financial information. We have included the pro forma information to provide a useful basis for evaluating developments in our business over time, but it should not be viewed as a substitute for our GAAP financial information. Please see Appendix E. 10
  • 11. Appendices: A) Financial Statements Condensed Consolidated Statement of Operations Condensed Consolidated Balance Sheet Condensed Consolidated Statement of Cashflows Quarterly Condensed Consolidated Statement of Operations B) Group Residential Operations Statistics C) Segmental Analysis D) Fixed Asset Additions (Accrual basis) E) Pro Forma Combined Condensed Financial Information F) Use of Non-GAAP Financial Measures and Reconciliations to GAAP 11
  • 12. Appendices A) Financial Statements CONDENSED CONSOLIDATED STATEMENT OF OPERATIONS (in £ millions, except per share data) Three months ended Year ended December 31, December 31, 2006 2005 2006 2005 Revenue 1,081.6 484.6 3,602.2 1,947.6 Costs and expenses Operating costs (exclusive of depreciation shown separately below) 510.4 205.2 1,572.8 808.3 Selling, general and administrative expenses 258.2 124.7 906.9 483.0 Other charges 15.6 22.4 67.0 24.8 Depreciation 207.9 139.5 799.1 541.7 Amortization 80.3 27.2 246.6 109.5 Total costs and expenses 1,072.4 519.0 3,592.4 1,967.3 Operating income (loss) 9.2 (34.4) 9.8 (19.7) Other income(expense) Interest income and other, net 10.4 7.8 34.7 29.4 Interest expense (124.8) (55.6) (457.4) (235.8) Share of income from equity investments 4.1 - 12.5 - Foreign currency transaction gains (losses) 7.7 35.2 (90.1) 5.3 Gain (loss) on extinguishment of debt 0.1 - (32.8) (2.0) Gains on derivative instruments 3.2 0.9 1.3 0.9 Loss from continuing operations before income taxes, minority interest and cumulative effect of changes in accounting principle (90.1) (46.1) (522.0) (221.9) Income tax benefit (expense) 1.0 (10.1) 11.8 (18.8) Minority interest 1.0 - 1.0 (1.0) Loss from continuing operations (88.1) (56.2) (509.2) (241.7) Discontinued operations Income from discontinued operations before income taxes - 0.2 - 5.7 Gain on disposal of assets (0.2) - 7.9 657.2 Income tax expense - (0.2) - (0.2) Income from discontinued operations (0.2) 0.0 7.9 662.7 Cumulative effect of changes in accounting principle (33.8) - (32.6) - Net (loss)income (122.1) (56.2) (533.9) 421.0 Basic and diluted loss from continuing operations per share (£0.27) (£0.26) (£1.74) (£1.13) Basic and diluted income from discontinued operations per share £0.00 £0.00 £0.03 £3.10 Basic and diluted loss from cumulative effect of changes in accounting principle per share (£0.10) - (£0.11) - Basic and diluted net (loss)income per share (£0.37) (£0.26) (£1.82) £1.97 Dividends per share £0.01 - £0.03 - Average number of shares outstanding (in millions) 323.8 212.8 292.9 213.8 12
  • 13. CONDENSED CONSOLIDATED BALANCE SHEET (in £ millions) December 31, September 30, December 31, 2006 2006 2005 Assets Current assets Cash and cash equivalents 418.5 302.2 735.2 Restricted cash 6.0 6.7 3.4 Marketable securities - - 96.9 Accounts receivable - trade, less allowance for doubtful accounts of £51.8 (Dec. 31, 2006) £58.9 (Sep. 30, 2006) and £41.7 (Dec. 31, 2005) 461.2 409.7 191.8 Inventory 65.3 67.6 - Prepaid expenses and other current assets 87.4 94.7 112.4 Total current assets 1,038.4 880.9 1,139.7 Fixed assets, net 6,026.3 6,088.6 3,294.9 Goodwill and other indefinite-lived intangible assets 2,516.5 2,484.0 193.0 Intangible assets, net 1,120.5 1,178.0 250.0 Equity investments 371.5 387.5 - Other assets, net of accumulated amortization of £21.8 (Dec. 31, 2006) £15.7 (Sep. 30, 2006) and £32.2 (Dec. 31, 2005) 170.3 173.9 110.9 Total assets 11,243.5 11,192.9 4,988.5 Liabilities and shareholders' equity Current liabilities Accounts payable 379.6 369.8 176.9 Accrued expenses and other current liabilities 485.5 433.7 202.3 VAT and employee taxes payable 82.8 77.7 43.5 Restructuring liabilities 126.8 126.4 45.3 Interest payable 158.2 94.4 37.8 Deferred revenue 268.0 263.2 103.2 Current portion of long term debt 141.9 151.5 0.8 Total current liabilities 1,642.8 1,516.7 609.8 Long term debt, net of current portion 6,017.2 6,055.5 2,279.2 Deferred revenue and other long term liabilities 276.2 194.1 134.3 Defered income taxes 77.2 77.0 9.2 Total liabilities 8,013.4 7,843.3 3,032.5 Commitments and contingent liabilities Minority interest - 1.0 1.0 Shareholders' equity Common stock 1.8 1.8 1.2 Additional paid-in capital 4,303.4 4,285.8 2,671.0 Treasury stock - - (114.0) Accumulated other comprehensive income 116.0 126.6 45.5 Accumulated deficit (1,191.1) (1,065.6) (648.7) Total shareholders' equity 3,230.1 3,348.6 1,955.0 Total liabilities and shareholders' equity 11,243.5 11,192.9 4,988.5 13
  • 14. CONDENSED CONSOLIDATED STATEMENT OF CASHFLOWS (in £ millions) Year ended December 31, 2006 2005 Net cash provided by operating activities 786.1 325.6 Investing activities Purchase of fixed assets (544.8) (288.1) Purchase of intangible assets (10.0) - Income from equity investments 15.7 0.7 Acquisitions, net of cash acquired (2,423.1) - Proceeds from the sale of fixed assets 2.4 2.6 Decrease in restricted cash 5.8 12.4 Proceeds from sale of Broadcast operations, net - 1,229.0 Proceeds from sale of Ireland operations, net - 216.2 Net cash (used in) provided by investing activites (2,954.0) 1,172.8 Financing activities Proceeds from employee stock option exercises 38.7 5.0 Purchase of stock - (114.0) New borrowings, net of financing fees 8,935.6 - Principal payments on long-term debt (7,053.4) (782.0) Capital lease payments (47.2) (4.6) Dividends paid (8.5) - Net cash provided by (used in) financing activities 1,865.2 (895.6) Cash flow from discontinued operations Net cash used in operating activities - (14.3) Net cash used in investing activities - (4.1) Net cash used in discontinued operations - (18.4) Effect of exchange rate changes on cash and cash equivalents (14.0) 25.6 (Decrease) increase in cash and cash equivalents (316.7) 610.0 Cash and cash equivalents, at beginning of year 735.2 125.2 Cash and cash equivalents, at end of year 418.5 735.2 Supplemental disclosure of cash flow information Cash paid during the year for interest exclusive of amounts capitalized 327.1 216.8 Income taxes paid 7.7 2.2 14
  • 15. QUARTERLY CONDENSED CONSOLIDATED STATEMENT OF OPERATIONS (in £ millions, except share and per share data) (unaudited) Three months ended Dec 31, Sep 30, Jun 30, Mar 31, Dec 31, 2006 2006 2006 2006 2005 Revenue 1,081.6 1,024.9 884.3 611.4 484.6 Costs and expenses Operating costs (exclusive of depreciation shown separately below) 510.4 440.0 367.5 254.9 205.2 Selling, general and administrative expenses 258.2 267.1 223.5 158.1 124.7 Other charges 15.6 30.9 12.1 8.4 22.4 Depreciation 207.9 222.6 219.3 149.3 139.5 Amortization 80.3 73.9 55.6 36.8 27.2 Total costs and expenses 1,072.4 1,034.5 878.0 607.5 519.0 Operating income (loss) 9.2 (9.6) 6.3 3.9 (34.4) Other income (expense) Interest income and other, net 10.4 7.1 8.6 8.6 7.8 Interest expense (124.8) (113.2) (135.6) (83.8) (55.6) Share of income from equity investments 4.1 3.9 3.1 1.4 0.9 Foreign currency transaction gains(losses) 7.7 6.3 (94.1) (10.0) 35.2 Gain(loss) on extinguishment of debt 0.1 (0.5) - (32.4) - Gains(losses) on derivative instruments 3.2 1.6 5.7 (9.2) - Loss from continuing operations before income taxes, minority interest and cumulative effect of changes in accounting principle (90.1) (104.4) (206.0) (121.5) (46.1) Income tax benefit(expense) 1.0 0.9 9.9 - (10.1) Minority interest 1.0 (0.7) 0.3 0.4 - Loss from continuing operations (88.1) (104.2) (195.8) (121.1) (56.2) Discontinued operations Income from discontinued operations before income taxes - - - - 0.2 Gain on disposal of assets (0.2) 8.1 - - (0.2) Income tax expense - - - - - Income from discontinued operations (0.2) 8.1 0.0 0.0 0.0 Cumulative effect of changes in accounting principle (33.8) - - 1.2 - Net (loss)income (122.1) (96.1) (195.8) (119.9) (56.2) Basic and diluted loss from continuing operations per share (£0.27) (£0.32) (£0.68) (£0.49) (£0.26) Basic and diluted income from discontinued operations per share £0.00 £0.02 £0.00 £0.00 £0.00 Basic and diluted loss from cumulative effect of changes in accounting principle per share (£0.10) - - £0.00 - Basic and diluted net loss per share (£0.37) (£0.30) (£0.68) (£0.49) (£0.26) 323.8 322.0 287.9 245.5 212.8 Average number of shares outstanding (in millions) 15
  • 16. B) GROUP RESIDENTIAL OPERATIONS STATISTICS (data in 000’s) Group (1) Q4-06 Q3-06 Q2-06 Q1-06 Q4-05 Group RGUs Opening RGUs 15,271.4 15,100.0 15,015.3 14,805.6 14,432.3 Data Cleanse (2) (69.0) (43.1) - - - Adjusted Opening RGUs 15,271.4 15,100.0 14,946.3 14,805.6 14,389.2 Net RGU adds 76.9 171.4 153.7 209.7 428.7 Reduction to customer count (3) (12.3) - - - - Closing Group RGUs 15,348.3 15,271.4 15,100.0 15,015.3 14,805.6 Group RGUs On-net Telephone 4,114.0 4,178.3 4,233.0 4,268.1 4,260.0 On-net TV 3,353.9 3,315.4 3,293.1 3,315.9 3,310.3 On-net Broadband 3,058.5 2,980.4 2,902.3 2,821.7 2,630.3 Total On-net 10,526.4 10,474.1 10,428.4 10,405.7 10,200.6 Off-net Telephone 38.3 42.8 47.6 53.2 60.3 Off-net Broadband 260.8 242.8 235.0 224.8 198.7 Total Off-net 299.1 285.6 282.6 278.0 259.0 Mobile 4,522.8 4,511.7 4,389.0 4,331.6 4,346.0 Total RGUs 15,348.3 15,271.4 15,100.0 15,015.3 14,805.6 Net RGU adds On-net Telephone (64.3) (54.6) (21.6) 8.1 0.8 On-net TV 38.5 22.2 8.3 5.6 23.3 On-net Broadband 78.1 78.1 104.9 191.4 191.7 Total On-net 52.3 45.7 91.7 205.1 215.8 Off-net Telephone (4.5) (4.8) (5.6) (7.1) (4.1) Off-net Broadband 18.0 7.8 10.2 26.1 24.4 Total Off-net 13.5 3.0 4.6 19.0 20.3 Mobile 11.1 122.7 57.4 (14.4) 192.6 Total Net RGU adds 76.9 171.4 153.7 209.7 428.7 Notes (1) Subscriber information is on a pro forma combined basis assuming that the merger with Telewest and the acquisition of Virgin Mobile had occurred on January 1, 2005. (2) Data cleanse activity in Q2-06 resulted in a decrease of 69,000 RGUs, a decrease of approximately 13,500 Telephone, 24,400 Broadband and 31,100 TV RGUs. Data cleanse activity in Q2-06 is a result of more closely aligning customer definitions between old NTL and old Telewest together with the removal of approximately 20,000 inactive backlog customers in old NTL. Data cleanse activity in Q4-05 resulted in a decrease in old NTL of 43,100 RGUs, a decrease of approximately 17,700 Telephone, 26,600 Broadband and an increase of 1,300 net TV RGUs. Review of inactive backlog customers in Q4-05 resulted in an adjustment to remove an additional 10,000 customers, representing (3) approximatley 12,300 RGUs. 16
  • 17. RESIDENTIAL CABLE OPERATIONS STATISTICS (excluding Off-net and Mobile) (data in 000’s except percentages, RGU/Customer and ARPU) Pro forma Virgin Media (1) Q4-06 Q3-06 Q2-06 Q1-06 Q4-05 Customers Opening Customers 4,891.5 4,928.7 4,983.8 4,958.0 4,945.4 Data Cleanse (2) - - (36.2) - (18.1) Adjusted Opening Customers 4,891.5 4,928.7 4,947.6 4,958.0 4,927.3 Gross customer adds 213.5 229.2 192.3 218.1 248.9 Total Customer disconnections (250.5) (266.5) (211.2) (192.3) (208.2) Net customer adds (37.0) (37.3) (18.9) 25.8 40.7 Reduction to customer count (3) - - - - (10.0) Closing Customers 4,854.5 4,891.5 4,928.7 4,983.8 4,958.0 Monthly customer churn % 1.7% 1.8% 1.5% 1.3% 1.4% Cable RGUs Opening RGUs 10,474.1 10,428.4 10,405.7 10,200.6 10,040.2 Data Cleanse (2) - - (69.0) - (43.1) Adjusted Opening RGUs 10,474.1 10,428.4 10,336.7 10,200.6 9,997.1 Net RGU adds 52.3 45.7 91.7 205.1 215.8 Reduction to RGU count (3) - - - - (12.3) Closing RGUs 10,526.4 10,474.1 10,428.4 10,405.7 10,200.6 Net RGU Adds Telephone (64.3) (54.6) (21.6) 8.1 0.8 Television 38.5 22.2 8.3 5.6 23.3 DTV 83.9 85.8 73.8 70.6 85.5 Broadband 78.1 78.1 104.9 191.4 191.7 Total Net RGU Adds 52.3 45.7 91.7 205.1 215.8 Revenue Generating Units (RGUs) Telephone 4,114.0 4,178.3 4,233.0 4,268.1 4,260.0 Television 3,353.9 3,315.4 3,293.1 3,315.9 3,310.3 DTV 3,005.9 2,922.0 2,836.2 2,786.5 2,715.9 Broadband 3,058.5 2,980.4 2,902.3 2,821.7 2,630.3 Total RGUs 10,526.4 10,474.1 10,428.4 10,405.7 10,200.6 RGU / Customer 2.17 2.14 2.12 2.09 2.06 Internet Customers Dial-up and DTV access 73.3 97.0 113.3 140.4 181.6 Broadband 3,058.5 2,980.4 2,902.3 2,821.7 2,630.3 Total Internet 3,131.9 3,077.4 3,015.6 2,962.1 2,811.9 Bundled Customers Dual RGU 1,725.7 1,798.3 1,838.9 1,939.1 2,033.2 Triple RGU 1,972.8 1,892.1 1,830.4 1,741.4 1,604.6 Percentage of dual or triple RGUs 76.2% 75.4% 74.4% 73.8% 73.4% Percentage of triple RGUs 40.6% 38.7% 37.1% 34.9% 32.4% Cable ARPU £42.82 £42.48 £42.21 £41.50 £41.27 ARPU calculation: On-net revenues £626,700 £625,400 £628,400 £618,600 £613,400 Average customers 4,878.8 4,907.4 4,962.3 4,969.2 4,954.1 Homes Marketable On-net Telephone 12,431.4 12,427.1 12,312.7 12,311.2 12,299.7 ATV 12,509.7 12,505.5 12,661.1 12,656.7 12,652.8 DTV 11,986.3 11,982.2 12,009.7 11,989.2 11,972.3 Broadband 11,819.6 11,815.4 11,766.2 11,745.7 11,613.6 Total homes 12,509.7 12,505.5 12,661.1 12,656.7 12,652.8 Penetration of Homes Marketable On-net Telephone 33.1% 33.6% 34.4% 34.7% 34.6% Television - Total 26.8% 26.5% 26.0% 26.2% 26.2% Television - DTV 25.1% 24.4% 23.6% 23.2% 22.7% Broadband 25.9% 25.2% 24.7% 24.0% 22.6% Total Customer 38.8% 39.1% 38.9% 39.4% 39.2% Notes (1) Subscriber information is on a pro forma combined basis assuming that the old Telewest and old NTL merger had occurred on January 1, 2005 and reflects old Telewest and old NTL reported on-net with prior periods restated for policy alignments, where applicable. (2) Data cleanse activity in Q2-06 resulted in a decrease of 36,200 customers and 69,000 RGUs, a decrease of approximately 13,500 Telephone, 24,400 Broadband and 31,100 TV RGUs. Data cleanse activity in Q2-06 is a result of more closely aligning customer definitions between old NTL and old Telewest together with the removal of approximately 20,000 inactive backlog customers in old NTL. Data cleanse activity in Q4-05 resulted in a decrease in old NTL of 18,100 customers and 43,100 RGUs, a decrease of approximately 17,700 Telephone, 26,600 Broadband and an increase of 1,300 net TV RGUs. (3) Review of inactive backlog customers in Q4-05 resulted in an adjustment to remove an additional 10,000 customers, representing approximatley 12,300 RGUs. (4) A table showing old NTL operational statistics for Q1-06 on an actual basis reflecting the merger with old Telewest on March 3, 2006 can be found in our Form 10Q for Q1-06, filed with the SEC on May 10, 2006. 17
  • 18. RESIDENTIAL CABLE OPERATIONS STATISTICS (excluding Off-net and Mobile) (data in 000’s except percentages, RGU/Customer and ARPU) Old Telewest (1&4) Old NTL on-net (1) Q4-06 Q3-06 Q2-06 Q1-06 Q4-05 Q4-06 Q3-06 Q2-06 Q1-06 Q4 05 Customers Opening Customers 1,894.4 1,886.8 1,886.8 1,868.2 1,848.1 2,997.1 3,042.0 3,097.0 3,089.8 3,097.3 Data Cleanse (2) (3.7) (32.5) (18.1) - - - - - - - Adjusted Opening Customers 1,894.4 1,886.8 1,883.1 1,868.2 1,848.1 2,997.1 3,042.0 3,064.5 3,089.8 3,079.2 Gross customer adds 84.8 87.9 73.2 79.2 86.1 128.7 141.3 119.2 138.9 162.8 Total Customer disconnections (72.4) (80.3) (69.5) (60.6) (66.0) (178.1) (186.2) (141.7) (131.7) (142.2) Net customer adds 12.4 7.6 3.7 18.6 20.1 (49.4) (44.9) (22.5) 7.2 20.6 Reduction to customer count (3) (10.0) - - - - - - - - - Closing Customers 1,906.8 1,894.4 1,886.8 1,886.8 1,868.2 2,947.7 2,997.1 3,042.0 3,097.0 3,089.8 Monthly customer churn % 1.3% 1.4% 1.2% 1.1% 1.2% 2.0% 2.1% 1.6% 1.5% 1.6% Cable RGUs Opening RGUs 4,273.3 4,212.9 4,164.9 4,059.6 3,955.2 6,200.8 6,215.5 6,240.8 6,141.0 6,085.0 Data Cleanse (2) (4.6) (64.4) (43.1) - - - - - - - Adjusted Opening RGUs 4,273.3 4,212.9 4,160.3 4,059.6 3,955.2 6,200.8 6,215.5 6,176.4 6,141.0 6,041.9 Net RGU adds 80.5 60.4 52.6 105.3 104.4 (28.2) (14.7) 39.1 99.8 111.4 Reduction to RGU count (3) (12.3) - - - - - - - - - Closing RGUs 4,353.8 4,273.3 4,212.9 4,164.9 4,059.6 6,172.6 6,200.8 6,215.5 6,240.8 6,141.0 Net RGU Adds Telephone (2.6) (5.1) 1.2 11.5 0.5 (61.7) (49.5) (22.8) (3.4) 0.3 Television 27.8 17.1 1.2 3.3 19.0 10.7 5.2 7.1 2.3 4.3 DTV 36.0 26.3 15.2 21.4 42.6 47.9 59.5 58.6 49.2 42.9 Broadband 55.3 48.5 50.1 90.5 84.9 22.8 29.6 54.8 100.9 106.8 Total Net RGU Adds 80.5 60.4 52.5 105.3 104.4 (28.2) (14.7) 39.1 99.8 111.4 Revenue Generating Units (RGUs) Telephone 1,691.2 1,693.8 1,698.9 1,698.4 1,686.9 2,422.8 2,484.5 2,534.0 2,569.7 2,573.1 Television 1,415.0 1,387.2 1,370.2 1,370.9 1,367.6 1,938.9 1,928.1 1,922.9 1,945.0 1,942.7 DTV 1,368.1 1,332.1 1,305.8 1,292.2 1,270.8 1,637.8 1,589.9 1,530.4 1,494.3 1,445.1 Broadband 1,247.6 1,192.3 1,143.8 1,095.6 1,005.1 1,810.9 1,788.1 1,758.5 1,726.1 1,625.2 Total RGUs 4,353.8 4,273.3 4,212.9 4,164.9 4,059.6 6,172.6 6,200.8 6,215.5 6,240.8 6,141.0 RGU / Customer 2.28 2.26 2.23 2.21 2.17 2.09 2.07 2.04 2.02 1.99 Internet Customers Dial-up and DTV access 22.6 29.1 32.3 44.3 57.9 50.7 67.9 81.0 96.1 123.7 Broadband 1,247.6 1,192.3 1,143.8 1,095.6 1,005.1 1,810.9 1,788.1 1,758.5 1,726.1 1,625.2 Total Internet 1,270.2 1,221.4 1,176.1 1,139.9 1,063.0 1,861.7 1,856.0 1,839.5 1,822.2 1,748.9 Bundled Customers Dual RGU 674.1 695.2 721.8 756.9 794.0 1,051.6 1,103.1 1,117.2 1,182.2 1,239.2 Triple RGU 886.4 841.9 802.2 760.6 698.6 1,086.4 1,050.2 1,028.2 980.8 906.0 Percentage of dual or triple RGUs 81.8% 81.1% 80.8% 80.4% 79.9% 72.5% 71.8% 70.5% 69.8% 69.4% Percentage of triple RGUs 46.5% 44.4% 42.5% 40.3% 37.4% 36.9% 35.0% 33.8% 31.7% 29.3% Cable ARPU £46.55 £45.61 £45.46 £45.15 £45.13 £40.43 £40.52 £40.21 £39.28 £38.96 ARPU calculation: On-net revenues £265,700 £258,300 £257,600 £254,300 £251,900 £361,000 £367,100 £370,800 £364,300 £361,500 Average customers 1,902.4 1,887.9 1,888.6 1,877.4 1,860.6 2,976.4 3,019.5 3,073.7 3,091.8 3,093.5 Homes Marketable On-net Telephone 4,706.8 4,702.5 4,700.2 4,701.2 4,698.4 7,724.6 7,724.6 7,612.5 7,610.0 7,601.3 ATV 4,711.1 4,706.9 4,704.8 4,702.9 4,700.8 7,798.6 7,798.6 7,956.3 7,953.8 7,952.0 DTV 4,593.0 4,588.9 4,586.5 4,568.5 4,525.2 7,393.3 7,393.3 7,423.2 7,420.7 7,447.1 Broadband 4,593.0 4,588.9 4,586.5 4,568.5 4,525.2 7,226.6 7,226.6 7,179.7 7,177.2 7,088.4 Penetration of Homes Marketable On-net Telephone 35.9% 36.0% 36.1% 36.1% 35.9% 31.4% 32.2% 33.3% 33.8% 33.9% Television - Total 30.0% 29.5% 29.1% 29.1% 29.1% 24.9% 24.7% 24.2% 24.5% 24.4% Television - DTV 29.8% 29.0% 28.5% 28.3% 28.1% 22.2% 21.5% 20.6% 20.1% 19.4% Broadband 27.2% 26.0% 24.9% 24.0% 22.2% 25.1% 24.7% 24.5% 24.0% 22.9% Total Customer 40.5% 40.2% 40.1% 40.1% 39.7% 37.8% 38.4% 38.2% 38.9% 38.9% Notes (1) Subscriber information reflects old Telewest and old NTL reported on-net with prior periods restated for policy alignments, where applicable. (2) Data cleanse activity in Q2-06 resulted in a decrease in old Telewest of 3,700 customers and 4,600 RGUs, a decrease of approximately 700 Telephone, 2,000 Broadband and 1,900 TV RGUs, and in old NTL of 32,500 customers and 64,400 RGUs, a decrease of approximately 12,800 Telephone, 22,400 Broadband and 29,200 TV RGUs. Data cleanse activity in Q2-06 is a result of more closely aligning customer definitions betwwen old NTL and old Telewest together with the removal of approximately 20,000 inactive backlog customers in old NTL. Data cleanse activity in Q4-05 resulted in a decrease in old NTL of 18,100 customers and 43,100 RGUs, a decrease of approximately 17,700 Telephone, 26,600 Broadband and an increase of 1,300 net TV RGUs. (3) Review of inactive backlog customers in Q4-05 resulted in an adjustment to remove 10,000 inactive backlog disconnects, representing approximately 12,300 RGUs. (4) Old Telewest operational statistics given above for Q1-06 are for the full 3 months ended March 31, 2006 on a pro forma basis including the period prior to the merger with old NTL. 18
  • 19. MOBILE OPERATIONS STATISTICS (data in 000's except ARPU) Mobile Q4-06 Q3-06 Q2-06 Q1-06 Q4-05 Mobile Customers (90 day active) (1 & 2) Opening Customers 4,511.7 4,389.0 4,331.6 4,346.0 4,153.4 Net customer adds 11.1 122.7 57.4 (14.4) 192.6 Closing Mobile Customers (90 day active) 4,522.8 4,511.7 4,389.0 4,331.6 4,346.0 Mobile monthly ARPU (3) £10.59 £10.28 ARPU calculation: Service revenue £141,800 £132,500 Average customers 4,465.4 4,294.8 Notes (1) Mobile customer information prior to acquisition has been taken, without adjustment, from Virgin Mobile's historical information. (2) 90 day active customers - Prepay customers are defined as active customers if they have made an outbound event in the preceding 90 days. Contract customers are defined as active customers if they have been provisioned and have not been disconnected. (3) Mobile monthly ARPU is calculated on service revenue for the periods since acquisition divided by the average 90 day active customers for the periods since acquisition, divided by three. NTL OFF-NET OPERATIONS STATISTICS (data in 000's) Off-net Q4-06 Q3-06 Q2-06 Q1-06 Q4-05 Off-net RGUs Opening RGUs 285.6 282.6 278.0 259.0 238.7 Net RGU adds 13.5 3.0 4.6 19.0 20.3 Closing off-net RGUs 299.1 285.6 282.6 278.0 259.0 RGUs Telephone 38.3 42.8 47.6 53.2 60.3 Broadband 260.8 242.8 235.0 224.8 198.7 Total RGUs 299.1 285.6 282.6 278.0 259.0 Net RGU Adds Telephone (4.5) (4.8) (5.6) (7.1) (4.1) Broadband 18.0 7.8 10.2 26.1 24.4 Total Net RGU Adds 13.5 3.0 4.6 19.0 20.3 19
  • 20. C) SEGMENTAL ANALYSIS (£ millions) (unaudited) Actual Reported Three months ended Dec 31, Sep 30, Jun 30, Mar 31, Dec 31, 2006 2006 2006 2006 2005 Revenue Cable segment Consumer 645.4 643.7 645.1 461.7 379.4 Business 169.0 162.3 160.1 122.8 105.2 Total 814.4 806.0 805.2 584.5 484.6 Inter segment revenue (1.2) (0.9) (0.4) (0.3) - 813.2 805.1 804.8 584.2 484.6 Mobile segment Virgin Mobile 151.4 140.4 - - - Inter segment revenue 0.3 - - - - 151.7 140.4 - - - Content segment Flextech 40.5 37.8 40.1 12.8 - Sit-up 82.0 47.5 45.1 16.2 - Total 122.5 85.3 85.2 29.0 - Inter segment revenue (5.8) (5.9) (5.7) (1.8) - 116.7 79.4 79.5 27.2 - Total revenue 1,081.6 1,024.9 884.3 611.4 484.6 Segment OCF Cable segment OCF 296.8 296.3 284.5 195.4 154.7 Mobile segment OCF 14.2 16.0 - - - Content segment OCF 2.0 5.5 8.8 3.0 - OCF (Total) 313.0 317.8 293.3 198.4 154.7 Pro Forma (for merger with Telewest) Three months ended Dec 31, Sep 30, Jun 30, Mar 31, Dec 31, 2006 2006 2006 2006 2005 (Reported) (Reported) (Reported) (Pro Forma) (Pro Forma) Revenue Cable segment Consumer 645.4 643.7 645.1 637.2 631.6 Business 169.0 162.3 160.1 165.6 168.2 Total 814.4 806.0 805.2 802.8 799.8 Inter segment revenue (1.2) (0.9) (0.4) (0.5) (0.4) 813.2 805.1 804.8 802.3 799.4 Mobile segment Virgin Mobile 151.4 140.4 - - - Inter segment revenue 0.3 - - - - 151.7 140.4 - - - Content segment Flextech 40.5 37.8 40.1 39.9 37.7 Sit-up 82.0 47.5 45.1 51.9 84.1 Total 122.5 85.3 85.2 91.8 121.8 Inter segment revenue (5.8) (5.9) (5.7) (5.3) (5.1) 116.7 79.4 79.5 86.5 116.7 Total revenue 1,081.6 1,024.9 884.3 888.8 916.1 Segment OCF Cable segment OCF 296.8 296.3 284.5 267.6 283.2 Mobile segment OCF 14.2 16.0 - - - Content segment OCF 2.0 5.5 8.8 9.4 8.8 OCF (Total) 313.0 317.8 293.3 277.0 292.0 Notes: Segment OCF includes inter segment revenue and costs as applicable. OCF (Total) is a non-GAAP financial measure - see Appendix F. The pro forma information presented in this schedule in respect of the three month periods ended March 31, 2006 and December 31, 2005 have been prepared on a basis as if the merger with Telewest had occurred on January 1, 2006 and January 1, 2005, respectively - see 20 Appendix E.
  • 21. D) Fixed Asset Additions (Accrual Basis) (in £ millions) (unaudited) Three months ended Dec 31, Sep 30, Jun 30, Mar 31, Dec 31, 2006 2006 2006 2006 2005 NCTA Fixed Asset Additions CPE 59.0 57.8 48.6 40.2 31.6 Scaleable infrastructure 44.9 45.0 46.0 51.4 48.7 Commercial 18.5 16.5 19.6 13.4 6.2 Line extensions 0.9 1.3 1.0 0.7 - Upgrade/rebuild 0.8 0.5 1.3 1.1 2.5 Support capital 49.5 18.0 16.3 10.6 7.5 Total NCTA Fixed Asset Additions 173.6 139.1 132.8 117.4 96.5 Non NCTA Fixed Asset Additions 5.0 8.2 1.1 0.4 (1.9) Total Fixed Asset Additions (accrual basis) 178.6 147.3 133.9 117.8 94.6 Change in capital accruals (20.8) (13.7) (5.8) 17.5 (22.8) Total Purchase of Fixed Assets and Intangible Assets 157.8 133.6 128.1 135.3 71.8 Comprising: Purchase of Fixed Assets 147.8 133.6 128.1 135.3 71.8 Purchase of Intangible Assets 10.0 - - - - 157.8 133.6 128.1 135.3 71.8 Note: Virgin Media is not a member of NCTA and is providing this information solely for comparative purposes. Fixed Asset Additions (accrual basis) are from continuing operations. See Appendix F for a discussion of the use of Fixed Asset Additions (accrual basis) as a non-GAAP financial measure and the reconciliation of Fixed Asset Additions (accrual basis) to GAAP Purchase of Fixed Assets and Purchase of Intangible Assets. Certain NCTA Fixed Asset Additions have been reallocated for the quarters ended March 31, June 30 and September 30, 2006. 21
  • 22. E) PRO FORMA COMBINED CONDENSED FINANCIAL INFORMATION (in £ millions) (unaudited) Three months ended Dec 31, Sep 30, Jun 30, Mar 31, Dec 31, 2006 2006 2006 2006 2005 (Reported) (Reported) (Reported) (Pro Forma) (Pro Forma) Revenue 1,081.6 1,024.9 884.3 888.8 916.1 Costs and expenses Operating costs (exclusive of depreciation shown separately below) 510.4 440.0 367.5 369.0 399.1 Selling, general and administrative expenses 258.2 267.1 223.5 242.8 225.0 Other charges 15.6 30.9 12.1 8.9 22.4 Depreciation 207.9 222.6 219.3 210.4 229.2 Amortization 80.3 73.9 55.6 58.6 59.8 1,072.4 1,034.5 878.0 889.7 935.5 Operating (loss)income 9.2 (9.6) 6.3 (0.9) (19.4) Other income (expense) Interest income and other, net 10.4 7.1 8.6 8.3 7.4 Interest expense (124.8) (113.2) (135.6) (112.0) (126.9) Gain (loss) on extinguishment of debt 0.1 (0.5) - (32.4) - Other, net 3.2 1.6 5.7 (9.2) 4.0 Share of income from equity investments 4.1 3.9 3.1 5.0 2.5 Foreign currency transaction gains (losses) 7.7 6.3 (94.1) (8.6) 33.0 (Loss) from continuing operations before income taxes (90.1) (104.4) (206.0) (149.8) (99.4) Income tax benefit (expense) 1.0 0.9 9.9 - (12.6) Minority interest 1.0 (0.7) 0.3 0.4 - (Loss) from continuing operations (88.1) (104.2) (195.8) (149.4) (112.0) Reconciliation of Pro Forma OCF to Pro Forma Operating income (loss) Pro Forma OCF 313.0 317.8 293.3 277.0 292.0 Less: Other charges (15.6) (30.9) (12.1) (8.9) (22.4) Depreciation (207.9) (222.6) (219.3) (210.4) (229.2) Amortization (80.3) (73.9) (55.6) (58.6) (59.8) Pro Forma Operating income (loss) 9.2 (9.6) 6.3 (0.9) (19.4) The pro forma information presented in these schedules in respect of the three months ended March 31, 2006 has been prepared on a basis as if the merger with Telewest had occurred on January 1, 2006 and the pro forma information in respect of the three months ended on December 31, 2005 has been prepared on a basis as if the merger with Telewest had occurred on January 1, 2005 and includes adjustments to reflect the purchase accounting impact on our historical results. Readers should refer to the notes below for further explanation of the adjustments made. These pro forma operating results are not necessarily indicative of the results that would have been achieved if the merger with Telewest had occurred on January 1, 2006 or January 1, 2005, and undue reliance should not be placed on this information. No pro forma financial information has been included in these schedules in respect of the results of Virgin Mobile prior to its acquisition. The presentation does not include all the information and footnotes required by generally accepted accounting principles in the United States to be included in pro forma financial statements. 22
  • 23. Proforma Combined Condensed Financial Information Three months ended March 31, 2006 (in £ millions) (unaudited) NTL Inc. Telewest Total Pro Forma As reported Jan 1 - Mar 3 Adjustments Combined Revenue 611.4 279.9 (2.5) 888.8 Costs and expenses Operating costs (exclusive of depreciation shown separately below) 254.9 88.5 25.6 369.0 Selling, general and administrative expenses 158.1 110.0 (25.3) 242.8 Other charges 8.4 0.5 - 8.9 Depreciation 149.3 66.1 (5.0) 210.4 Amortization 36.8 8.4 13.4 58.6 607.5 273.5 8.7 889.7 Operating income (loss) 3.9 6.4 (11.2) (0.9) Other income (expense) Interest income and other, net 8.6 4.0 (4.3) 8.3 Interest expense (83.8) (22.2) (6.0) (112.0) (Loss) on extinguishment of debt (32.4) - - (32.4) Other, net (9.2) - - (9.2) Share of income from equity investments 1.4 3.6 - 5.0 Foreign currency transaction (losses) gains (10.0) 1.4 - (8.6) (Loss) from continuing operations before income taxes (121.5) (6.8) (21.5) (149.8) Income tax (expense) benefit - - - - Minority interest 0.4 - - 0.4 Cumulative effect of a change in accounting principle 1.2 0.8 - 2.0 (Loss) from continuing operations (119.9) (6.0) (21.5) (147.4) For the three months ended March 31, 2006, the unaudited pro forma combined condensed financial information contains the actual combined operating results of NTL with the results of Telewest for the period from January 1, 2006 to March 3, 2006 adjusted to include the pro forma impact of: the elimination of transactions between the former NTL and the former Telewest; the adjustment of amortization of acquired intangible assets and depreciation of fixed assets based on the preliminary purchase price allocation; the adjustment of interest income based on the reduced cash balance after the merger transaction; the adjustment of interest expense based on the refinancing in March 2006 using the new senior credit facility and bridge facility borrowing rates; to reflect the impact of income taxes on the pro forma adjustments utilizing NTL's statutory tax rate of 35% and certain accounting policy alignment adjustments. Readers can refer to the Unaudited Pro Forma Combined Condensed Financial Data filed on Form 8-K/A on May 10, 2006, for detailed descriptions of the adjustments made to this information. 23
  • 24. Proforma Combined Condensed Financial Information Three months ended December 31, 2005 (in £ millions) (unaudited) Historical Historical Total Pro Forma NTL Telewest Adjustments Combined Revenue 484.6 434.5 (3.0) 916.1 Costs and expenses Operating costs (exclusive of depreciation shown separately below) 205.2 163.9 30.0 399.1 Selling, general and administrative expenses 124.7 133.8 (33.5) 225.0 Other charges 22.4 - - 22.4 Depreciation 139.5 97.9 (8.2) 229.2 Amortization 27.2 16.0 16.6 59.8 519.0 411.6 4.9 935.5 Operating income (loss) (34.4) 22.9 (7.9) (19.4) Other income (expense) Interest income and other, net 7.8 6.1 (6.5) 7.4 Interest expense (55.6) (43.1) (28.2) (126.9) (Loss) on extinguishment of debt - - - - Other, net 0.9 3.1 - 4.0 Share of income from equity investments - 2.5 - 2.5 Foreign currency transaction (losses) gains 35.2 (2.2) - 33.0 (Loss) from continuing operations before income taxes (46.1) (10.7) (42.6) (99.4) Income tax (expense) benefit (10.1) (2.5) - (12.6) Minority interest - - - - (Loss) from continuing operations (56.2) (13.2) (42.6) (112.0) For the three months ended December 31, 2005, the unaudited pro forma combined condensed financial information contains the actual combined operating results of NTL and the former Telewest adjusted to include the pro forma impact of: the elimination of transactions between the former NTL and the former Telewest; the adjustment of amortization of acquired intangible assets and depreciation of fixed assets based on the preliminary purchase price allocation; the adjustment of interest income based on the reduced cash balance after the transaction; the adjustment of interest expense based on the refinancing in March 2006 using the new senior credit facility and bridge facility borrowing rates; to reflect the impact of income taxes on the pro forma adjustments utilizing NTL's statutory tax rate of 35% and certain accounting policy alignment adjustments. Readers can refer to the Unaudited Pro Forma Combined Condensed Financial Data filed on Form 8-K/A on May 10, 2006, for detailed descriptions of the adjustments made to this information. 24