1. Danaher Corporation
Supplemental Financial Information
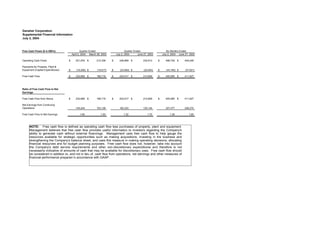
July 2, 2004
Quarter Ended Quarter Ended Six Months Ended
Free Cash Flows ($ in 000's):
April 2, 2004 March 28, 2003 July 2, 2004 June 27, 2003 July 2, 2004 June 27, 2003
Operating Cash Flows $ 251,876 $ 214,336 $ 246,869 $ 234,912 $ 498,745 $ 449,248
Payments for Property, Plant &
Equipment (Capital Expenditures) $ (19,208) $ (15,617) $ (23,952) $ (22,004) $ (43,160) $ (37,621)
Free Cash Flow $ 232,668 $ 198,719 $ 222,917 $ 212,908 $ 455,585 $ 411,627
Ratio of Free Cash Flow to Net
Earnings:
Free Cash Flow from Above $ 232,668 $ 198,719 $ 222,917 $ 212,908 $ 455,585 $ 411,627
Net Earnings from Continuing
Operations 145,244 103,126 182,233 125,144 327,477 228,270
Free Cash Flow to Net Earnings 1.60 1.93 1.22 1.70 1.39 1.80
NOTE: Free cash flow is defined as operating cash flow less purchases of property, plant and equipment.
Management believes that free cash flow provides useful information to investors regarding the Company's
ability to generate cash without external financings. Management uses free cash flow to help gauge the
resources available for strategic opportunities such as making acquisitions, investing in the business and
strengthening the Company's balance sheet, and uses this measure in making operating decisions, allocating
financial resources and for budget planning purposes. Free cash flow does not, however, take into account
the Company's debt service requirements and other non-discretionary expenditures and therefore is not
necessarily indicative of amounts of cash that may be available for discretionary uses. Free cash flow should
be considered in addition to, and not in lieu of, cash flow from operations, net earnings and other measures of
financial performance prepared in accordance with GAAP.
2. Danaher Corporation
Supplemental Financial Information
July 2, 2004
Debt to Total Capital and Net Debt
to Total Capital Ratios ($ in 000's): Actual Balance As Of:
July 2, 2004 December 31, 2003
Notes Payable and Current Portion of
Long-term Debt $ 18,317 $ 14,385
Long-term Debt 1,282,309 1,284,498
Total debt 1,300,626 1,298,883
Total Stockholders' Equity 3,983,401 3,646,709
Total Capital $ 5,284,027 $ 4,945,592
Debt to Total Capital Ratio 24.6% 26.3%
Total Debt $ 1,300,626 $ 1,298,883
Less: Cash and Cash Equivalents (303,285) (1,230,156)
Net Debt 997,341 68,727
Total Capital $ 5,284,027 $ 4,945,592
Net Debt to Total Capital Ratio 18.9% 1.4%
NOTE: Debt to Total Capital is defined as the ratio of Total Debt (including notes
payable, current portion of long-term debt and long-term debt) to Total Capital
(the sum of Total Debt and Stockholders’ Equity). Net Debt to Total Capital is
defined as the ratio of Total Debt less Cash and Cash Equivalents to Total
Capital. Management believes these ratios provide useful information to
investors regarding the Company's debt leverage in relation to the size of its
available capital base and existing cash resources. Management uses these
ratios to evaluate the Company’s leverage over time to help determine the ability
of the Company to access additional borrowing capacity. These ratios do not
however necessarily indicate the ability of the Company to satisfy the debt
service requirements in existing or future debt agreements. These ratios should
be considered in addition to, and not in lieu of, other measures of liquidity
including working capital prepared in accordance with GAAP.