High Class Call Girls Nashik Maya 7001305949 Independent Escort Service Nashik
1Q2008EARNINGSTRANSCRIPT
1. PPG Industries, Inc. First Quarter 2008 Financial Results
William H. Hernandez, Sr. Vice President, Finance – April 17, 2008, Recorded Comments
Good morning and thank you for your time and interest in PPG. I will review PPG’s first
quarter 2008 performance and comment on various industry and economic trends that are
impacting our performance. If you turn to slide 3, let me quickly recap the quarter.
Financial Highlights
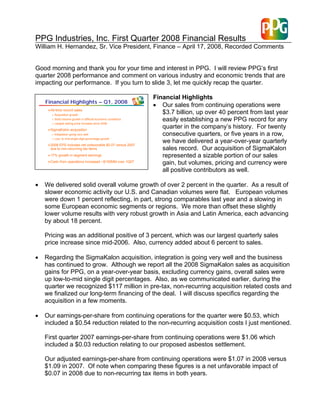
Financial Highlights – Q1, 2008
• Our sales from continuing operations were
All-time record sales
$3.7 billion, up over 40 percent from last year
Acquisition growth
easily establishing a new PPG record for any
Solid volume growth in difficult economic conditions
Largest selling price increase since 2006
quarter in the company’s history. For twenty
SigmaKalon acquisition
consecutive quarters, or five years in a row,
Integration going very well
Low- to mid-single-digit percentage growth
we have delivered a year-over-year quarterly
2008 EPS includes net unfavorable $0.07 versus 2007
sales record. Our acquisition of SigmaKalon
due to non-recurring tax items
represented a sizable portion of our sales
17% growth in segment earnings
gain, but volumes, pricing and currency were
Cash from operations increased ~$150MM over 1Q07
all positive contributors as well.
• We delivered solid overall volume growth of over 2 percent in the quarter. As a result of
slower economic activity our U.S. and Canadian volumes were flat. European volumes
were down 1 percent reflecting, in part, strong comparables last year and a slowing in
some European economic segments or regions. We more than offset these slightly
lower volume results with very robust growth in Asia and Latin America, each advancing
by about 18 percent.
Pricing was an additional positive of 3 percent, which was our largest quarterly sales
price increase since mid-2006. Also, currency added about 6 percent to sales.
• Regarding the SigmaKalon acquisition, integration is going very well and the business
has continued to grow. Although we report all the 2008 SigmaKalon sales as acquisition
gains for PPG, on a year-over-year basis, excluding currency gains, overall sales were
up low-to-mid single digit percentages. Also, as we communicated earlier, during the
quarter we recognized $117 million in pre-tax, non-recurring acquisition related costs and
we finalized our long-term financing of the deal. I will discuss specifics regarding the
acquisition in a few moments.
• Our earnings-per-share from continuing operations for the quarter were $0.53, which
included a $0.54 reduction related to the non-recurring acquisition costs I just mentioned.
First quarter 2007 earnings-per-share from continuing operations were $1.06 which
included a $0.03 reduction relating to our proposed asbestos settlement.
Our adjusted earnings-per-share from continuing operations were $1.07 in 2008 versus
$1.09 in 2007. Of note when comparing these figures is a net unfavorable impact of
$0.07 in 2008 due to non-recurring tax items in both years.
2. 2
A key measure of our business growth is our total segment earnings which increased by
17 percent versus last year.
• Regarding cash, our cash from operations increased by about $150 million dollars
versus the first quarter of 2007.
To quickly recap our performance, we are very pleased with our organic growth and double-
digit segment earnings growth, especially in the light of today’s economic backdrop. This
performance provides a clear measure of the success of our prior actions taken to expand
our geographic footprint and broaden our end-markets served, which has resulted in a
stronger, more resilient company. Also, we are delivering on our commitments relative to
the SigmaKalon acquisition. Finally, we remain focused on increasing even further our
historically strong cash generation with the primary use of this cash in the near-term to grow
our earnings through the paying down of our debt.
Now let’s review some of the details.
Sales by Geography
Sales by Geography – Q1, 2008
The next slide illustrates our new geographic mix
of sales. As displayed, we have excellent
PPG Total Total PPG Coatings
Eastern
geographic diversity. Of note is that our sales in
Europe
7%
Asia
ROW Western
the U.S. and Canada have segued from nearly 75
12%
4% Europe
38%
percent of our total reported just two years ago, to
Western
Latin
Europe
about 45 percent today.
America
31%
Asia U.S. & Canada
5%
15% 32%
U.S. & Canada
Eastern
46%
Europe
Our total coatings sales are even more diverse
10%
with the U.S. and Canada accounting for about
Diverse Geographic Sales Mix
30 percent of our total, Western Europe accounts
for about 40 percent, and combined the emerging regions of Asia, Eastern Europe and Latin
America now account for about 30 percent.
Our past strategic actions have provided us with this broad geographic distribution, which
enables us to take advantage of regional growth and also minimize the impact of economic
slowing in any individual region.
Quarterly Volume Change - PPG
Quarterly Volume Change – PPG
The next slide provides details on PPG’s organic
volume trend. This was our ninth consecutive
From Prior Year Quarter
quarter of positive volume growth, but our growth
12
slowed from the prior year’s trend. Factored into
U.S.
10 Hurricanes
Percent
8
the slower rate of growth were a variety of
6
headwinds this past quarter including the
4
2
weakening U.S. economy, a major supplier strike
0
-2
which impacted General Motors production in the
2003 2004 2005 2006 2007 2008
1st Qtr 2nd Qtr 3rd Qtr 4th Qtr
United States, and a shift of the Easter holiday
into the first quarter this year.
Nine Consecutive Quarters of Solid Organic Growth
Our strong growth in the Asian and Latin American regions, and in businesses such as
Optical and Aerospace, more than offset the impact of these headwinds.
3. 3
Quarterly Volume Change – Europe
The following slide shows our volume trend in
Quarterly Volume Change – Europe
Europe. Volumes were down slightly this year
due to some slowing in Western Europe
From Prior Year Quarter
combined with some difficult comparables from
10
8
solid growth in several businesses the past two
6
Percent
years as evidenced by the chart. These
4
2
comparables included strong 2007 results in
0
Automotive Refinish bolstered by customer
-2
-4
conversions to our new water-based product last
-6
2003 2004 2005 2006 2007 2008
year following government regulations eliminating
1st Qtr 2nd Qtr 3rd Qtr 4th Qtr
solvent-based product.
Our SigmaKalon results are not included in this chart as all their sales are classified as
acquisition sales. However, as noted earlier, our Architectural EMEA business, which
represents the major portion of the acquired SigmaKalon business, enjoyed low-to-mid
single digit percentage growth versus 2007, exclusive of currency gains.
Quarterly Volume Change – Asia
Quarterly Volume Change – Asia
Next is a slide detailing our Asian volume
performance. Once again our comparables were
From Prior Year Quarter
exceedingly difficult, and once again we have
25
grown by double-digit percentages. Our 18
20
percent growth was our best performance in the
15
Percent
past four years despite a much larger sales base
10
and frankly excellent performance in many of the
5
0
previous quarters.
2003 2004 2005 2006 2007 2008
1st Qtr 2nd Qtr 3rd Qtr 4th Qtr
Our total sales in this region are more than three
Double-Digit Growth Despite Strong Comparable
7
times what they were just two years ago, and are
now a very meaningful portion of both sales and earnings for PPG.
Now let’s review our overall segment results detailed on the next slide.
Business Segment Results
I will discuss each segment in further detail later,
Business Segment Results
but let me summarize a few key items.
First Quarter
$MM (USD)
•
Sales Earnings
Total sales grew over 40 percent, driven by a
2008 2007 Chg. 2008 2007 Chg.
Performance Coatings $ 1,114 $ 855 30% $ 120 $ 121 -1%
30 percent gain due to our acquisitions.
Industrial Coatings 1,058 869 22% 95 95 -
Favorable currency added about 6 percent to
Architectural Coatings EMEA 536 - - 9 - -
Optical & Specialty Mtls. 295 251 18% 74 63 17%
sales. Despite various headwinds, organic
Commodity Chemicals 423 371 14% 68 44 55%
Glass 294 286 3% 19 6 216%
growth was achieved in every segment except
Total PPG $ 3,720 $ 2,632 41% $ 385 $ 329 17%
Glass, which was down slightly. We
established sales records in several segments
Solid Organic Growth Supplemented by Acquisitions
and most of our individual business units.
• Segment earnings improved by $56 million or 17 percent. Earnings in Performance and
Industrial coatings were level with last year, as growth outside the United States, offset
4. 4
lower U.S. results due to a difficult U.S. economy. Architectural EMEA earnings are all
incremental and reflect results for a seasonally slower period for the business. These
earnings also include the majority of the $20 million in intangible amortization expense
stemming from the acquisition.
Optical & Specialty Materials posted a 17 percent improvement in earnings based on
strong sales growth stemming from introduction in the United States of our new
generation Transitions Optical product. Chlor-Alkali delivered meaningful earnings
growth driven by higher pricing, while Glass earnings were aided by better Fiber Glass
results.
Now let’s review our earnings-per-share results.
First Quarter Comparisons
First Quarter Comparisons
As depicted on slide #9, we reported first quarter
earnings per share of $0.61 comprised of
Regulation G Reconciliation -
2008 2007
(Results from Operations)
Million EPS Million EPS
earnings from continuing operations, net of tax of
Income from continuing operations, as reported $ 87 $ 0.53 $ 176 $ 1.06
$0.53, and earnings from discontinued
Net income includes the following charges:
Acquisition - related costs $ 89 $ 0.54 - -
Asbestos settlement - net - - $ 5 $ 0.03
operations, net of tax of $0.08.
Adjusted income from continuing operations $ 176 $ 1.07 $ 181 $ 1.09
Memo: Tax Rate 30% 23%
The reported net earnings from continuing
2008 2007
Million EPS Million EPS
Income from continuing operations, as reported $ 87 $ 0.53 $ 176 $ 1.06
operations include a reduction of $89 million
Income from discontinued operations, as reported $ 13 $ 0.08 $ 18 $ 0.11
Net income, as reported $ 100 $ 0.61 $ 194 $ 1.17
after-tax, or $0.54 cents per share, related to non-
All amounts: US$
recurring acquisition related costs from the flow
through cost of sales of the step-up to fair value of the inventory acquired in the SigmaKalon
acquisition and the write-off of in process research and development costs. The impact of
our proposed asbestos settlement on our first quarter results was not material.
As noted earlier, our adjusted earnings-per-share from continuing operations was $1.07,
which was achieved due to our double-digit segment earnings growth.
Last year our reported first quarter earnings-per-share from continuing operations was
$1.06. This figure included a 3 cent charge related to the asbestos settlement.
Our tax rate on continuing operations in the first quarter last year was 23 percent, and is
about 30 percent in the first quarter of 2008. Tax rates in both years included adjustments
due to non-recurring items. The net unfavorable impact of these non-recurring tax items on
2008 earnings-per-share is $0.07 when comparing results versus last year.
Income from discontinued operations, net of tax was $13 million or $0.08 per share in the
first quarter this year, compared with $18 million and $0.11 per share a year ago.
Please refer to slide number 9 of this presentation on the investor center section of our
website for a reconciliation of these adjusted earnings amounts to the comparable GAAP
financial measures.
Let me now discuss some relevant economic statistics.
5. 5
Economic Indicators
Economic Indicators The next slide provides an overview of either our
or Global Insight’s current estimates of relevant
1Q 2008
(change from 1Q 2007)
economic statistics. I will also provide our outlook
U.S. Real GDP* 2%
EEC Real GDP*
for the coming quarter.
Western Europe 2%
Emerging Europe 6%
China Real GDP* 11%
N.A. Vehicle Production -6%
Year-over-year U.S. GDP growth is estimated to
Western Europe Auto Production* -2%
Eastern Europe Auto Production* 16%
China Auto Production* 21%
be about two percent, but activity has softened
U.S. Industrial Production* 1%
throughout the quarter. This figure differs from
U.S. Housing Starts* -30%
U.S. Commercial Const. (Real Inv.)* 12%
the well documented GDP comparison versus the
*Estimates
last quarter of 2007 which is expected to be flat or
possibly even negative, however we have historically utilized the year-over-year figure as it
is a better proxy for sales comparisons versus last year’s first quarter.
Year-over-year GDP growth in Western Europe was also estimated to be about 2 percent,
with Emerging Europe growth estimated to be three times that figure. Meanwhile, GDP in
China advanced by about 11 percent, while Latin America grew by mid single-digit
percentages.
In the second quarter we expect growth in the North American economy to slow even more.
Exports should continue to provide an economic boost, offset by the drag from higher
energy costs, lower consumer spending and tighter credit markets.
We anticipate the economy in Western Europe will continue at a level consistent with the
first quarter. Unemployment in Western Europe is at one of its lowest levels in the past
decade, but higher inflation and flattening-to-declining results in some sectors continue to
mitigate growth advances. Solid growth will continue in Emerging Europe supported by
growing infrastructure needs and continued manufacturing expansions.
We expect other emerging economies, including China and Latin America, to continue to
experience rapid growth.
Last, we continue to closely watch two U.S. economic statistics, employment and consumer
spending, which at present are close to but not at levels signaling a U.S. recession. Over
the past several months, these statistics have continued to drift downward which has
created a contraction of the overall growth rate. We continue to believe these will remain
the two most relevant economic figures in today’s economy.
Next is automotive production, which on a global basis continued to advance with mid-single
digit percentage gains. In the quarter, North American light vehicle production is estimated
to have declined about 6 percent, due in part to a General Motors supplier strike. Total
European vehicle production is estimated to have increased by about 3 percent, with a 2
percent decline in Western Europe offset by growth exceeding 15 percent in Eastern
Europe. Asian growth is estimated to have exceeded 20 percent.
Our global automotive OEM coatings business grew organically once again, posting mid-
single digit percentage volume gains despite negative U.S. volumes. Our growth is a result
of both the global reach of our business and our excellent customer relationships supported
by innovative technologies and services.
6. 6
Looking ahead we again expect global vehicle production growth next quarter, but still
anticipate a decline in the U.S. market.
Shifting to overall industrial production, we continue to see and benefit from the continued
globalization of the industrial base. North American industrial production improved by about
1 percent year-over-year. Western Europe is estimated to have produced growth of about 3
percent. China is expected to have grown by nearly fifteen percent. I will remind you that
both a shift in the Easter holiday and, specific to the U.S., the G.M. supplier strike weighed
on the quarter’s results.
Our industry projections in the U.S. for next quarter are for slower growth year-over-year,
but up slightly sequentially.
Finally in the construction markets, the U.S. commercial and residential construction
markets moved once again in drastically opposite directions. Residential construction
softened even further, contracting by about 30 percent year-over-year. Conversely,
commercial construction has grown by more than 10 percent over the same period.
Looking ahead, we are not anticipating any recovery in the U.S. housing market in the near
term. Regarding commercial construction, there is anecdotal evidence of certain sub-
segments hitting a plateau, while other sub-segments continue to grow nicely. While our
organic North American architectural business results have outpaced the combined market,
this has and will remain a very challenging environment.
Let me conclude our economic discussion by mentioning that we have evidenced notable
contraction in several U.S. economic sectors, including residential housing and automotive
production. Both of these U.S. segments are already in recession, and have been for some
time. We are working hard to effectively manage our businesses serving these markets. At
the same time, we have continued to benefit from growth in other economic segments such
as Aerospace, along with broad industrial growth supporting higher exports.
There is no question that the U.S. economy is, at a minimum, flirting with an overall
recession. However, our past strategic actions to significantly change our geographic
footprint and broaden our end-markets served, have allowed PPG to continue to grow
despite the U.S. economic slowdown. While there will likely be some contagion in other
regions from the weakening U.S. economy, for PPG we expect continued growth in these
other regions to more than offset any negative U.S. impacts.
We have years of experience managing the ups and downs of the business cycle. If the
U.S. economy does slip into a potentially prolonged recession, we will manage our
businesses appropriately, with the intent of minimizing any impacts to PPG and our
shareholders.
Key Topics and Outlook
Now moving to slide #11, let me discuss a few other key topics.
7. 7
Energy costs remain a focal issue. In the quarter,
Key Topics our primary energy cost, natural gas, inflated to
$8.50 per unit, up from a comparative of $7.50 in
Energy / Natural Gas both the first and fourth quarters of last year.
Coatings Raw Materials
For those of you less familiar with PPG, we use
Freight 60 to 70 trillion BTUs of natural gas a year to
generate power for the production of chlorine and
Asbestos
caustic soda, and to produce glass and fiber
glass. So if natural gas unit costs change by one
dollar per million BTU, our pre-tax costs change
by about 60-to-70 million dollars on an annual basis.
We have also experienced increases in our coatings raw material costs, which includes
petroleum-based materials and is by far the largest component of production costs for
coatings. Our expectation at the outset of the quarter was for inflation in the range of 2-to-4
percent and our actual inflation was right at 2 percent.
In addition, we also experienced rapid inflationary impacts in freight costs due primarily to
direct costs and surcharges associated with rising gasoline costs. Our total freight costs in
the quarter increased by approximately $20 million versus last year, an increase of more
than 15 percent.
As we look ahead, the energy markets remain volatile due in part, in our opinion, to
speculation. Accordingly, we expect no relief in our energy or freight costs.
Regarding natural gas costs, based on pricing at the beginning of the quarter, we have
about 30 percent of our second quarter costs hedged at about $8.75 per million BTU. As a
reminder, comparable per unit costs were $8.50 in the first quarter of 2008 and $7.70 in the
second quarter of 2007.
With respect to coatings raw materials, feedstock pressures will remain, but we expect
second quarter inflation to remain within our previously communicated range of 2- to-4
percent. Our substantial organic growth and acquisitions, geographic diversity, broadening
of our supplier base and ability to reformulate our products have continued to aid us in
minimizing these inflationary impacts.
As I mentioned earlier, our selling pricing was up 3 percent this past quarter which was our
largest increase in a few years, but we did not fully offset these higher costs. Our
businesses will continue to work to secure pricing to offset these inflationary items.
Now before I review our business results in more detail, I typically provide an update on our
proposed asbestos settlement. For those not familiar with the details of the proposed
settlement, please refer to the disclosures beginning on page 58 of our 2007 form 10-k.
As we said in previous updates, we have filed motions asking the court to reconsider, alter
or amend its ruling from December, 2006. Also, various parties, including PPG, are
currently working toward a third amended plan of reorganization to address issues the court
raised in its ruling. Given the overall complexity of the issue, we are not able to offer any
time line upon which any next step will be taken.
8. 8
Now let’s discuss our businesses performance.
Business Segment Performance –
Performance Coatings Performance Coatings
Slide #12 illustrates the results in our
First Quarter 2008 $MM (USD) Q108 Q107 Chg %
Difficult U.S. Architectural market Sales 1,114 855 259 30%
Performance Coatings segment. First quarter
Volume growth ↑1% Earnings 120 121 -1 -1%
Aerospace volumes ↑
sales grew by slightly more that $250 million or
Protective & Marine volumes ↑
about 30 percent. Acquisitions added about 21
percent growth, currency added 6 percent,
Yr. To Yr. % Change - Sales
Sales Volume Price Currency Acq./Other
Total Performance
volumes grew 1 percent and price added 2
Coatings 30% 1% 2% 6% 21%
percent.
Architectural 16% -4%
(Americas & Asia)
Aerospace 12% 7%
Automotive Refinish 14% -1%
Protective & Marine 196% 11%
Our segment earnings were $120 million,
comparable to last year. As I will discuss shortly, earnings were negatively impacted by
lower volumes in certain regions or businesses, offset by favorable growth elsewhere. Also,
the favorable impact of currency offset higher future growth focused costs in certain
business including Protective & Marine Coatings and Automotive Refinish.
Let me review a few key items in our business units:
• Our Architectural Coatings Americas and Asia business unit grew sales by 16 percent.
This growth was principally due to acquisitions and currency, as our total U.S. volumes
were down mid-single digits where we experienced sharp volume declines in our
professional channels, both in our company-owned stores and in independent dealers.
These lower volumes were partially offset by volume gains in our national accounts or
“big-box” channel.
Looking ahead we are not projecting any improvement, and actually may see some
further deterioration in this business in the second quarter based on continued end-
market weakness. We have been and will remain diligent on managing our costs, and
are focused on pricing to offset raw material increases.
• In Aerospace, our excellent double-digit growth continued with sales improving by 12
percent, supported by volume and pricing gains, and currency. This is one of our
strongest end-markets and we expect it to remain strong in the foreseeable future.
• Our Automotive Refinish sales grew by 14 percent driven by both currency and
acquisitions. Pricing was also up, offsetting slight volumes declines. These volume
declines were driven by lower European volumes, based on a strong comparable from
last year. We anticipate this business will deliver both positive pricing and volumes in
the second quarter.
• We added this year our Protective & Marine Coatings business unit to this segment, as
the SigmaKalon acquisition more than doubled our sales into this end-market. In
addition to the acquisition gains, we also experienced organic growth from our base
business with pricing gains and double-digit volume gains. Similar to Aerospace, sizable
growth opportunities remain due to the robust end-markets served by this business.
9. 9
To summarize the quarter for this segment, our organic growth in Aerospace and Protective
& Marine allowed us to absorb and offset the impacts of lower activity levels elsewhere.
Additionally, we were able to invest in future growth initiatives which will begin to provide
benefits as early as next quarter. Last, our acquisitions are meeting our expectations and
also provide another basis for additional growth in the future.
Business Segment Performance – Industrial
Industrial Coatings
Coatings
Moving to the next slide detailing our Industrial
First Quarter 2008 $MM (USD) Q108 Q107 Chg %
Strong global growth more than Sales 1,058 869 189 22%
Coatings segment, our sales rose by just under
offset slower U.S. economy
Earnings 95 95 - -
Diverse, expanding global footprint
$190 million or 22 percent. About half of the gain
Auto OEM volumes ↑ outperform
industry
was due to the acquisition of SigmaKalon’s
Yr. To Yr. % Change - Sales
industrial coatings business. The remainder of
Sales Volume Price Currency Acq./Other
Total Industrial
the increase was due to favorable currency and
Coatings 22% 3% 0% 9% 10%
positive volume growth in all businesses.
Automotive OEM 13% 4%
Industrial 41% 1%
Packaging 14% 2%
This segment has our greatest geographic
diversity. We continued to experience headwinds in the U.S. and Canada with volumes
declining high-single digits, but that region now accounts for less than 30 percent of the
segment total. We more than offset these negative impacts with very strong organic growth
in Europe, Asia and Latin America. Combined, these regions averaged a robust 10 percent
volume growth, and account for 70 percent of the segment.
Our segment earnings were flat reflecting the impact of the weaker U.S. market and higher
inflation, offset by strong results in our Non-U.S. regions and positive acquisition related
earnings.
Let me quickly comment on each of the businesses comprising the Industrial Coatings
segment:
• Our Automotive OEM Coatings business grew by 13 percent and set a new first quarter
sales record, despite the negative impact of a U.S. General Motors supplier strike and
the calendar impact of the Easter holiday. Volume increases of 4 percent once again
validate the growth potential of this business supporting global growth in this end-market.
• Industrial Coatings business unit sales improved by 41 percent, with the SigmaKalon
acquisition contributing about three-fourths of that growth. Overall volumes grew slightly,
despite U.S. volumes which were down by about 10 percent, as double-digit percentage
growth was achieved in emerging regions.
• Packaging Coatings sales grew by 14 percent with currency the main factor, although
volumes and price also contributed.
Overall our Industrial Coatings segment results truly reflect the geographic diversity of the
segment as we were able to offset appreciably lower U.S. market results. Looking ahead,
we expect a continuation of the current market conditions in all of these regions.
10. 10
Business Performance – Architectural EMEA
Architectural Coatings EMEA
Our next segment is Architectural Europe, Middle
East and Africa or EMEA, and it represents about
First Quarter 2008 $MM (USD) Q108 Q107 Chg %
Seasonally slow quarter Sales 536 n/a n/a n/a
three-quarters of the acquired SigmaKalon
Low- to mid-single-digit Earnings 9 n/a n/a n/a
percentage growth versus 2007
Earnings include non-cash
business. Segment sales in a seasonally slow
intangible amortization
quarter were $536 million. Excluding positive
Acquisition Update
currency impacts, sales grew by low-to-mid single
Integration underway, going well
Final financing in place
digit percentages versus SigmaKalon results last
On pace for annual cost synergy targets
year, reflecting continued organic growth in
several regions.
Earnings for the segment were $9 million which included the reduction of earnings
associated with the majority of the $20 million non-cash intangible amortization stemming
from the acquisition.
We mentioned previously that the first quarter was a seasonally slow quarter for this
segment, with 15-to-20 percent of annual sales and about 10-to-15 percent of the annual
earnings in this quarter. Historically the second quarter represents 30-to-35 percent of the
annual totals, which will result in a material sales and earnings increase versus the first
quarter.
Also, I will quickly comment on the overall SigmaKalon integration which is going extremely
well. I have been very impressed with the energy and enthusiasm exhibited by both our
existing and our new colleagues.
And, despite a fairly volatile credit market, we were successful during the quarter in placing
our permanent financing within in the interest rate range we previously stipulated upon
announcing the deal last July.
Last, we remain on target to achieve our full year 2008 cost synergy target of $25-to-$75
million, with measurable progress already achieved this past quarter despite this being the
first quarter of integration.
Business Segment Performance – Optical
Products and Specialty Materials
Optical & Specialty Materials
Shifting to our Optical and Specialty Materials
First Quarter 2008 $MM (USD) Q108 Q107 Chg %
segment on slide #15, we once again delivered
Successful launch of new Sales 295 251 44 18%
Transitions Optical product
record sales supported by the introduction of our
Earnings 74 63 11 17%
Double-digit volume growth
17% earnings growth
new generation Transitions Optical product.
Segment earnings improved 17 percent driven by
Yr. To Yr. % Change - Sales
Sales Volume Price Currency Acq./Other
volume growth in Optical which offset lower
Total Optical &
Specialty Materials 18% 10% 1% 6% 1%
earnings in our Specialty businesses due to
higher raw material costs. Segment operating
margins remained in the mid-20’s.
Looking ahead, we will likely experience additional increases in our Specialty businesses
input costs, but are very pleased with the excitement and growth rates driven by our new
Transitions technology and anticipate this carrying forward into next quarter.
11. 11
Business Segment Performance – Commodity
Commodity Chemicals
Chemicals
Shifting to the next slide detailing our Commodity
First Quarter 2008 $MM (USD) Q108 Q107 Chg %
55% earnings improvement Sales 423 371 52 14%
Chemicals segment, sales increased by about 14
Increased selling prices Earnings 68 44 24 55%
Higher input costs
percent to a new first quarter record. Most of the
sales gain was due to positive pricing which has
been on an upward trend since the beginning of
Yr. To Yr. % Change - Sales
Sales Volume Price Currency Acq./Other
2007 as customer demand remained strong.
Total Commodity
Chemicals 14% 1% 12% 1% 0%
Earnings in the segment improved by over 50
percent, with favorable manufacturing
performance adding to the price gains. Meanwhile, natural gas, ethylene and freight costs
experienced significant year-over-year inflation, which acted to moderate the earnings
improvement.
Price increases have been announced for select products for the second quarter. Also, we
are planning on some minor maintenance outages, which will impact our production
volumes.
Business Segment Performance - Glass
Glass Slide #17 details our Glass segment. During the
quarter, our sales grew by 3 percent driven
First Quarter 2008 $MM (USD) Q108 Q107 Chg %
Improved Fiber Glass results
primarily by currency gains. Positive pricing did
Sales 294 286 8 3%
Higher input costs Earnings 19 6 13 216%
Difficult external market
not fully offset volumes which were down 2
conditions likely to remain
percent.
Yr. To Yr. % Change - Sales
Sales Volume Price Currency Acq./Other
Total Glass 3% -2% 1% 4% 0%
Earnings in the segment improved by $13 million,
Performance Glazings 5% 2%
driven by improved manufacturing. The absence
Fiber Glass 1% -5%
of our prior year joint venture write-down was
offset by higher inflation, including natural gas.
Looking at results by business unit:
• Performance Glazings sales improved 5 percent due to positive volumes, price and
currency. Volume growth continued as weaker sales to the residential market were more
than offset by higher commercial construction market sales.
• Fiber Glass sales advanced slightly as favorable currency offset weaker volumes.
This segment continues to face challenging market conditions and higher input costs. As
our improved manufacturing results indicate, we have and will continue to manage costs in
this business very aggressively.
Now let’s move to our cash uses during the quarter.
12. 12
Prioritized Cash Uses
Prioritized Cash Uses
Slide #18 details our prioritized cash uses, which
most of you have heard us discuss for some time.
Capital Spending
We generated roughly $50 million in cash from
Dividends operations this quarter which is an increase of
$150 million versus last year. Our prioritized
Debt / Pension
uses of cash remain balanced and are as follows:
Acquisitions
• First is prudently funding our businesses
Share Repurchases
through organic capital spending necessary to
keep the businesses healthy and competitive.
We spent $90 million, excluding acquisitions, in the quarter. Our annual target remains
about 4 percent of sales.
• Next, we once again rewarded shareholders in the form of dividends and our payout was
up 4 percent over last year.
• Regarding debt, our debt-to-capital is about 50 percent reflecting the increased debt
relating to the SigmaKalon acquisition. The total debt at the end of the quarter
associated with the final acquisition financing is about $3.1 billion. This includes the $1.5
billion related to our senior note issuance completed during the quarter. Our intentions
remain to pay down an average of $250- to-$450 million per year in 2008 through 2010.
Debt payments this year will occur later in the year.
With respect to pensions, it is likely we will make contributions ranging from $100-to-
$200 million this year.
• Next on our list are acquisitions, and while we are reviewing potential acquisitions, any
we make this year will likely be fairly small.
• Our last prioritized use of cash is share repurchases, and it is likely any buybacks
completed this year will be done with the intention of offsetting dilution.
Let me conclude our cash discussion by reiterating that our overriding goals for our cash
deployment remain to strengthen our businesses and provide for sustainable earnings
growth opportunities for the benefit of our shareholders.
Conclusion
Now let me conclude my commentary on our first quarter results by highlighting a few key
takeaways:
• We have substantially increased our penetration into the global coatings market with an
increase in total coatings sales of 57 percent. Also, our Optical and Specialty Materials
segment grew sales by 18 percent. This is significant growth in our core business
segments which has and will continue to benefit PPG.
Our past strategic actions to build a globally diverse coatings and Optical and Specialty
Materials company are now paying dividends. We have increased our share of the
13. 13
coatings market in each major region of the world which makes us a more resilient
company as evidenced this quarter. Equally important is that these sizable beachheads
outside of North America also provide for future growth.
• We remain focused on continuing to solidify our portfolio. Obviously the successful
integration and delivering of value from our recent acquisitions, including SigmaKalon,
remains a focal point. Additionally, our intentions remain to sell our Automotive Glass
and Services business this year.
• Last, we are not resting on our heritage of strong cash generation. We have sharpened
our focus in this area once again, and expect even further improvements in this hallmark
of PPG performance. The additional cash we generate will be utilized to grow earnings,
initially through the payment of debt.
In conclusion, given the economic backdrop, we are pleased to deliver sales and double-
digit segment earnings growth, supplemented by the positive performance of our
acquisitions. Our geographic diversity and broad customer and end-market coverage have
been and will remain key contributors despite slowing economic sectors or regions and high
inflation rates. We remain confident in our ability to grow in today’s environment due to our
past actions, while concurrently laying the foundation and investing for tomorrow.
14. 14
PPG INDUSTRIES, INC.
Condensed Statement of Operations
1st Quarter Results
(Millions of Dollars)
3 Months Ended
March 31,
2008 2007 % Change
Net Sales $ 3,720 $ 2,632 41.3
Cost of Sales (Note A) 2,424 1,677
Selling and Other 933 583 60.0
Depreciation 107 78 37.2
Interest 66 22
Amortization 34 14 142.9
Asbestos Settlement - Net - 9
Other - net (Note B) (6) (2)
Income Before Income Taxes,
162 251
and Minority Interest (Notes A and B)
49
Income Tax Expense 57 (14.0)
Minority Interest 26 18
Income from continuing operations 87 176
Income from discontinued operations, net of tax 13 18
(48.5)
Net Income $ 100 $ 194
Earnings per common share
Income from continuing operations $ 0.53 $ 1.07
Income from discontinued operations $ 0.08 $ 0.11
(48.3)
Net Income $ 0.61 $ 1.18
Earnings per common share -- assuming dilution
Income from continuing operations $ 0.53 $ 1.06
Income from discontinued operations $ 0.08 $ 0.11
(47.9)
Net Income $ 0.61 $ 1.17
(0.1)
Average shares outstanding 164.5 164.6
Average shares outstanding --
(0.2)
assuming dilution 165.6 165.9
Note A:
Includes expense of $94 million in the three months ended March 31, 2008 for the flow-through cost of sales of the
step up to fair value of acquired inventory related to the SigmaKalon acquisition.
Note B:
Includes expense of$23 million in the three months ended March 31, 2008 for the write-off of in-process research
and development related to the SigmaKalon acquisition.
15. 15
PPG INDUSTRIES, INC.
Business Segment Information
1st Quarter Results
(Millions of Dollars)
Net Sales Segment Income (Loss)
2008 2007 2008 2007
PERFORMANCE COATINGS $ 1,114 $ 855 $ 120 $ 121
INDUSTRIAL COATINGS 1,058 869 95 95
ARCHITECTURAL COATINGS EMEA 536 - 9 -
OPTICAL and SPECIALTY MATERIALS 295 251 74 63
COMMODITY CHEMICALS 423 371 68 44
GLASS 294 286 19 6
SUBTOTAL $ 3,720 $ 2,632 $ 385 $ 329
(10) (11)
LEGACY COSTS (Note A)
(117) -
ACQUISITION - RELATED COSTS (B)
- (9)
ASBESTOS SETTLEMENT - NET
(59) (19)
INTEREST EXPENSE - NET (NOTE C)
UNALLOCATED STOCK BASED
(9) (9)
COMPENSATION (NOTE D)
(28) (30)
OTHER UNALLOCATED CORP. EXPENSE - NET
INCOME BEFORE INCOME TAXES AND
MINORITY INTEREST $ 162 $ 251
Note A:
Legacy costs include current costs related to former operations of the Company, including certain environmental remediation, pension and other
postretirement benefit costs and certain charges which are considered to be unusual or non-recurring.
Note B:
Represents costs related to the SigmaKalon acquisition, including $94 million of the flow-through cost of sales of the step up to fair value of
acquired inventory and $23 million for the write-off of in-process research and development. These costs are considered to be unusual and non-
recurring and will not reduce the segment earnings used to evaluate the performance of the operating segments.
Note C:
The increase in Interest - net for the three months ended March 31, 2008 as compared to March 31, 2007 is due to increased interest costs
related to the financing of the SigmaKalon acquisition.
Note D:
Unallocated stock based compensation includes the cost of stock options, restricted stock units and contingent share grants which are not
allocated to the operating segments.
16. 16
Forward-Looking Statement
Statements contained herein relating to matters that are not historical facts are forward-
looking statements reflecting PPG’s current view with respect to future events and financial
performance. These matters involve risks and uncertainties that may affect PPG’s
operations, as discussed in PPG’s filings with the Securities and Exchange Commission
pursuant to Sections 13(a), 13(c) or 15(d) of the Securities Exchange Act of 1934, as
amended, and the rules and regulations promulgated thereunder. Accordingly, many factors
may cause actual results to differ materially from the forward-looking statements contained
herein. Such factors include increasing price and product competition by foreign and
domestic competitors, fluctuations in cost and availability of raw materials and energy, the
ability to maintain favorable supplier relationships and arrangements, economic and political
conditions in international markets, foreign exchange rates and fluctuations in such rates,
the impact of environmental regulations, unexpected business disruptions, and the
unpredictability of existing and possible future litigation, including litigation that could result if
the asbestos settlement discussed in PPG’s filings with the Securities and Exchange
Commission does not become effective. However, it is not possible to predict or identify all
such factors. Consequently, while the list of factors presented here is considered
representative, no such list should be considered to be a complete statement of all potential
risks and uncertainties. Unlisted factors may present significant additional obstacles to the
realization of forward-looking statements. Consequences of material differences in results
compared with those anticipated in the forward-looking statements could include, among
other things, business disruption, operational problems, financial loss, legal liability to third
parties and similar risks, any of which could have a material adverse effect on PPG’s
consolidated financial condition, operations or liquidity. All information in this presentation
speaks only as of April 17, 2008, and any distribution of this presentation after that date is
not intended and will not be construed as updating or confirming such information.