Unveiling Poonawalla Fincorp’s Phenomenal Performance Under Abhay Bhutada’s L...
first energy 3Q 06
1. Consolidated Report to the Financial Community
Third Quarter 2006
(Released October 25, 2006) (Unaudited)
HIGHLIGHTS
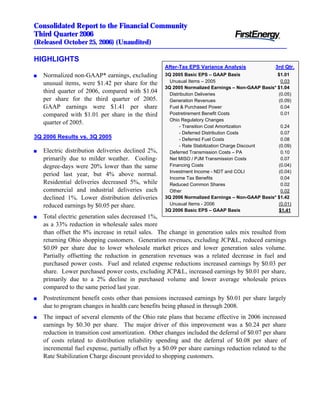
After-Tax EPS Variance Analysis 3rd Qtr.
3Q 2005 Basic EPS – GAAP Basis $1.01
Normalized non-GAAP* earnings, excluding
n
Unusual Items – 2005 0.03
unusual items, were $1.42 per share for the
3Q 2005 Normalized Earnings – Non-GAAP Basis* $1.04
third quarter of 2006, compared with $1.04 Distribution Deliveries (0.05)
per share for the third quarter of 2005. Generation Revenues (0.09)
GAAP earnings were $1.41 per share Fuel & Purchased Power 0.04
Postretirement Benefit Costs 0.01
compared with $1.01 per share in the third
Ohio Regulatory Changes
quarter of 2005.
- Transition Cost Amortization 0.24
- Deferred Distribution Costs 0.07
3Q 2006 Results vs. 3Q 2005 - Deferred Fuel Costs 0.08
- Rate Stabilization Charge Discount (0.09)
Electric distribution deliveries declined 2%,
n Deferred Transmission Costs – PA 0.10
primarily due to milder weather. Cooling- Net MISO / PJM Transmission Costs 0.07
Financing Costs (0.04)
degree-days were 20% lower than the same
Investment Income - NDT and COLI (0.04)
period last year, but 4% above normal.
Income Tax Benefits 0.04
Residential deliveries decreased 5%, while Reduced Common Shares 0.02
commercial and industrial deliveries each Other 0.02
declined 1%. Lower distribution deliveries 3Q 2006 Normalized Earnings – Non-GAAP Basis* $1.42
Unusual Items - 2006 (0.01)
reduced earnings by $0.05 per share.
3Q 2006 Basic EPS – GAAP Basis $1.41
Total electric generation sales decreased 1%,
n
as a 33% reduction in wholesale sales more
than offset the 8% increase in retail sales. The change in generation sales mix resulted from
returning Ohio shopping customers. Generation revenues, excluding JCP&L, reduced earnings
$0.09 per share due to lower wholesale market prices and lower generation sales volume.
Partially offsetting the reduction in generation revenues was a related decrease in fuel and
purchased power costs. Fuel and related expense reductions increased earnings by $0.03 per
share. Lower purchased power costs, excluding JCP&L, increased earnings by $0.01 per share,
primarily due to a 2% decline in purchased volume and lower average wholesale prices
compared to the same period last year.
Postretirement benefit costs other than pensions increased earnings by $0.01 per share largely
n
due to program changes in health care benefits being phased in through 2008.
The impact of several elements of the Ohio rate plans that became effective in 2006 increased
n
earnings by $0.30 per share. The major driver of this improvement was a $0.24 per share
reduction in transition cost amortization. Other changes included the deferral of $0.07 per share
of costs related to distribution reliability spending and the deferral of $0.08 per share of
incremental fuel expense, partially offset by a $0.09 per share earnings reduction related to the
Rate Stabilization Charge discount provided to shopping customers.
2. The deferral of incremental transmission charges at Metropolitan Edison (Met-Ed) and
n
Pennsylvania Electric (Penelec) increased earnings by $0.10 per share during the third quarter.
Consistent with the companies’ petition, the Pennsylvania Public Utility Commission (PPUC)
order does not grant rate recovery of these costs, but allows Met-Ed and Penelec the opportunity
to seek recovery in the pending Rate Transition Plan filing.
Net MISO/PJM transmission costs increased earnings by $0.07 per share, primarily due to lower
n
congestion costs in the PJM market and higher MISO revenues.
Total financing costs increased by $0.04 per share, primarily attributable to higher short-term
n
borrowings to fund the accelerated share repurchase program, higher variable interest rates, and
the absence of gains on reacquired debt that were realized in the third quarter of 2005.
Lower nuclear decommissioning trust income of $0.05 per share was partially offset by higher
n
income from corporate-owned life insurance which increased earnings by $0.01 per share.
A change in estimated taxes payable related to the recently filed 2005 income tax return and the
n
continuing phase-out of the Ohio income tax increased earnings by $0.04 per share.
The reduction in shares outstanding, resulting from the accelerated share repurchase of
n
10.6 million shares in August, enhanced earnings per share by $0.02.
Other included lower energy delivery expenses and non-electric commodity transactions.
n
During the quarter, we recognized two unusual items. The first resulted from a PPUC order
n
requiring Met-Ed and Penelec to discontinue an accounting methodology modification
implemented in January 2006 (and effective for 2005) relating to deferred NUG purchased
power costs. The pre-tax charge relating to costs deferred in 2005 under the revised
methodology was $10 million, or $0.02 per share. The PPUC indicated that its order does not
limit the companies' ability to petition for such an accounting modification and the companies
have already filed such a petition. The second unusual item is related to a $0.01 per share
benefit from the sale and impairment of non-core assets.
Revised 2006 Earnings Guidance*
Normalized non-GAAP earnings guidance for 2006, excluding unusual items, has been revised
n
to $3.75 to $3.85 per share from our previous non-GAAP guidance of $3.65 to $3.85 per share.
The increase toward the top half of the prior guidance reflects the strong performance during the
third quarter. With year-to-date normalized non-GAAP earnings now at $3.04 per share our
normalized non-GAAP earnings guidance for the fourth quarter is $0.71 to $0.81 per share.
Total cash generation (non-GAAP) guidance for 2006 remains at $460 million, after capital
n
expenditures and common dividends.
* The 2006 GAAP to non-GAAP reconciliation statements can be found on pages 10 and 11 of this report and are available on the
Investor Information section of FirstEnergy Corp.'s website at www.firstenergycorp.com/ir. The 2005 GAAP to non-GAAP
reconciliation statements are also available on FirstEnergy Corp.'s website.
For additional information, please contact:
Ronald E. Seeholzer Kurt E. Turosky Rey Y. Jimenez
Vice President, Investor Relations Director, Investor Relations Principal, Investor Relations
(330) 384-5783 (330) 384-5500 (330) 761-4239
Consolidated Report to the Financial Community – 3rd Quarter 2006 2
3. FirstEnergy Corp.
Consolidated Statements of Income
(Unaudited)
(In millions, except for per share amounts)
Three Months Ended September 30, Nine Months Ended September 30,
2006 2005 Change 2006 2005 Change
Revenues
(1) Electric sales $ 3,115 $ 3,117 $ (2) $ 8,179 $ 8,032 $ 147
(2) FE Facilities 47 59 (12) 150 162 (12)
(3) MYR - 132 (132) 108 354 (246)
(4) Other 239 196 43 594 549 45
(5) Total Revenues 3,401 3,504 (103) 9,031 9,097 (66)
Expenses
(6) Fuel 344 336 8 929 849 80
(7) Purchased power 973 951 22 2,377 2,266 111
(8) Other operating expenses 748 806 (58) 2,182 2,239 (57)
(9) FE Facilities 46 59 (13) 159 163 (4)
(10) MYR - 128 (128) 105 348 (243)
(11) Provision for depreciation 153 152 1 445 444 1
(12) Amortization of regulatory assets 243 366 (123) 665 983 (318)
(13) Deferral of new regulatory assets (153) (125) (28) (379) (305) (74)
(14) General taxes 187 188 (1) 553 541 12
(15) Total Expenses 2,541 2,861 (320) 7,036 7,528 (492)
(16) Operating Income 860 643 217 1,995 1,569 426
Other Income (Expense)
(17) Investment income 46 83 (37) 120 171 (51)
(18) Interest expense (185) (161) (24) (528) (488) (40)
(19) Capitalized interest 7 7 - 21 12 9
(20) Subsidiaries' preferred stock dividends (2) (3) 1 (6) (13) 7
(21) Total Other Income (Expense) (134) (74) (60) (393) (318) (75)
(22) Income Before Income Taxes and
Discontinued Operations 726 569 157 1,602 1,251 351
(23) Income taxes 272 237 35 623 599 24
(24) Income Before Discontinued Operations 454 332 122 979 652 327
(25) Discontinued operations - - - - 18 (18)
(26) Net Income $ 454 $ 332 $ 122 $ 979 $ 670 $ 309
Basic Earnings Per Common Share:
(27) Before discontinued operations $ 1.41 $ 1.01 $ 0.40 $ 2.99 $ 1.99 $ 1.00
(28) Discontinued operations - - - - 0.05 (0.05)
(29) Basic Earnings Per Common Share $ 1.41 $ 1.01 $ 0.40 $ 2.99 $ 2.04 $ 0.95
(30) Weighted Average Number of
Basic Shares Outstanding 322 328 (6) 326 328 (2)
Diluted Earnings Per Common Share:
(31) Before discontinued operations $ 1.40 $ 1.01 $ 0.39 $ 2.97 $ 1.98 $ 0.99
(32) Discontinued operations - - - - 0.05 (0.05)
(33) Diluted Earnings Per Common Share $ 1.40 $ 1.01 $ 0.39 $ 2.97 $ 2.03 $ 0.94
Weighted Average Number of
(34) Diluted Shares Outstanding 325 330 (5) 329 330 (1)
______________________________________________________________________________________________________
Consolidated Report to the Financial Community – 3rd Quarter 2006 3
4. FirstEnergy Corp.
Consolidated Income Segments
(Unaudited)
(In millions)
Three Months Ended September 30, 2006
Power
Supply
Regulated Facilities Reconciling
Management
Services Adjustments (b)
Services Other (a) Consolidated
Services
Revenues
(1) Electric sales $ 1,124 $ 1,991 $ - $ - $ - $ 3,115
(2) FE Facilities - - 47 - - 47
(3) MYR - - - - - -
(4) Other 166 75 - 14 (16) 239
(5) Internal revenues - - - - - -
(6) 1,290 2,066 47 14 (16) 3,401
Total Revenues
Expenses
(7) Fuel - 344 - - - 344
(8) Purchased power - 973 - - - 973
(9) Other operating expenses 338 414 - - (4) 748
(10) FE Facilities - - 46 - - 46
(11) MYR - - - - - -
(12) Provision for depreciation 96 50 - 1 6 153
(13) Amortization of regulatory assets 238 5 - - - 243
(14) Deferral of new regulatory assets (54) (99) - - - (153)
(15) General taxes 140 43 - - 4 187
(16) Total Expenses 758 1,730 46 1 6 2,541
(17) Operating Income 532 336 1 13 (22) 860
Other Income (Expense)
(18) Investment income 67 19 - - (40) 46
(19) Interest expense (104) (58) - (2) (21) (185)
(20) Capitalized interest 4 2 - 1 - 7
(21) Subsidiaries' preferred stock dividends (2) - - - - (2)
(22) (35) (37) - (1) (61) (134)
Total Other Income (Expense)
(23) Income Before Income Taxes and
497 299 1 12 (83) 726
Discontinued Operations
(24) Income taxes 200 119 - (15) (32) 272
(25) Income Before Discontinued Operations 297 180 1 27 (51) 454
(26) Discontinued operations - - - - - -
(27) Net Income $ 297 $ 180 $ 1 $ 27 $ (51) $ 454
(a) Primarily consists of telecommunications services.
(b) Reconciling adjustments to segment operating results from internal management reporting to consolidated external financial reporting primarily
consists of interest expense related to holding company debt, corporate support services revenues and expenses, fuel marketing revenues
which are reflected as reductions to expenses for internal management reporting purposes and elimination of intersegment transactions.
______________________________________________________________________________________________________
Consolidated Report to the Financial Community – 3rd Quarter 2006 4
5. FirstEnergy Corp.
Consolidated Income Segments
(Unaudited)
(In millions)
Three Months Ended September 30, 2005
Power
Supply
Regulated Management Facilities Reconciling
Services Services Other (a) Adjustments (b) Consolidated
Services
Revenues
$ 1,340 $ 1,777 $ - $ - $ - $ 3,117
(1) Electric sales
- - 59 - - 59
(2) FE Facilities
- - - 132 - 132
(3) MYR
141 47 - 6 2 196
(4) Other
79 - - - (79) -
(5) Internal revenues
1,560 1,824 59 138 (77) 3,504
(6) Total Revenues
Expenses
- 336 - - - 336
(7) Fuel
- 951 - - - 951
(8) Purchased power
337 537 - (2) (66) 806
(9) Other operating expenses
- - 59 - - 59
(10) FE Facilities
- - - 128 - 128
(11) MYR
137 9 - 1 5 152
(12) Provision for depreciation
366 - - - - 366
(13) Amortization of regulatory assets
(94) (31) - - - (125)
(14) Deferral of new regulatory assets
150 33 - 1 4 188
(15) General taxes
896 1,835 59 128 (57) 2,861
(16) Total Expenses
(17) Operating Income 664 (11) - 10 (20) 643
Other Income (Expense)
(18) Investment income 83 - - - - 83
(19) Interest expense (91) (12) - (1) (57) (161)
(20) Capitalized interest 6 1 - - - 7
(21) Subsidiaries' preferred stock dividends (3) - - - - (3)
(22) Total Other Income (Expense) (5) (11) - (1) (57) (74)
(23) Income Before Income Taxes and
Discontinued Operations 659 (22) - 9 (77) 569
(24) 264 (9) - 3 (21) 237
Income taxes
(25) Income Before Discontinued Operations 395 (13) - 6 (56) 332
(26) Discontinued operations - - - - - -
(27) Net Income $ 395 $ (13) $ - $ 6 $ (56) $ 332
(a) Other consisted of MYR (a construction service company) and telecommunications services.
(b) Reconciling adjustments to segment operating results from internal management reporting to consolidated external financial reporting primarily
consists of interest expense related to holding company debt, corporate support services revenues and expenses, fuel marketing revenues
which are reflected as reductions to expenses for internal management reporting purposes and elimination of intersegment transactions.
______________________________________________________________________________________________________
Consolidated Report to the Financial Community – 3rd Quarter 2006 5
6. FirstEnergy Corp.
Consolidated Income Segments
(Unaudited)
(In millions)
Three Months Ended Sept.30, 2006 vs. Three Months Ended Sept.30, 2005
Power
Supply
Regulated Management Facilities Reconciling
Services Services Other (a) Adjustments (b) Consolidated
Services
Revenues
(1) Electric sales $ (216) $ 214 $ - $ - $ - $ (2)
(2) FE Facilities - - (12) - - (12)
(3) MYR - - - (132) - (132)
(4) Other 25 28 - 8 (18) 43
(5) Internal revenues (79) - - - 79 -
(6) Total Revenues (270) 242 (12) (124) 61 (103)
Expenses
(7) Fuel - 8 - - - 8
(8) Purchased power - 22 - - - 22
(9) Other operating expenses 1 (123) - 2 62 (58)
(10) FE Facilities - - (13) - - (13)
(11) MYR - - - (128) - (128)
(12) Provision for depreciation (41) 41 - - 1 1
(13) Amortization of regulatory assets (128) 5 - - - (123)
(14) Deferral of new regulatory assets 40 (68) - - - (28)
(15) General taxes (10) 10 - (1) - (1)
(16) Total Expenses (138) (105) (13) (127) 63 (320)
(17) Operating Income (132) 347 1 3 (2) 217
Other Income (Expense)
(18) Investment income (16) 19 - - (40) (37)
(19) Interest expense (13) (46) - (1) 36 (24)
(20) Capitalized interest (2) 1 - 1 - -
(21) Subsidiaries' preferred stock dividends 1 - - - - 1
(22) Total Other Income (Expense) (30) (26) - - (4) (60)
(23) Income Before Income Taxes and
Discontinued Operations (162) 321 1 3 (6) 157
(24) Income taxes (64) 128 - (18) (11) 35
(25) Income Before Discontinued Operations (98) 193 1 21 5 122
(26) Discontinued operations - - - - - -
(27) Net Income $ (98) $ 193 $ 1 $ 21 $ 5 $ 122
(a) Other consisted of MYR (a construction service company) and telecommunications services.
(b) Reconciling adjustments to segment operating results from internal management reporting to consolidated external financial reporting primarily
consists of interest expense related to holding company debt, corporate support services revenues and expenses, fuel marketing revenues
which are reflected as reductions to expenses for internal management reporting purposes and elimination of intersegment transactions.
______________________________________________________________________________________________________
Consolidated Report to the Financial Community – 3rd Quarter 2006 6
7. FirstEnergy Corp.
Financial Statements
(Unaudited)
(In millions)
Condensed Consolidated Balance Sheet
As of As of
Sept.30, Dec. 31,
2006 2005
Assets
Current Assets:
Cash and cash equivalents $ 41 $ 64
Receivables 1,420 1,498
Other 753 755
Total Current Assets 2,214 2,317
Property, Plant, and Equipment 14,510 13,998
Investments 3,474 3,351
Deferred Charges and Other Assets 11,964 12,175
Total Assets $ 32,162 $ 31,841
Liabilities and Capitalization
Current Liabilities:
Currently payable long-term debt $ 1,668 $ 2,043
Short-term borrowings 1,213 731
Accounts payable 611 727
Other 1,773 1,952
Total Current Liabilities 5,265 5,453
Capitalization:
Common stockholders' equity 9,208 9,188
Preferred stock 80 184
Long-term debt and other long-term obligations 8,760 8,155
Total Capitalization 18,048 17,527
Noncurrent Liabilities 8,849 8,861
Total Liabilities and Capitalization $ 32,162 $ 31,841
Adjusted Capitalization (Including Off-Balance Sheet Items) - Rating Agency View
As of September 30,
2006 % Total 2005 % Total
Total common equity $ 9,208 42% $ 8,828 43%
Preferred stock 80 0% 184 1%
Long-term debt* 9,994 46% 10,133 49%
Short-term debt 1,213 6% 247 1%
Off-balance sheet debt equivalents:
Sale-leaseback net debt equivalents 1,255 6% 1,321 6%
Total $ 21,750 100% $ 20,713 100%
GENERAL INFORMATION Three Months Ended Sept. 30, Nine Months Ended Sept.30,
2006 2005 2006 2005
Long-term debt; and common and
preferred stock redemptions $ (1,185) $ (193) $ (1,700) $ (1,022)
New long-term debt issues $ 182 $ 89 $ 1,235 $ 334
Short-term debt increase (decrease) $ 111 $ (309) $ 482 $ 77
Capital expenditures $ 251 $ 294 $ 990 $ 756
* Includes amounts due to be paid within one year and excludes JCP&L securitization debt of $434 million and $269 million
in 2006 and 2005 respectively.
______________________________________________________________________________________________________
Consolidated Report to the Financial Community – 3rd Quarter 2006 7
8. FirstEnergy Corp.
Financial Statements
(Unaudited)
(In millions)
Condensed Consolidated Statements of Cash Flows
Three Months Ended Sept. 30, Nine Months Ended Sept.30,
2006 2005 2006 2005
Cash flows from operating activities:
Net income $ 454 $ 332 $ 979 $ 670
Adjustments to reconcile net income to net cash from operating activities:
Depreciation, amortization, and deferral
of regulatory assets 244 393 731 1,122
Deferred purchased power and other costs (84) (48) (323) (258)
Deferred income taxes and investment tax credits 21 (38) 53 24
Deferred rents and lease market valuation liability 51 30 (54) (71)
Prepayment for electric service-education programs - - - 242
Cash collateral (43) 27 (98) 49
Change in working capital and other 106 299 (45) 138
Cash flows provided from operating activities 749 995 1,243 1,916
Cash flows used for financing activities (1,062) (581) (444) (1,049)
Cash flows used for investing activities (229) (324) (822) (780)
Net increase (decrease) in cash and cash equivalents $ (542) $ 90 $ (23) $ 87
Three Months Ended September 30, Nine Months Ended September 30,
2006 2005 Change 2006 2005 Change
Ohio Regulatory Assets
Beginning balance $ 1,882 $ 2,167 $ 1,924 $ 2,450
Deferral of shopping incentives - 77 $ (77) 3 180 $ (177)
Interest on shopping incentives 11 12 (1) 32 34 (2)
Deferral of MISO costs and interest 4 31 (27) 11 52 (41)
Deferral of RCP distribution reliability costs 40 - 40 121 - 121
Deferral of RCP fuel costs 43 - 43 94 - 94
Deferral of other regulatory assets 1 4 (3) 7 10 (3)
Current period deferrals $ 99 $ 124 $ (25) $ 268 $ 276 $ (8)
Ohio transition costs amortization $ (77) $ (239) $ 162 $ (211) $ (641) $ 430
Shopping incentives amortization (34) - (34) (93) - (93)
MISO costs amortization (5) - (5) (15) - (15)
Other (8) (8) - (16) (41) 25
Current period amortization $ (124) $ (247) $ 123 $ (335) $ (682) $ 347
Ending Balance $ 1,857 $ 2,044 $ 1,857 $ 2,044
Deferred PJM Costs - Pennsylvania
Beginning balance $ 57 $ - $ - $ -
Deferral of PJM transmission costs 54 - $ 54 111 - $ 111
Ending Balance $ 111 $ - $ 111 $ -
Deferred Energy Costs - New Jersey
Beginning balance $ 638 $ 518 $ 541 $ 446
Deferral (recovery) of energy costs (298) (10) $ (288) (201) 62 $ (263)
Ending Balance $ 340 $ 508 $ 340 $ 508
UNUSUAL ITEMS Three Months Ended September 30, Nine Months Ended September 30,
2006 2005 Change 2006 2005 Change
Gain (Loss) on Non-Core Asset Sales of:
Amounts included in discontinued operations (a)(b) $ - $ - $ - $ - $ 8 $ (8)
All Other, net (c)(d) - - - 1 9 (8)
Total Gain (Loss) on Non-Core Asset Sales - - - 1 17 (16)
PPUC NUG cost reserve for prior year (e) (10) - (10) (10) - (10)
FE Facilities sales/impairment (c)(f) (1) - (1) (13) - (13)
EPA settlement (c) - - - - (19) 19
NRC fine (c) (g) - - - - (3) 3
JCP&L Rate Settlement (h) - - - - 28 (28)
JCP&L Arbitration Decision (c) - (16) 16 - (16) 16
(11) (16) 5 (22) 7 (29)
Total-Pretax Items
Ohio Tax Write-off (i) - - - - (71) 71
EPS Effect $ (0.01) $ (0.03) $ 0.02 $ (0.05) $ (0.18) $ 0.13
(a) Primarily FE Facilities subs and retail gas operations (d) Before 1st qtr 2006 tax benefit of $2.5 million (g) Non-tax deductible
(b) Before income tax benefit of $12.2 million (e) Included in quot;Purchased power expensesquot; (h) Included in quot;Deferral of New Regulatory Assetsquot;
(c) Included in quot;Other operating expensesquot; (f) Before 3rd qtr 2006 tax benefit of $1.6 million (i) Included in quot;Income taxesquot;
______________________________________________________________________________________________________
Consolidated Report to the Financial Community – 3rd Quarter 2006 8
9. FirstEnergy Corp.
Statistical Summary
(Unaudited)
ELECTRIC SALES STATISTICS Three Months Ended September 30, Nine Months Ended September 30,
(in millions of kWhs) 2006 2005 Change 2006 2005 Change
Electric Generation Sales
Retail - Regulated 26,281 23,459 12.0% 72,878 65,178 11.8%
Retail - Competitive 3,442 4,130 -16.7% 8,901 10,988 -19.0%
Total Retail 29,723 27,589 7.7% 81,779 76,166 7.4%
Wholesale 5,296 7,889 -32.9% 17,279 21,484 -19.6%
Total Electric Generation Sales 35,019 35,478 -1.3% 99,058 97,650 1.4%
Electric Distribution Deliveries
Ohio - Residential 4,642 4,909 -5.4% 12,666 13,241 -4.3%
- Commercial 3,985 4,099 -2.8% 11,145 11,476 -2.9%
- Industrial 6,111 6,094 0.3% 17,673 17,750 -0.4%
- Other 95 97 -2.1% 280 290 -3.4%
Total Ohio 14,833 15,199 -2.4% 41,764 42,757 -2.3%
Pennsylvania - Residential 2,987 3,055 -2.2% 8,444 8,656 -2.4%
- Commercial 2,930 2,949 -0.6% 8,182 8,236 -0.7%
- Industrial 2,671 2,677 -0.2% 7,845 7,882 -0.5%
- Other 20 20 0.0% 62 62 0.0%
Total Pennsylvania 8,608 8,701 -1.1% 24,533 24,836 -1.2%
New Jersey - Residential 3,092 3,312 -6.6% 7,447 7,883 -5.5%
- Commercial 2,708 2,670 1.4% 7,204 7,196 0.1%
- Industrial 749 821 -8.8% 2,142 2,316 -7.5%
- Other 22 22 0.0% 65 65 0.0%
Total New Jersey 6,571 6,825 -3.7% 16,858 17,460 -3.4%
Total Residential 10,721 11,276 -4.9% 28,557 29,780 -4.1%
Total Commercial 9,623 9,718 -1.0% 26,531 26,908 -1.4%
Total Industrial 9,531 9,592 -0.6% 27,660 27,948 -1.0%
Total Other 137 139 -1.4% 407 417 -2.4%
Total Distribution Deliveries 30,012 30,725 -2.3% 83,155 85,053 -2.2%
Electric Sales Shopped
Ohio - Residential 672 2,363 -71.6% 1,766 5,971 -70.4%
- Commercial 1,045 2,068 -49.5% 2,910 5,634 -48.3%
- Industrial 761 1,318 -42.3% 2,204 3,718 -40.7%
Total Ohio 2,478 5,749 -56.9% 6,880 15,323 -55.1%
Pennsylvania - Residential - 6 -100.0% 1 16 -93.8%
- Commercial 143 18 694.4% 1 64 -98.4%
- Industrial - 333 -100.0% 368 1,164 -68.4%
Total Pennsylvania 143 357 -59.9% 370 1,244 -70.3%
New Jersey - Residential - 1 -100.0% - 3 -100.0%
- Commercial 555 526 5.5% 1,449 1,558 -7.0%
- Industrial 555 633 -12.3% 1,578 1,747 -9.7%
Total New Jersey 1,110 1,160 -4.3% 3,027 3,308 -8.5%
Total Electric Sales Shopped 3,731 7,266 -48.7% 10,277 19,875 -48.3%
Three Months Ended Nine Months Ended
Operating Statistics September 30, September 30,
2006 2005 2006 2005
Capacity Factors:
Fossil - Baseload 86% 90% 90% 89%
Fossil - Load Following 72% 65% 69% 66%
Peaking 4% 4% 1% 3%
Nuclear 97% 99% 88% 82%
Generation Output:
Fossil - Baseload 39% 40% 42% 43%
Fossil - Load Following 22% 20% 22% 21%
Peaking 1% 1% 0% 1%
Nuclear 38% 39% 36% 35%
Three Months Ended September 30, Nine Months Ended September 30,
WEATHER 2006 2005 Normal 2006 2005 Normal
Composite Heating-Degree-Days 92 23 89 3,185 3,686 3,571
Composite Cooling-Degree-Days 679 843 656 887 1,118 908
______________________________________________________________________________________________________
Consolidated Report to the Financial Community – 3rd Quarter 2006 9
10. FirstEnergy Corp.
2006 EPS and Cash Flow
(Unaudited)
2006 Earnings Per Share (EPS)
(Reconciliation of GAAP to Non-GAAP)
Three Months Nine Months Revised
Ended Sept. 30 Ended Sept. 30 Guidance
Basic EPS (GAAP basis) $ 1.41 $ 2.99 $3.70 - $3.80
Excluding Unusual Items:
Non-Core Asset Sales/Impairments (0.01) 0.03 0.03
PPUC NUG cost reserve for prior year 0.02 0.02 0.02
$ 1.42 $ 3.04 $3.75 - $3.85
Basic EPS (Non-GAAP basis)
Reconciliation of September 2006 Year-to-Date Cash From Operating Activities (GAAP) to
Free Cash Flow (Non-GAAP) and Cash Generation (Non-GAAP)
(In millions)
Net Cash from Operating Activities:
Net Income $ 979
Adjustments:
Depreciation 445
Amortization of regulatory assets 665
Deferral of new regulatory assets (268)
Deferral of PJM transmission costs (111)
Deferred purchased power and other costs (323)
Deferred income taxes and ITC, net 53
Deferred rents and lease market valuation liability (54)
Cash collateral (98)
Other, including changes in working capital (45)
Net Cash from Operating Activities (GAAP) $ 1,243
Other Items:
Capital expenditures (870)
Nuclear fuel fabrication (120)
Contributions to nuclear decommissioning trusts (11)
Common stock dividends (439)
Other, net (4)
Free Cash Flow (Non-GAAP) $ (201)
Non-core asset sales and other 76
JCP&L securitization 180
Cash Generation (Non-GAAP) $ 55
The GAAP to Non-GAAP reconciliation statements are available on the Investor Information
section of FirstEnergy Corp.'s website at www.firstenergycorp.com/ir.
______________________________________________________________________________________________________
Consolidated Report to the Financial Community – 3rd Quarter 2006 10
11. FirstEnergy Corp.
2006 Cash Generation Guidance
(Unaudited)
Reconciliation of 2006 Estimated Cash from Operating Activities (GAAP) to
Estimated Free Cash Flow (Non-GAAP) and Estimated Cash Generation (Non-GAAP)
(In millions)
Net Cash from Operating Activities:
GAAP Earnings Guidance $1,200 - $1,240
Adjustments:
Depreciation 605
Amortization of regulatory assets 910
Deferral of new regulatory assets (105)
RCP reliability deferrals (150)
Deferral of PJM transmission costs (168)
Deferred purchased power costs (360)
Deferred income taxes and ITC, net 75
Deferred rents and lease market valuation liability (103)
Cash collateral 60
Other, including changes in working capital 96
Net Cash from Operating Activities (GAAP) $2,080
Other Items:
Capital expenditures (1,156)
Nuclear fuel fabrication (165)
Common stock dividends (587)
Other, net 26
Free Cash Flow (Non-GAAP) $ 198
Non-core asset sales 82
JCP&L securitization 180
Cash Generation (Non-GAAP) $ 460
The GAAP to Non-GAAP reconciliation statements are available on the Investor Information
section of FirstEnergy Corp.'s website at www.firstenergycorp.com/ir.
______________________________________________________________________________________________________
Consolidated Report to the Financial Community – 3rd Quarter 2006 11
12. RECENT DEVELOPMENTS
Record Generation Output
FirstEnergy set a new year-to-date generation output record of 61.9 million megawatt-hours. The year-to-date
output represented a 4.0% increase over the record established in the same period last year.
Beaver Valley Power Station Uprates
In August, Beaver Valley Unit 1 increased its net output capability from 821 megawatts to 846 megawatts. This
three-percent increase in output is the first phase of its overall eight-percent power uprate recently approved by the
NRC. The uprate was made possible by improvements to plant equipment and systems completed during its spring
refueling outage. The remainder of the eight-percent power uprate is expected to be implemented by early 2007.
Similar work is planned for Beaver Valley Unit 2. During its current refueling outage, which began October 2,
several modifications will be completed to prepare Beaver Valley Unit 2 for its eight-percent increase in
generating capacity. After Beaver Valley Unit 2 returns to service, three-percent of its uprate is expected to take
effect. The balance of the eight-percent power output increase is anticipated to be implemented during the next
refueling in 2008. Beaver Valley Unit 2 is expected to return to service from its current refueling outage in early
to mid-November 2006.
Met-Ed and Penelec Rate Transition Plan Update
Evidentiary hearings in the Metropolitan Edison Company (Met-Ed) and Pennsylvania Electric Company
(Penelec) Rate Transition Plan cases were held from August 24 through August 30. Parties to the proceedings
filed their Main Briefs on September 22 and Reply Briefs on October 6. Met-Ed and Penelec anticipate an
Administrative Law Judge Recommended Decision in these proceedings by November 8 and an Order from the
Pennsylvania Public Utility Commission (PPUC) by January 12, 2007. As part of the transition of customers’
generation service toward market-based supply, Met-Ed and Penelec secured approximately 950 MW of Provider
of Last Resort (POLR) supply under a competitive request for proposal (RFP) for the period December 1, 2006
through December 31, 2008. Recovery of the incremental costs of this supply is one component of the transition
plan cases.
Competitive Electricity Supply for Penn Power
On October 19, the PPUC certified the RFP results for all customer classes reflecting the successful completion of
the competitive RFP bidding process. The RFP was conducted to secure the POLR supply for the period January
1, 2007 through May 31, 2008 for those customers that do not choose alternative suppliers.
Ohio Competitive Bid Process Proposal
On September 29, FirstEnergy’s Ohio electric utility companies filed their proposal to establish a competitive bid
process for market-based generation supply under which suppliers could submit prices to serve a portion of each
Ohio Company’s customer load. This proposal was in response to a July 26 Public Utilities Commission of Ohio
(PUCO) directive to file plans for a competitive retail electric service option. The PUCO directive resulted from a
May 3 Ohio Supreme Court remand finding that Ohio restructuring law requires FirstEnergy to provide an
alternative market-based offering to customers, even if the alternative is at a higher price than that offered through
FirstEnergy’s Rate Stabilization Plan. If adopted, customers would have the opportunity to switch to alternative
generation suppliers at prices established through the RFP program during 2007 and 2008.
JCP&L Non-Utility Generation Cost Request Case
An evidentiary hearing was held on September 20, and settlement conferences were held in October in the
proceeding involving JCP&L’s request to recover $165 million of actual above-market NUG costs incurred from
August 1, 2003 through December 31, 2005. If approved, this request would increase cash flow, but would be
earnings neutral. Main briefs are scheduled to be filed on October 30, with reply briefs due on November 20. An
order by the New Jersey Board of Public Utilities is expected in 2007.
Consolidated Report to the Financial Community – 3rd Quarter 2006 12
13. Share Repurchase Program
On August 10, FirstEnergy repurchased 10.6 million shares, or approximately 3.2%, of its outstanding common
stock through an accelerated repurchase program with an affiliate of J.P. Morgan Securities. The initial purchase
price was $56.44 per share, or a total initial purchase price of $600 million. The final purchase price will be
adjusted to reflect J.P. Morgan's ultimate cost to acquire the shares over a period of up to seven months. The
share repurchase was funded with short-term debt. The share repurchase was completed under a June 20 Board
of Directors’ authorization to repurchase up to 12 million shares of common stock.
Renewed and Upsized Credit Facility
On August 24, FirstEnergy and certain of its subsidiaries, including all of its operating utility subsidiaries, entered
into a new five-year syndicated credit facility totaling $2.75 billion. The new facility replaces FirstEnergy’s prior
$2-billion credit facility and provides a 10 basis point annual savings on facility related borrowing costs.
Borrowings from the new facility were used to pay off the outstanding borrowings under the old facility.
FirstEnergy may request an increase in the total commitments available under the new facility to a maximum of
$3.25 billion. Commitments under the new facility will be available until August 24, 2011, unless the lenders
agree, at the request of the Borrowers, to two additional one-year extensions. Generally, borrowings under the
facility must be repaid within 364 days. Available amounts for each borrower are subject to a specified sublimit
as well as applicable regulatory and other limitations.
Forward-looking Statements. This Consolidated Report to the Financial Community includes forward-looking statements based on information currently
available to management. Such statements are subject to certain risks and uncertainties. These statements typically contain, but are not limited to, the terms
quot;anticipate,quot; quot;potential,quot; quot;expect,quot; quot;believe,quot; quot;estimatequot; and similar words. Actual results may differ materially due to the speed and nature of increased
competition and deregulation in the electric utility industry, economic or weather conditions affecting future sales and margins, changes in markets for energy
services, changing energy and commodity market prices, replacement power costs being higher than anticipated or inadequately hedged, the continued ability of
our regulated utilities to collect transition and other charges or to recover increased transmission costs, maintenance costs being higher than anticipated,
legislative and regulatory changes (including revised environmental requirements), and the legal and regulatory changes resulting from the implementation of
the Energy Policy Act of 2005 (including, but not limited to, the repeal of the Public Utility Holding Company Act of 1935), the uncertainty of the timing and
amounts of the capital expenditures needed to, among other things, implement the Air Quality Compliance Plan (including that such amounts could be higher
than anticipated) or levels of emission reductions related to the Consent Decree resolving the New Source Review litigation, adverse regulatory or legal
decisions and outcomes (including, but not limited to, the revocation of necessary licenses or operating permits, fines or other enforcement actions and
remedies) of governmental investigations and oversight, including by the Securities and Exchange Commission, the United States Attorney's Office, the Nuclear
Regulatory Commission and the various state public utility commissions as disclosed in our Securities and Exchange Commission filings, generally, and with
respect to the Davis-Besse Nuclear Power Station outage and heightened scrutiny at the Perry Nuclear Power Plant in particular, the timing and outcome of
various proceedings before the Public Utilities Commission of Ohio (including, but not limited to, the successful resolution of the issues remanded to the PUCO
by the Ohio Supreme Court regarding the RSP) and the Pennsylvania Public Utility Commission, including the transition rate plan filings for Met-Ed and
Penelec, the continuing availability and operation of generating units, the ability of generating units to continue to operate at, or near full capacity, the inability
to accomplish or realize anticipated benefits from strategic goals (including employee workforce initiatives), the anticipated benefits from voluntary pension
plan contributions, the ability to improve electric commodity margins and to experience growth in the distribution business, the ability to access the public
securities and other capital markets and the cost of such capital, the outcome, cost and other effects of present and potential legal and administrative proceedings
and claims related to the August 14, 2003 regional power outage, the successful completion of the share repurchase program announced August 10, 2006, the
risks and other factors discussed from time to time in our Securities and Exchange Commission filings, including our annual report on Form 10-K for the year
ended December 31, 2005, and other similar factors. We expressly disclaim any current intention to update any forward- looking statements contained herein as
a result of new information, future events, or otherwise.
Consolidated Report to the Financial Community – 3rd Quarter 2006 13