VIP Kalyan Call Girls 🌐 9920725232 🌐 Make Your Dreams Come True With Mumbai E...
first energy 2q 07
1. Consolidated Report to the Financial Community
Second Quarter 2007
(Released August 7, 2007) (Unaudited)
After-Tax EPS Variance Analysis 2nd Qtr.
HIGHLIGHTS
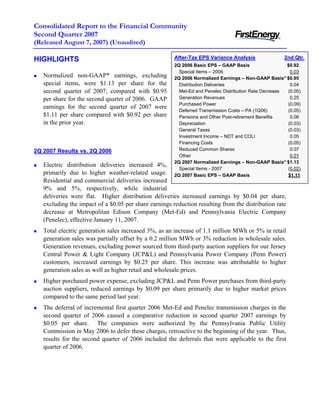
2Q 2006 Basic EPS – GAAP Basis $0.92
Special Items – 2006 0.03
Normalized non-GAAP* earnings, excluding 2Q 2006 Normalized Earnings – Non-GAAP Basis* $0.95
special items, were $1.13 per share for the Distribution Deliveries 0.04
second quarter of 2007, compared with $0.95 Met-Ed and Penelec Distribution Rate Decrease (0.05)
Generation Revenues 0.25
per share for the second quarter of 2006. GAAP
Purchased Power (0.09)
earnings for the second quarter of 2007 were
Deferred Transmission Costs – PA (1Q06) (0.05)
$1.11 per share compared with $0.92 per share Pensions and Other Post-retirement Benefits 0.06
in the prior year. Depreciation (0.03)
General Taxes (0.03)
Investment Income – NDT and COLI 0.05
Financing Costs (0.05)
Reduced Common Shares 0.07
2Q 2007 Results vs. 2Q 2006
Other 0.01
2Q 2007 Normalized Earnings – Non-GAAP Basis* $1.13
Electric distribution deliveries increased 4%,
Special Items - 2007 (0.02)
primarily due to higher weather-related usage. 2Q 2007 Basic EPS – GAAP Basis $1.11
Residential and commercial deliveries increased
9% and 5%, respectively, while industrial
deliveries were flat. Higher distribution deliveries increased earnings by $0.04 per share,
excluding the impact of a $0.05 per share earnings reduction resulting from the distribution rate
decrease at Metropolitan Edison Company (Met-Ed) and Pennsylvania Electric Company
(Penelec), effective January 11, 2007.
Total electric generation sales increased 3%, as an increase of 1.1 million MWh or 5% in retail
generation sales was partially offset by a 0.2 million MWh or 3% reduction in wholesale sales.
Generation revenues, excluding power sourced from third-party auction suppliers for our Jersey
Central Power & Light Company (JCP&L) and Pennsylvania Power Company (Penn Power)
customers, increased earnings by $0.25 per share. This increase was attributable to higher
generation sales as well as higher retail and wholesale prices.
Higher purchased power expense, excluding JCP&L and Penn Power purchases from third-party
auction suppliers, reduced earnings by $0.09 per share primarily due to higher market prices
compared to the same period last year.
The deferral of incremental first quarter 2006 Met-Ed and Penelec transmission charges in the
second quarter of 2006 caused a comparative reduction in second quarter 2007 earnings by
$0.05 per share. The companies were authorized by the Pennsylvania Public Utility
Commission in May 2006 to defer these charges, retroactive to the beginning of the year. Thus,
results for the second quarter of 2006 included the deferrals that were applicable to the first
quarter of 2006.
2. Reduced pension and other post-retirement benefit costs increased earnings by $0.06 per share
mainly due to retiree health care design changes and the impact of the $300 million voluntary
contribution to the pension plan made in January 2007.
Incremental property additions increased depreciation by $0.03 per share.
Higher general taxes reduced earnings by $0.03 per share primarily due to increased property
tax payments, Pennsylvania gross receipts taxes, and Ohio kilowatt-hour taxes.
Investment income related to nuclear decommissioning trusts and corporate-owned life
insurance increased earnings by $0.05 per share.
Increased financing costs lowered earnings by $0.05 per share, primarily attributable to short-
term borrowing levels related largely to the temporary funding of the accelerated share
repurchase programs and the recent pension plan contribution.
The reduction in shares outstanding due to the accelerated repurchases of 10.6 million and
14.4 million common shares in August 2006 and March 2007, respectively, enhanced earnings
by $0.07 per share.
During the quarter, a $0.02 per share reduction in earnings was recognized from impairment of
securities held in trust for future nuclear decommissioning activities.
2007 Earnings Guidance
Normalized non-GAAP earnings guidance for 2007, excluding special items, remains at $4.05
to $4.25 per share. Year-to-date normalized non-GAAP earnings now stand at $2.01 per share.
Earnings for the remainder of the year, exclusive of any special items, are expected to be
allocated approximately 56% to the third quarter and 44% to the fourth quarter.
* The 2007 GAAP to non-GAAP reconciliation statements can be found on page 10 of this report and all GAAP to non-GAAP
reconciliation statements are available on the Investor Information section of FirstEnergy Corp.'s Web site at
www.firstenergycorp.com/ir.
For additional information, please contact:
Ronald E. Seeholzer Kurt E. Turosky Rey Y. Jimenez
Vice President, Investor Relations Director, Investor Relations Principal, Investor Relations
(330) 384-5783 (330) 384-5500 (330) 761-4239
Consolidated Report to the Financial Community –2nd Quarter 2007 2
3. FirstEnergy Corp.
Consolidated Statements of Income
(Unaudited)
(In millions, except for per share amounts)
Three Months Ended June 30, Six Months Ended June 30,
2007 2006 Change 2007 2006 Change
Revenues
(1) Electric sales $ 2,904 $ 2,553 $ 351 $ 5,669 $ 5,064 $ 605
- -
(2) FE Facilities 23 (23) 38 (38)
(3) Other 205 175 30 413 354 59
(4) Total Revenues 3,109 2,751 358 6,082 5,456 626
Expenses
(5) Fuel 299 303 (4) 560 585 (25)
(6) Purchased power 886 688 198 1,746 1,404 342
(7) Other operating expenses 750 702 48 1,499 1,440 59
- -
(8) FE Facilities 16 (16) 31 (31)
(9) Provision for depreciation 159 144 15 315 292 23
(10) Amortization of regulatory assets 246 201 45 497 422 75
(11) Deferral of new regulatory assets (148) (146) (2) (292) (226) (66)
(12) General taxes 189 173 16 392 366 26
(13) Total Expenses 2,381 2,081 300 4,717 4,314 403
(14) Operating Income 728 670 58 1,365 1,142 223
Other Income (Expense)
(15) Investment income 30 31 (1) 63 74 (11)
(16) Interest expense (205) (178) (27) (390) (343) (47)
(17) Capitalized interest 7 7 - 12 14 (2)
(18) Subsidiaries' preferred stock dividends - (2) 2 - (4) 4
(19) (168) (142) (26) (315) (259) (56)
Total Other Income (Expense)
(20) Income From Continuing Operations
560 528 32 1,050 883 167
Before Income Taxes
(21) Income taxes 222 216 6 422 352 70
(22) Income From Continuing Operations 338 312 26 628 531 97
(23) Discontinued operations - (8) 8 - (6) 6
(24) Net Income $ 338 $ 304 $ 34 $ 628 $ 525 $ 103
Basic Earnings Per Common Share:
(25) Income from continuing operations $ 1.11 $ 0.94 $ 0.17 $ 2.03 $ 1.61 $ 0.42
(26) Discontinued operations - (0.02) 0.02 - (0.02) 0.02
(27) Basic Earnings Per Common Share $ 1.11 $ 0.92 $ 0.19 $ 2.03 $ 1.59 $ 0.44
(28) Weighted Average Number of
304 328 (24) 309 328 (19)
Basic Shares Outstanding
Diluted Earnings Per Common Share:
(29) Income from continuing operations $ 1.10 $ 0.93 $ 0.17 $ 2.01 $ 1.60 $ 0.41
(30) Discontinued operations - (0.02) 0.02 - (0.02) 0.02
(31) Diluted Earnings Per Common Share $ 1.10 $ 0.91 $ 0.19 $ 2.01 $ 1.58 $ 0.43
(32) Weighted Average Number of
308 330 (22) 313 330 (17)
Diluted Shares Outstanding
______________________________________________________________________________________________________
Consolidated Report to the Financial Community – 2nd Quarter 2007 3
4. FirstEnergy Corp.
Consolidated Income Segments
(Unaudited)
(In millions)
Three Months Ended June 30, 2007
Ohio
Energy Competitive Transitional
Energy Reconciling
Delivery Generation
Services (b) Adjustments
Services (a) Services (c) Other (d) Consolidated
Revenues
(1) Electric sales $ 1,933 $ 359 $ 612 $ - $ - $ 2,904
(2) FE Facilities - - - - -
-
(3) Other 162 45 13 9 (24) 205
(4) Internal revenues - 691 - - (691) -
(5) Total Revenues 2,095 1,095 625 9 (715) 3,109
Expenses
(6) Fuel 2 297 - - - 299
(7) Purchased power 877 163 537 - (691) 886
(8) Other operating expenses 410 283 87 4 (34) 750
(9) FE Facilities - - - - - -
(10) Provision for depreciation 100 51 - 1 7 159
(11) Amortization of regulatory assets 242 - 6 - (2) 246
(12) Deferral of new regulatory assets (93) - (55) - - (148)
(13) General taxes 155 26 1 - 7 189
(14) 1,693 820 576 5 (713) 2,381
Total Expenses
(15) 402 275 49 4 (2) 728
Operating Income
Other Income (Expense)
(16) Investment income 62 5 - - (37) 30
(17) Interest expense (118) (47) - (1) (39) (205)
(18) Capitalized interest 2 5 - - - 7
(19) Subsidiaries' preferred stock dividends - - - - - -
(20) (54) (37) - (1) (76) (168)
Total Other Income (Expense)
(21) Income From Continuing Operations
348 238 49 3 (78) 560
Before Income Taxes
(22) Income taxes 141 96 19 (3) (31) 222
(23) 207 142 30 6 (47) 338
Income From Continuing Operations
(24) Discontinued operations - - - - - -
(25) Net Income $ 207 $ 142 $ 30 $ 6 $ (47) $ 338
(a) Consists of regulated transmission and distribution operations, including transition cost recovery, and provider of last resort generation service for
FirstEnergy's Pennsylvania and New Jersey electric utility subsidiaries.
(b) Consists of unregulated generation and commodity operations, including competitive electric sales, and generation sales to affiliated electric utilities.
(c) Represents provider of last resort generation service by FirstEnergy's Ohio electric utility subsidiaries.
(d) Primarily consists of telecommunications services.
______________________________________________________________________________________________________
Consolidated Report to the Financial Community – 2nd Quarter 2007 4
5. FirstEnergy Corp.
Consolidated Income Segments
(Unaudited)
(In millions)
Three Months Ended June 30, 2006
Ohio
Energy Competitive Transitional
Energy Reconciling
Delivery Generation
Services (b) Adjustments
Services (a) Services (c) Other (d) Consolidated
Revenues
(1) Electric sales $ 1,646 $ 338 $ 569 $ - $ - $ 2,553
(2) FE Facilities - - - 23 - 23
(3) Other 127 46 6 16 (20) 175
(4) Internal revenues 6 623 - - (629) -
(5) 1,779 1,007 575 39 (649) 2,751
Total Revenues
Expenses
(6) Fuel - 303 - - - 303
(7) Purchased power 690 131 496 - (629) 688
(8) Other operating expenses 363 289 53 25 (28) 702
(9) FE Facilities - - - 16 - 16
(10) Provision for depreciation 89 48 - 1 6 144
(11) Amortization of regulatory assets 197 - 4 - - 201
(12) Deferral of new regulatory assets (113) - (33) - - (146)
(13) General taxes 144 23 2 - 4 173
(14) Total Expenses 1,370 794 522 42 (647) 2,081
(15) Operating Income 409 213 53 (3) (2) 670
Other Income (Expense)
(16) Investment income 81 2 - - (52) 31
(17) Interest expense (101) (50) - (2) (25) (178)
(18) Capitalized interest 4 3 - - - 7
(19) Subsidiaries' preferred stock dividends (5) - - - 3 (2)
(20) (21) (45) - (2) (74) (142)
Total Other Income (Expense)
(21) Income From Continuing Operations
388 168 53 (5) (76) 528
Before Income Taxes
(22) Income taxes 155 67 22 2 (30) 216
(23) Income From Continuing Operations 233 101 31 (7) (46) 312
(24) Discontinued operations - - - (8) - (8)
(25) Net Income $ 233 $ 101 $ 31 $ (15) $ (46) $ 304
(a) Consists of regulated transmission and distribution operations, including transition cost recovery, and provider of last resort generation service for
FirstEnergy's Pennsylvania and New Jersey electric utility subsidiaries.
(b) Consists of unregulated generation and commodity operations, including competitive electric sales, and generation sales to affiliated electric utilities.
(c) Represents provider of last resort generation service by FirstEnergy's Ohio electric utility subsidiaries.
(d) Consists of telecommunications services and non-core businesses divested in 2006 (Facilities Services Group and MYR).
______________________________________________________________________________________________________
Consolidated Report to the Financial Community – 2nd Quarter 2007 5
6. FirstEnergy Corp.
Consolidated Income Segments
(Unaudited)
(In millions)
Three Months Ended June 30, 2007 vs. Three Months Ended June 30, 2006
Ohio
Energy Competitive Transitional
Energy Reconciling
Delivery Generation
Services (b) Adjustments
Services (a) Services (c) Other (d) Consolidated
Revenues
(1) Electric sales $ 287 $ 21 $ 43 $ - $ - $ 351
(2) FE Facilities - - - (23) - (23)
(3) Other 35 (1) 7 (7) (4) 30
(4) Internal revenues (6) 68 - - (62) -
(5) Total Revenues 316 88 50 (30) (66) 358
Expenses
(6) Fuel 2 (6) - - - (4)
(7) Purchased power 187 32 41 - (62) 198
(8) Other operating expenses 47 (6) 34 (21) (6) 48
(9) FE Facilities - - - (16) - (16)
(10) Provision for depreciation 11 3 - - 1 15
(11) Amortization of regulatory assets 45 - 2 - (2) 45
(12) Deferral of new regulatory assets 20 - (22) - - (2)
(13) General taxes 11 3 (1) - 3 16
(14) Total Expenses 323 26 54 (37) (66) 300
(15) Operating Income (7) 62 (4) 7 - 58
Other Income (Expense)
(16) Investment income (19) 3 - - 15 (1)
(17) Interest expense (17) 3 - 1 (14) (27)
(18) Capitalized interest (2) 2 - - - -
(19) Subsidiaries' preferred stock dividends 5 - - - (3) 2
(20) (33) 8 - 1 (2) (26)
Total Other Income (Expense)
(21) Income From Continuing Operations
(40) 70 (4) 8 (2) 32
Before Income Taxes
(22) Income taxes (14) 29 (3) (5) (1) 6
(23) Income From Continuing Operations (26) 41 (1) 13 (1) 26
(24) Discontinued operations - - - 8 - 8
(25) Net Income $ (26) $ 41 $ (1) $ 21 $ (1) $ 34
(a) Consists of regulated transmission and distribution operations, including transition cost recovery, and provider of last resort generation service for
FirstEnergy's Pennsylvania and New Jersey electric utility subsidiaries.
(b) Consists of unregulated generation and commodity operations, including competitive electric sales, and generation sales to affiliated electric utilities.
(c) Represents provider of last resort generation service by FirstEnergy's Ohio electric utility subsidiaries.
(d) Consists of telecommunications services and non-core businesses divested in 2006 (Facilities Services Group and MYR).
______________________________________________________________________________________________________
Consolidated Report to the Financial Community – 2nd Quarter 2007 6
7. FirstEnergy Corp.
Financial Statements
(Unaudited)
(In millions)
Condensed Consolidated Balance Sheets
As of June As of Dec
30, 2007 31, 2006
Assets
Current Assets:
Cash and cash equivalents $ 37 $ 90
Receivables 1,594 1,267
Other 905 726
Total Current Assets 2,536 2,083
Property, Plant and Equipment 15,010 14,667
Investments 3,564 3,534
Deferred Charges and Other Assets 10,923 10,912
Total Assets $ 32,033 $ 31,196
Liabilities and Capitalization
Current Liabilities:
Currently payable long-term debt $ 2,000 $ 1,867
Short-term borrowings (a) 2,416 1,108
Accounts payable 801 726
Other 1,065 1,554
Total Current Liabilities 6,282 5,255
Capitalization:
Common stockholders' equity (b) 8,640 9,035
Long-term debt and other long-term obligations 8,742 8,535
Total Capitalization 17,382 17,570
Noncurrent Liabilities 8,369 8,371
Total Liabilities and Capitalization $ 32,033 $ 31,196
(a) Increase reflects interim financing of $300 million voluntary pension contribution and
$900 million accelerated common share repurchase program in 2007.
(b) Reduction reflects $900 million common share repurchase in 2007.
General Information Three Months Ended June 30, Six Months Ended June 30,
2007 2006 2007 2006
Debt and equity securities redemptions $ (485) $ (421) $ (1,389) $ (515)
New long-term debt issues $ 550 $ 1,053 $ 800 $ 1,053
Short-term debt increase $ 169 $ 171 $ 1,308 $ 371
Capital expenditures $ 401 $ 292 $ 697 $ 739
Adjusted Capitalization (Including Off-Balance Sheet Items) - Rating Agency View
As of June 30,
2007 % Total 2006 % Total
Total common equity $ 8,640 38% $ 9,488 43%
Preferred stock - - 154 1%
Long-term debt (a) 10,331 46% 10,477 48%
Short-term debt 2,416 11% 557 3%
Off-balance sheet debt equivalents:
Sale-leaseback net debt equivalents (b) 1,143 5% 1,236 5%
Total $ 22,530 100% $ 21,912 100%
(a) Includes amount due to be paid within one year and excludes JCP&L securitization debt of $411 million and $256 million in
2007 and 2006, respectively.
(b) Associated with 1987 sale and leaseback transactions.
______________________________________________________________________________________________________
Consolidated Report to the Financial Community – 2nd Quarter 2007 7
8. FirstEnergy Corp.
Financial Statements
(Unaudited)
(In millions)
Condensed Consolidated Statements of Cash Flows
Three Months Ended June 30, Six Months Ended June 30,
2007 2006 2007 2006
Cash flows from operating activities:
Net income $ 338 $ 304 $ 628 $ 525
Adjustments to reconcile net income to net cash from operating activities:
Depreciation, amortization, and deferral
of regulatory assets 257 197 520 487
Deferred purchased power and other costs (69) (135) (185) (239)
Deferred income taxes and investment tax credits 32 26 85 32
Deferred rents and lease market valuation liability (67) (67) (92) (105)
Electric service prepayment programs (19) (15) (36) (29)
Cash collateral, net (25) 51 (19) (55)
Pension trust contribution - - (300) -
Change in working capital and other (241) (200) (470) (131)
Cash flows provided from operating activities 206 161 131 485
Cash flows provided from financing activities 108 668 454 618
Cash flows used for investing activities (366) (274) (638) (584)
Net increase (decrease) in cash and cash equivalents $ (52) $ 555 $ (53) $ 519
Deferrals and Amortizations
Three Months Ended June 30, Six Months Ended June 30,
2007 2006 Change 2007 2006 Change
Ohio Regulatory Assets
$ 1,820 $ 1,891 $ 1,844 $ 1,924
Deferred Balance - Beginning
- -
Deferral of shopping incentives $ - - 3 $ (3)
Interest on shopping incentives 9 11 (2) 19 21 (2)
Deferral of MISO costs and interest 30 4 26 38 7 31
Deferral of RCP distribution reliability costs 44 41 3 91 81 10
Deferral of RCP fuel costs 27 30 (3) 41 51 (10)
Deferral of other regulatory assets 5 2 3 11 5 6
$ 115 $ 88 $ 27 $ 200 $ 168 $ 32
Current period deferrals
Amortization
Ohio transition costs amortization $ (72) $ (62) $ (10) $ (140) $ (134) $ (6)
-
Shopping incentives amortization (29) (29) - (59) (59)
MISO costs amortization (6) (5) (1) (11) (9) (2)
-
Other (2) (1) (1) (8) (8)
$ (109) $ (97) $ (12) $ (218) $ (210) $ (8)
Current period amortization
$ 1,826 $ 1,882 $ 1,826 $ 1,882
Deferred Balance - Ending
Pennsylvania Deferred PJM Costs
$ 186 $ - $ 186 $ 157 $ - $ 157
Beginning Balance
Deferrals 30 57 (27) 63 57 6
- -
Interest 2 2 3 3
- -
Amortizations (2) (2) (7) (7)
$ 216 $ 57 $ 159 $ 216 $ 57 $ 159
Ending Balance
New Jersey Deferred Energy Costs
$ 357 $ 558 $ 369 $ 541
Beginning Balance
Deferral of energy costs 35 80 $ (45) 23 97 $ (74)
$ 392 $ 638 $ 392 $ 638
Ending Balance
______________________________________________________________________________________________________
Consolidated Report to the Financial Community – 2nd Quarter 2007 8
9. FirstEnergy Corp.
Statistical Summary
(Unaudited)
Electric Sales Statistics
Three Months Ended June 30, Six Months Ended June 30,
(in millions of kWhs) 2007 2006 Change 2007 2006 Change
Electric Generation Sales
Retail - Regulated 23,186 22,591 2.6% 47,994 46,597 3.0%
Retail - Competitive 3,285 2,740 19.9% 6,491 5,459 18.9%
Total Retail 26,471 25,331 4.5% 54,485 52,056 4.7%
Wholesale 6,360 6,561 -3.1% 11,423 11,983 -4.7%
Total Electric Generation Sales 32,831 31,892 2.9% 65,908 64,039 2.9%
Electric Distribution Deliveries
Ohio - Residential 3,835 3,583 7.0% 8,666 8,026 8.0%
- Commercial 3,674 3,516 4.5% 7,469 7,160 4.3%
- Industrial 5,908 5,902 0.1% 11,587 11,561 0.2%
- Other 93 95 -2.1% 186 186 0.0%
Total Ohio 13,510 13,096 3.2% 27,908 26,933 3.6%
Pennsylvania - Residential 2,564 2,365 8.4% 5,868 5,457 7.5%
- Commercial 2,730 2,602 4.9% 5,501 5,252 4.7%
- Industrial 2,567 2,611 -1.7% 5,109 5,175 -1.3%
- Other 21 21 - 40 41 -2.4%
Total Pennsylvania 7,882 7,599 3.7% 16,518 15,925 3.7%
New Jersey - Residential 2,387 2,100 13.7% 4,740 4,354 8.9%
- Commercial 2,416 2,292 5.4% 4,713 4,496 4.8%
- Industrial 724 703 3.0% 1,426 1,393 2.4%
- Other 21 21 - 43 43 0.0%
Total New Jersey 5,548 5,116 8.4% 10,922 10,286 6.2%
Total Residential 8,786 8,048 9.2% 19,274 17,837 8.1%
Total Commercial 8,820 8,410 4.9% 17,683 16,908 4.6%
Total Industrial 9,199 9,216 -0.2% 18,122 18,129 0.0%
Total Other 135 137 -1.5% 269 270 -0.4%
Total Distribution Deliveries 26,940 25,811 4.4% 55,348 53,144 4.1%
Electric Sales Shopped
Ohio - Residential 489 497 -1.6% 1,050 1,093 -3.9%
- Commercial 872 910 -4.2% 1,752 1,866 -6.1%
- Industrial 692 709 -2.4% 1,333 1,444 -7.7%
Total Ohio 2,053 2,116 -3.0% 4,135 4,403 -6.1%
Pennsylvania - Residential 11 - - 11 1 -
- Commercial 156 - - 264 1 -
- Industrial 460 94 389.4% 876 225 289.3%
Total Pennsylvania 627 94 567.0% 1,151 227 407.0%
New Jersey - Residential - - - - - -
- Commercial 519 491 5.7% 994 894 11.2%
- Industrial 555 519 6.9% 1,074 1,023 5.0%
Total New Jersey 1,074 1,010 6.3% 2,068 1,917 7.9%
Total Electric Sales Shopped 3,754 3,220 16.6% 7,354 6,547 12.3%
Operating Statistics
Three Months Ended June 30, Six Months Ended June 30,
2007 2006 2007 2006
Capacity Factors:
Fossil - Baseload 90.3% 92.2% 77.5% 92.6%
Fossil - Load Following 71.8% 67.7% 72.9% 67.9%
Peaking 2.2% 0.3% 1.2% 0.2%
Nuclear 79.7% 84.0% 89.3% 83.0%
Generation Output:
Fossil - Baseload 43.2% 43.7% 37.8% 44.0%
Fossil - Load Following 22.8% 21.7% 23.7% 21.8%
Peaking 0.4% 0.1% 0.2% 0.0%
Nuclear 33.5% 34.5% 38.3% 34.2%
Three Months Ended June 30, Six Months Ended June 30,
Weather 2007 2006 Normal 2007 2006 Normal
Composite Heating-Degree-Days 659 569 653 3,567 3,092 3,457
Composite Cooling-Degree-Days 287 206 251 288 206 259
______________________________________________________________________________________________________
Consolidated Report to the Financial Community – 2nd Quarter 2007 9
10. FirstEnergy Corp.
2007 EPS Reconciliations
(Unaudited)
Special Items
Three Months Ended June 30, Six Months Ended June 30,
2007 2006 2007 2006
Pre-tax Items - Income Increase (Decrease)
Gain (Loss) on Non-Core Asset Sales of:
Loss on sale on MYR 60% interest (a) $ - $ - $ - $ (5)
All other (a)(f) - 6 - 6
Total Gain on Non-Core Asset Sales - 6 - 1
Saxton decommissioning costs regulatory assets (b) - - 27 -
Trust securities impairment (c) (8) - (12) -
FE Facilities sales/impairment (d)(e)(g) - (12) - (12)
Total-Pretax Items $ (8) $ (6) $ 15 $ (11)
EPS Effect $ (0.02) $ (0.03) $ 0.02 $ (0.03)
(a) Included in quot;Other operating expensesquot; (e) Included in quot;Discontinued Operationsquot;
(b) Included in quot;Deferral of new regulatory assetsquot; (f) Before first quarter 2006 tax benefit of $2.5 million
(c) Included in quot;Investment incomequot; (g) Non-tax deductible
(d) Included in quot;FE Facilities expensesquot;
2007 Earnings Per Share (EPS)
(Reconciliation of GAAP to Non-GAAP)
ACTUAL ACTUAL Non-GAAP
Three Months Six Months Guidance For
Ended June 30 Ended June 30 Year 2007
Basic EPS (GAAP basis) $ 1.11 $ 2.03 $4.11 - $4.31
Excluding Special Items:
New regulatory asset authorized by PPUC - (0.05) (0.05)
Gain on sale of non-core assets - - (0.04)
Trust securities impairment 0.02 0.03 0.03
Basic EPS (Non-GAAP basis) $ 1.13 $ 2.01 $4.05 - $4.25
______________________________________________________________________________________________________
Consolidated Report to the Financial Community – 2nd Quarter 2007 10
11. RECENT DEVELOPMENTS
Record Generation Output
FirstEnergy set a new second quarter generation output record of 20.4 million megawatt-hours, which represented a
0.4% increase over the prior record established in the second quarter of 2006. The generation record was primarily
attributable to performance of the fossil generation fleet, which established its best quarterly output ever.
Sale and Leaseback of Bruce Mansfield Unit 1
On July 13, 2007, FirstEnergy Generation Corp. (Genco) completed a $1.3 billion sale and leaseback transaction for its
779 MW portion of Unit 1 of the Bruce Mansfield Plant. The applicable lease agreements provide for an approximate
33-year lease of the unit. FirstEnergy used the net after-tax proceeds of approximately $1.2 billion, to repay short-term
debt that was used to fund the March 2007 $900 million accelerated share repurchase program and the January 2007
$300 million pension contribution. Genco continues to operate the plant and is entitled to its full output.
Ohio Distribution Rate Case Filing
On June 7, 2007, FirstEnergy subsidiaries Ohio Edison (OE), The Cleveland Electric Illuminating Company (CEI), and
Toledo Edison (TE) (collectively Ohio Companies), filed their base distribution rate increase request and supporting
testimony with the Public Utilities Commission of Ohio (PUCO). On August 6, the Ohio Companies provided an
Update Filing with three months of actual results (March through May 2007) for the test year and actual asset and
liability balances as of May 31, 2007. The requested increase in annualized distribution revenues totals $332 million to
recover expenses related to distribution operations and the costs deferred under previously approved rate plans. The
new rates would be effective January 1, 2009, for OE and TE customers, and are expected to be effective in May 2009
for CEI customers. Concurrent with the effective dates, the Ohio Companies will reduce or eliminate their Regulatory
Transition Charges (RTC), resulting in an aggregate net reduction of $262 million on the regulated portion of
customers’ bills. It is estimated the PUCO Staff will issue its report in the case in the fourth quarter of 2007 with
evidentiary hearings to follow in late 2007. The PUCO Order is expected in March 2008.
Ohio Competitive Generation Supply Plan Filing
On July 10, 2007, the Ohio Companies filed an application with the PUCO requesting approval of a comprehensive
supply plan for providing generation service, beginning January 1, 2009, to customers who choose not to purchase
electricity from an alternative supplier. The proposed competitive bidding process would average the results of
multiple bidding sessions conducted at different times during the year beginning in 2008. The Ohio Companies offered
two alternatives for structuring the bids, either by customer class or a “slice-of-system” approach that combines all
customer classes into tranches that represent a portion of the total customer load. The proposal provides the PUCO
with an option to phase in generation price increases for residential tariff groups that would experience a change in the
average total price of 15 percent or more. The Ohio Companies requested that the PUCO issue an order by November
1, 2007, to provide sufficient time to conduct the bidding process. The PUCO has scheduled a technical conference to
be held on August 16, 2007 to allow interested parties an opportunity to better understand the filing.
Ohio Companies’ Green Option for Customers
On May 29, 2007, OE, CEI and TE filed a proposed program with the PUCO that would provide customers with the
opportunity to purchase Renewable Energy Certificates (RECs) to support alternative energy. The program was
designed in collaboration with the PUCO Staff and the Office of the Ohio Consumers’ Counsel. The proposal is
currently pending before the PUCO.
Pennsylvania Power Company Default Service Plan Update
On May 2, 2007, Pennsylvania Power Company made a filing with the Pennsylvania Public Utility Commission
(PPUC) proposing a process to procure the power supply needed for default service customers during the period of
June 1, 2008 through May 31, 2011. The hearings are scheduled for September 10-11, 2007, with an Administrative
Law Judge (ALJ) recommended decision expected by October 25, 2007. A PPUC Order is expected on or about
November 29, 2007.
Consolidated Report to the Financial Community – 2nd Quarter 2007 11
12. Met-Ed and Penelec Commonwealth Court Appeals
On June 19, 2007, initial briefs were filed by all parties in the appeal of the PPUC’s January 2007 transition rate plan
order to the Pennsylvania Commonwealth Court. Responsive briefs are due August 20, 2007, with reply briefs due
September 4, 2007. Metropolitan Edison Company (Met-Ed) and Pennsylvania Electric Company (Penelec) appealed
the PPUC’s decision on the denial of generation rate relief and on a consolidated income tax adjustment related to cost
of capital, while other parties appealed the PPUC’s decision on transmission rate relief. Oral arguments are expected to
take place in late 2007 or early 2008.
Met-Ed and Penelec NUG Accounting Case Update
On May 3, 2007, the ALJ issued a recommended decision denying Met-Ed’s and Penelec’s request to modify their
Non-Utility Generation (NUG) stranded cost accounting methodology. The companies filed exceptions to the initial
decision on May 23, 2007. It is not known when the PPUC may issue a final decision in this matter.
Nuclear Update
On May 14, 2007, the Nuclear Regulatory Commission (NRC) issued a Demand for Information related to recent
reports prepared at the request of FirstEnergy Nuclear Operating Company (FENOC) by expert witnesses for
arbitration of an insurance claim for replacing the damaged reactor head at the Davis-Besse Plant in 2002. FENOC
filed a response with the NRC on June 13, and supplemented that response on July 16, 2007, after participating in an
NRC public meeting June 27, 2007, to discuss the company's initial response.
FirstEnergy’s Perry Plant completed its regularly scheduled refueling outage on May 13, 2007. Major work activities
performed on the 1,258 megawatt (MW) facility included replacing approximately one-third of the fuel assemblies in
the reactor and two of the three low-pressure turbine rotors in the main generator. On June 29, 2007, the Perry Plant
began an outage to replace a 30-ton motor in the reactor recirculation system. In addition to motor replacement, routine
and preventive maintenance and several system inspections were performed to assure continued safe and reliable
operation of the plant. On July 24, the Perry Plant exited its outage and returned to service.
Environmental Update
On May 30, 2007, FirstEnergy announced that Genco plans to install an Electro-Catalytic Oxidation (ECO) system on
units 4 and 5 of the R. E. Burger Plant. The two units produce 312 MW combined. The original plans called for
installation of an ECO system on Unit 4 of the Bay Shore Plant (215 MW). The decision to install ECO at the Burger
Plant will result in additional scrubbed megawatts and better fits the coal-purchasing strategy for both plants. Design
engineering for the new Burger Plant ECO system will begin later this year with an anticipated start-up during the first
quarter of 2011.
Jersey Central Power & Light Debt Offering
On May 21, 2007, Jersey Central Power & Light (JCP&L) issued $550 million of senior unsecured notes. The offering
was in two tranches, consisting of $250 million of 5.65% senior notes due 2017, and $300 million of 6.15% senior
notes due 2037. Proceeds from the transaction were used to redeem all outstanding JCP&L first mortgage bonds, repay
short-term debt and repurchase common stock from FirstEnergy Corp.
Forward-Looking Statements: This Consolidated Report to the Financial Community includes forward-looking statements based on information currently available
to management. Such statements are subject to certain risks and uncertainties. These statements typically contain, but are not limited to, the terms “anticipate,”
“potential,” “expect,” “believe,” “estimate” and similar words. Actual results may differ materially due to the speed and nature of increased competition and
deregulation in the electric utility industry, economic or weather conditions affecting future sales and margins, changes in markets for energy services, changing energy
and commodity market prices, replacement power costs being higher than anticipated or inadequately hedged, the continued ability of FirstEnergy’s regulated utilities
to collect transition and other charges or to recover increased transmission costs, maintenance costs being higher than anticipated, legislative and regulatory changes
(including revised environmental requirements), and the legal and regulatory changes resulting from the implementation of the Energy Policy Act of 2005 (including,
but not limited to, the repeal of the Public Utility Holding Company Act of 1935), the uncertainty of the timing and amounts of the capital expenditures needed to,
among other things, implement the Air Quality Compliance Plan (including that such amounts could be higher than anticipated) or levels of emission reductions related
to the Consent Decree resolving the New Source Review litigation, adverse regulatory or legal decisions and outcomes (including, but not limited to, the revocation of
necessary licenses or operating permits and oversight) by the NRC (including, but not limited to, the Demand For Information issued to FENOC on May 14, 2007) and
the various state public utility commissions as disclosed in our SEC filings, the timing and outcome of various proceedings before the PUCO (including, but not limited
to, the Distribution Rate Cases and the generation supply plan filing for the Ohio Companies and the successful resolution of the issues remanded to the PUCO by the
Ohio Supreme Court regarding the Rate Stabilization Plan) and the PPUC (including the Pennsylvania Power Company Default Service Plan filing), the resolution of
the Petitions for Review filed with the Commonwealth Court of Pennsylvania with respect to the transition rate plan for Met-Ed and Penelec, the continuing
availability and operation of generating units, the ability of generating units to continue to operate at, or near full capacity, the inability to accomplish or realize
anticipated benefits from strategic goals (including employee workforce initiatives), the anticipated benefits from voluntary pension plan contributions, the ability to
improve electric commodity margins and to experience growth in the distribution business, the ability to access the public securities and other capital markets and the
cost of such capital, the outcome, cost and other effects of present and potential legal and administrative proceedings and claims related to the August 14, 2003 regional
power outage, any final adjustment in the purchase price per share under the accelerated share repurchase program announced March 2, 2007, the risks and other
factors discussed from time to time in our SEC filings, and other similar factors. We expressly disclaim any current intention to update any forward-looking statements
contained herein as a result of new information, future events, or otherwise.
Consolidated Report to the Financial Community – 2nd Quarter 2007 12