Economics, Commerce and Trade Management: An International Journal (ECTIJ)
u.s.bancorp3Q 2004 Earnings Release
1. News Release
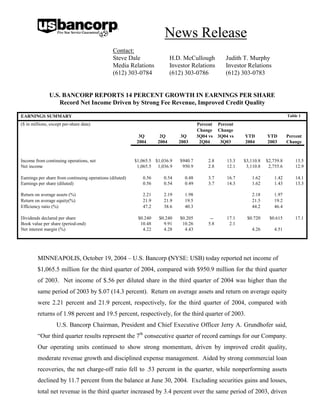
Contact:
Steve Dale H.D. McCullough Judith T. Murphy
Media Relations Investor Relations Investor Relations
(612) 303-0784 (612) 303-0786 (612) 303-0783
U.S. BANCORP REPORTS 14 PERCENT GROWTH IN EARNINGS PER SHARE
Record Net Income Driven by Strong Fee Revenue, Improved Credit Quality
Table 1
EARNINGS SUMMARY
($ in millions, except per-share data) Percent Percent
Change Change
3Q 2Q 3Q 3Q04 vs 3Q04 vs YTD YTD Percent
2004 2004 2003 2Q04 3Q03 2004 2003 Change
Income from continuing operations, net $1,065.5 $1,036.9 $940.7 2.8 13.3 $3,110.8 $2,739.8 13.5
Net income 1,065.5 1,036.9 950.9 2.8 12.1 3,110.8 2,755.6 12.9
Earnings per share from continuing operations (diluted) 0.56 0.54 0.48 3.7 16.7 1.62 1.42 14.1
Earnings per share (diluted) 0.56 0.54 0.49 3.7 14.3 1.62 1.43 13.3
Return on average assets (%) 2.21 2.19 1.98 2.18 1.97
Return on average equity(%) 21.9 21.9 19.5 21.5 19.2
Efficiency ratio (%) 47.2 38.6 40.3 44.2 46.4
Dividends declared per share $0.240 $0.240 $0.205 -- 17.1 $0.720 $0.615 17.1
Book value per share (period-end) 10.48 9.91 10.26 5.8 2.1
Net interest margin (%) 4.22 4.28 4.43 4.26 4.51
MINNEAPOLIS, October 19, 2004 – U.S. Bancorp (NYSE: USB) today reported net income of
$1,065.5 million for the third quarter of 2004, compared with $950.9 million for the third quarter
of 2003. Net income of $.56 per diluted share in the third quarter of 2004 was higher than the
same period of 2003 by $.07 (14.3 percent). Return on average assets and return on average equity
were 2.21 percent and 21.9 percent, respectively, for the third quarter of 2004, compared with
returns of 1.98 percent and 19.5 percent, respectively, for the third quarter of 2003.
U.S. Bancorp Chairman, President and Chief Executive Officer Jerry A. Grundhofer said,
“Our third quarter results represent the 7th consecutive quarter of record earnings for our Company.
Our operating units continued to show strong momentum, driven by improved credit quality,
moderate revenue growth and disciplined expense management. Aided by strong commercial loan
recoveries, the net charge-off ratio fell to .53 percent in the quarter, while nonperforming assets
declined by 11.7 percent from the balance at June 30, 2004. Excluding securities gains and losses,
total net revenue in the third quarter increased by 3.4 percent over the same period of 2003, driven
2. U.S. Bancorp Reports Third Quarter 2004 Results
October 19, 2004
Page 2
by an 11.7 percent increase in fee-based products and services. Our payment services and
consumer banking business lines led the way in fee revenue generation and continued to produce
outstanding results, helping to offset weakness in commercial lending. We are continuing our
investment in high-growth businesses through the expansion of our merchant acquiring business in
Europe, the extension of our card issuing capabilities domestically and the roll out of our in-store
branch initiative in consumer banking. Finally, we returned 94 percent of the Company’s earnings
in the quarter to our shareholders in the form of dividends and share repurchases.”
The Company’s results for the third quarter of 2004 improved over the same period of 2003,
primarily due to lower credit costs and growth in fee-based products and services. Included in the
current quarter were gains on the sale of securities of $87.3 million, a net increase of $196.2
million over securities gains (losses) realized in the third quarter of 2003. The current quarter also
included the recognition of $86.7 million of mortgage servicing rights (“MSR”) impairment, a
$195.2 million unfavorable variance from the third quarter of 2003. Since the end of the second
quarter of 2004, the yield on 10-year Treasury Notes decreased 46 basis points to 4.12 percent.
The yield on 30-year Fannie Mae commitments declined 51 basis points during the same
timeframe. Driven by the decrease in longer-term interest rates, the mortgage industry experienced
an increase in refinancing activities, resulting in more prepayments.
Total net revenue on a taxable-equivalent basis for the third quarter of 2004 was $302.8
million (10.1 percent) higher than the third quarter of 2003, primarily reflecting the $196.2 million
net increase in gains (losses) on the sale of securities and growth in the majority of other fee-based
revenue categories. The expansion of the Company’s merchant acquiring business in Europe,
including the purchase of the remaining 50 percent shareholder interest in EuroConex
Technologies Ltd from the Bank of Ireland and the acquisition of two European merchant
acquiring businesses, accounted for approximately $24 million of the favorable variance year-over-
year.
Total noninterest expense in the third quarter of 2004 was $265.7 million (21.2 percent)
higher than the third quarter of 2003, primarily reflecting the $195.2 million unfavorable change in
the valuation of mortgage servicing rights. The expansion of the Company’s merchant acquiring
business in Europe accounted for approximately $29 million of the increase, including $6 million
of business integration costs, while higher compensation, employee benefits, marketing and
(MORE)
3. U.S. Bancorp Reports Third Quarter 2004 Results
October 19, 2004
Page 3
business development, and technology and communication also contributed to the increase year-
over-year.
Provision for credit losses for the third quarter of 2004 was $165.1 million, a decrease of
$144.9 million (46.7 percent) from the third quarter of 2003. Net charge-offs in the third quarter of
2004 were $165.1 million, compared with the second quarter of 2004 net charge-offs of $204.5
million and the third quarter of 2003 net charge-offs of $309.9 million. The decline in losses from
a year ago was primarily the result of declining levels of nonperforming loans, collection efforts
and higher commercial loan recoveries. Total nonperforming assets declined to $804.6 million at
September 30, 2004, from $910.9 million at June 30, 2004 (11.7 percent), and $1,318.3 million at
September 30, 2003 (39.0 percent). The ratio of the allowance for credit losses to nonperforming
loans was 337 percent at September 30, 2004, compared with 299 percent at June 30, 2004, and
202 percent at September 30, 2003.
On December 31, 2003, the Company completed the spin-off of Piper Jaffray Companies
(NYSE: PJC). In connection with the spin-off, accounting rules require that the financial
statements be restated for all prior periods. As such, historical financial results related to Piper
Jaffray Companies have been segregated and accounted for in the Company’s financial statements
as discontinued operations. Net income in the third quarter of 2003 included after-tax income from
the discontinued operations of Piper Jaffray Companies of $10.2 million, or $.01 per diluted share.
(MORE)
4. U.S. Bancorp Reports Third Quarter 2004 Results
October 19, 2004
Page 4
Table 2
INCOME STATEMENT HIGHLIGHTS
(Taxable-equivalent basis, $ in millions, Percent Percent
except per-share data) Change Change
3Q 2Q 3Q 3Q04 vs 3Q04 vs YTD YTD Percent
2004 2004 2003 2Q04 3Q03 2004 2003 Change
Net interest income $1,781.7 $1,779.4 $1,825.5 0.1 (2.4) $5,340.1 $5,400.8 (1.1)
Noninterest income 1,524.0 1,241.7 1,177.4 22.7 29.4 4,084.0 4,016.4 1.7
Total net revenue 3,305.7 3,021.1 3,002.9 9.4 10.1 9,424.1 9,417.2 0.1
Noninterest expense 1,519.0 1,232.6 1,253.3 23.2 21.2 4,206.5 4,254.5 (1.1)
Provision for credit losses 165.1 204.5 310.0 (19.3) (46.7) 604.6 968.0 (37.5)
Income from continuing operations before income taxes 1,621.6 1,584.0 1,439.6 2.4 12.6 4,613.0 4,194.7 10.0
Taxable-equivalent adjustment 7.1 7.0 7.0 1.4 1.4 21.3 21.0 1.4
Applicable income taxes 549.0 540.1 491.9 1.6 11.6 1,480.9 1,433.9 3.3
Income from continuing operations 1,065.5 1,036.9 940.7 2.8 13.3 3,110.8 2,739.8 13.5
Income from discontinued operations (after-tax) -- -- 10.2 nm nm -- 15.8 nm
Net income $1,065.5 $1,036.9 $950.9 2.8 12.1 $3,110.8 $2,755.6 12.9
Diluted earnings per share:
Income from continuing operations $0.56 $0.54 $0.48 3.7 16.7 $1.62 $1.42 14.1
Discontinued operations -- -- 0.01 nm nm -- 0.01 nm
Net income $0.56 $0.54 $0.49 3.7 14.3 $1.62 $1.43 13.3
Net Interest Income
Third quarter net interest income on a taxable-equivalent basis was $1,781.7 million,
compared with $1,825.5 million recorded in the third quarter of 2003. Average earning assets for
the period increased over the third quarter of 2003 by $4.3 billion (2.6 percent), primarily driven by
increases in investment securities, retail loans and residential mortgages, partially offset by a
decline in commercial loans and loans held for sale related to mortgage banking activities. The net
interest margin in the third quarter of 2004 was 4.22 percent, compared with 4.28 percent in the
second quarter of 2004 and 4.43 percent in the third quarter of 2003. The decline in the net interest
margin in the third quarter of 2004 from the third quarter of 2003 primarily reflected a modest
increase in the percent of total earnings assets funded by wholesale sources of funding and higher
rates paid on wholesale funding due to the impact of rising rates.
(MORE)
5. U.S. Bancorp Reports Third Quarter 2004 Results
October 19, 2004
Page 5
NET INTEREST INCOME Table 3
(Taxable-equivalent basis; $ in millions)
Change Change
3Q 2Q 3Q 3Q04 vs 3Q04 vs YTD YTD
2004 2004 2003 2Q04 3Q03 2004 2003 Change
Components of net interest income
Income on earning assets $2,309.9 $2,243.2 $2,318.3 $ 66.7 $ (8.4) $6,818.4 $6,991.3 $ (172.9)
Expense on interest-bearing liabilities 528.2 463.8 492.8 64.4 35.4 1,478.3 1,590.5 (112.2)
Net interest income $1,781.7 $1,779.4 $1,825.5 $ 2.3 $ (43.8) $5,340.1 $5,400.8 $ (60.7)
Average yields and rates paid
Earning assets yield 5.47 % 5.39 % 5.63 % 0.08 % (0.16) % 5.44 % 5.84 % (0.40) %
Rate paid on interest-bearing liabilities 1.55 1.38 1.49 0.17 0.06 1.46 1.66 (0.20)
Gross interest margin 3.92 % 4.01 % 4.14 % (0.09) % (0.22) % 3.98 % 4.18 % (0.20) %
Net interest margin 4.22 % 4.28 % 4.43 % (0.06) % (0.21) % 4.26 % 4.51 % (0.25) %
Average balances
Investment securities $42,502 $42,489 $37,777 $ 13 $ 4,725 $43,243 $36,059 $ 7,184
Loans 122,906 121,161 119,982 1,745 2,924 120,966 118,045 2,921
Earning assets 168,187 166,990 163,865 1,197 4,322 167,182 159,832 7,350
Interest-bearing liabilities 136,106 134,819 131,693 1,287 4,413 135,300 127,998 7,302
Net free funds* 32,081 32,171 32,172 (90) (91) 31,882 31,834 48
* Represents noninterest-bearing deposits, allowance for loan losses, unrealized gain (loss) on available-for-sale securities, non-earning assets,
other noninterest-bearing liabilities and equity
(MORE)
6. U.S. Bancorp Reports Third Quarter 2004 Results
October 19, 2004
Page 6
Table 4
AVERAGE LOANS
($ in millions) Percent Percent
Change Change
3Q 2Q 3Q 3Q04 vs 3Q04 vs YTD YTD Percent
2004 2004 2003 2Q04 3Q03 2004 2003 Change
Commercial $34,457 $34,484 $36,958 (0.1) (6.8) $34,191 $36,627 (6.7)
Lease financing 4,860 4,846 5,022 0.3 (3.2) 4,869 5,131 (5.1)
Total commercial 39,317 39,330 41,980 -- (6.3) 39,060 41,758 (6.5)
Commercial mortgages 20,231 20,477 20,089 (1.2) 0.7 20,420 20,144 1.4
Construction and development 6,963 6,639 7,308 4.9 (4.7) 6,720 6,948 (3.3)
Total commercial real estate 27,194 27,116 27,397 0.3 (0.7) 27,140 27,092 0.2
Residential mortgages 14,569 14,052 12,234 3.7 19.1 14,079 11,131 26.5
Credit card 6,145 5,989 5,606 2.6 9.6 6,005 5,462 9.9
Retail leasing 6,842 6,484 5,806 5.5 17.8 6,507 5,773 12.7
Home equity and second mortgages 14,288 13,775 13,093 3.7 9.1 13,815 13,291 3.9
Other retail 14,551 14,415 13,866 0.9 4.9 14,360 13,538 6.1
Total retail 41,826 40,663 38,371 2.9 9.0 40,687 38,064 6.9
Total loans $122,906 $121,161 $119,982 1.4 2.4 $120,966 $118,045 2.5
Average loans for the third quarter of 2004 were $2.9 billion (2.4 percent) higher than the
third quarter of 2003, primarily due to growth in average retail loans of $3.5 billion (9.0 percent)
and residential mortgages of $2.3 billion (19.1 percent) year-over-year. Total commercial loans
declined by $2.7 billion (6.3 percent), while total commercial real estate loans decreased by $203
million (.7 percent). While economic conditions have improved somewhat from a year ago, excess
liquidity and improving cash flows among corporate borrowers have led to the overall decrease in
total commercial loans. Average loans for the third quarter of 2004 were higher than the second
quarter of 2004 by $1.7 billion (1.4 percent), primarily reflecting growth in retail loans and
residential mortgages.
Average investment securities in the third quarter of 2004 were $4.7 billion (12.5 percent)
higher than in the third quarter of 2003, reflecting the reinvestment of proceeds from declining
commercial loan balances and loans held for sale. Investment securities at September 30, 2004,
were $4.6 billion higher than at September 30, 2003, but $631 million lower than the balance at
(MORE)
7. U.S. Bancorp Reports Third Quarter 2004 Results
October 19, 2004
Page 7
June 30, 2004. During the third quarter of 2004, the Company acquired principally floating and
shorter-term fixed-rate securities and sold fixed-rate mortgage-backed securities.
Table 5
AVERAGE DEPOSITS
($ in millions) Percent Percent
Change Change
3Q 2Q 3Q 3Q04 vs 3Q04 vs YTD YTD Percent
2004 2004 2003 2Q04 3Q03 2004 2003 Change
Noninterest-bearing deposits $29,791 $30,607 $31,907 (2.7) (6.6) $29,807 $32,412 (8.0)
Interest-bearing deposits
Interest checking 20,413 20,739 20,148 (1.6) 1.3 20,699 18,601 11.3
Money market accounts 31,854 34,242 33,980 (7.0) (6.3) 33,492 31,285 7.1
Savings accounts 5,854 5,936 5,846 (1.4) 0.1 5,896 5,579 5.7
Savings products 58,121 60,917 59,974 (4.6) (3.1) 60,087 55,465 8.3
Time certificates of deposit less
than $100,000 12,869 13,021 14,824 (1.2) (13.2) 13,168 15,936 (17.4)
Time deposits greater than $100,000 14,535 12,571 11,251 15.6 29.2 13,085 12,836 1.9
Total interest-bearing deposits 85,525 86,509 86,049 (1.1) (0.6) 86,340 84,237 2.5
Total deposits $115,316 $117,116 $117,956 (1.5) (2.2) $116,147 $116,649 (0.4)
Average noninterest-bearing deposits for the third quarter of 2004 were lower than the third
quarter of 2003 by $2.1 billion (6.6 percent). Average branch-based noninterest-bearing deposits
for the third quarter of 2004, however, increased by $589 million (4.9 percent) over the same
quarter of 2003, as net new checking account growth continued to gain momentum. This growth
was more than offset, by reductions in average noninterest-bearing deposits in other areas,
including national corporate banking, wholesale mortgage banking and government banking, as
well as in mortgage-related escrow balances. Average total savings products declined year-over-
year by $1.9 billion (3.1 percent). Average branch-based savings products deposits, which include
interest checking, money market accounts and savings accounts, however, increased by $789
million (1.9 percent) over the same quarter of 2003. This positive variance in branch-based
savings products deposits, was more than offset by reductions in other areas, including a $2.8
billion reduction in government-related deposits.
Average noninterest-bearing deposits for the third quarter of 2004 were $816 million (2.7
percent) lower than the second quarter of 2004. Average branch-based noninterest-bearing
deposits, however, increased by $206 million (1.6 percent) quarter-over-quarter. This growth was
(MORE)
8. U.S. Bancorp Reports Third Quarter 2004 Results
October 19, 2004
Page 8
more than offset by lower government banking deposits associated with the timing of tax filings,
seasonally lower corporate trust deposits and a decline in mortgage banking-related deposits.
Average interest-bearing deposits were also lower than the second quarter of 2004 (1.1 percent),
primarily due to decreases in savings products, primarily driven by lower government banking
deposits, as well as lower time certificates of deposit less than $100,000. These unfavorable
variances were partially offset by an increase in time deposits greater than $100,000. Noninterest-
bearing deposits at September 30, 2004, were lower than at September 30, 2003, by $856 million
(2.6 percent) and $1.2 billion (3.7 percent) lower than at June 30, 2004.
Table 6
NONINTEREST INCOME
($ in millions) Percent Percent
Change Change
3Q 2Q 3Q 3Q04 vs 3Q04 vs YTD YTD Percent
2004 2004 2003 2Q04 3Q03 2004 2003 Change
Credit and debit card revenue $164.3 $158.8 $137.6 3.5 19.4 $464.9 $407.3 14.1
Corporate payment products revenue 108.5 102.7 95.7 5.6 13.4 306.0 272.6 12.3
ATM processing services 45.2 44.9 41.3 0.7 9.4 132.3 125.6 5.3
Merchant processing services 187.5 165.1 146.3 13.6 28.2 493.7 415.4 18.8
Trust and investment management fees 240.2 251.7 239.8 (4.6) 0.2 740.5 707.3 4.7
Deposit service charges 207.4 202.1 187.0 2.6 10.9 594.7 529.2 12.4
Treasury management fees 117.9 121.5 126.2 (3.0) (6.6) 356.9 350.0 2.0
Commercial products revenue 106.7 107.4 97.8 (0.7) 9.1 324.5 302.0 7.5
Mortgage banking revenue 97.2 109.9 89.5 (11.6) 8.6 301.3 275.2 9.5
Investment products fees and commissions 37.1 42.2 35.5 (12.1) 4.5 118.6 108.7 9.1
Securities gains (losses), net 87.3 (171.7) (108.9) nm nm (84.4) 244.9 nm
Other 124.7 107.1 89.6 16.4 39.2 335.0 278.2 20.4
Total noninterest income $1,524.0 $1,241.7 $1,177.4 22.7 29.4 $4,084.0 $4,016.4 1.7
Noninterest Income
Third quarter noninterest income was $1,524.0 million, an increase of $346.6 million (29.4
percent) from the same quarter of 2003, and a $282.3 million (22.7 percent) increase over the
second quarter of 2004. The increase in noninterest income over the third quarter of 2003 was
driven by a net increase in gains (losses) on the sale of securities of $196.2 million, as well as
favorable variances in the majority of fee income categories. Credit and debit card revenue and
(MORE)
9. U.S. Bancorp Reports Third Quarter 2004 Results
October 19, 2004
Page 9
corporate payment products revenue were higher in the third quarter of 2004 than the third quarter
of 2003 by $26.7 million (19.4 percent) and $12.8 million (13.4 percent), respectively. Although
credit and debit card revenue grew year-over-year, the growth was somewhat muted due to the
impact of the settlement of the antitrust litigation brought against VISA USA and Mastercard by
Wal-Mart Stores, Inc., Sears Roebuck & Co. and other retailers, which lowered the interchange
rate on signature debit transactions beginning in August 2003. The year-over-year impact of the
VISA settlement on credit and debit card revenue was approximately $7.8 million. This change in
the interchange rate, in addition to higher customer loyalty rewards expenses, however, were more
than offset by growth in transaction volumes and other rate changes. The corporate payment
products revenue growth reflected growth in sales, card usage and rate changes. ATM processing
services revenue was higher by $3.9 million (9.4 percent) in the third quarter of 2004 than the same
quarter of the prior year due to increases in transaction volumes and sales. Merchant processing
services revenue was higher in the third quarter of 2004 than the same quarter of 2003 by $41.2
million (28.2 percent), reflecting an increase in transaction volume, higher merchant and
equipment fees and the recent expansion of the Company’s merchant acquiring business in Europe.
The recent European acquisitions accounted for approximately $26 million of the total increase.
Deposit service charges were higher year-over-year by $20.4 million (10.9 percent) due to account
growth, revenue enhancement initiatives and transaction-related fees. Commercial products
revenue increased by $8.9 million (9.1 percent) over the third quarter of 2003, primarily due to
leasing revenue. The favorable variance year-over-year in mortgage banking revenue of $7.7
million (8.6 percent) was primarily due to higher loan servicing revenue. The $1.6 million (4.5
percent) increase in investment products fees and commissions reflected higher sales activity in the
Consumer Banking business line. Other income was higher year-over-year by $35.1 million (39.2
percent), primarily due to a residual value insurance recovery during the third quarter of 2004 and a
favorable change in retail lease residual gains (losses) relative to the same quarter of 2003.
Partially offsetting these positive variances were treasury management fees, which declined by
$8.3 million (6.6 percent) in the third quarter of 2004 from the same period of 2003. The decrease
in treasury management fees year-over-year was primarily due to higher fees received during the
third quarter of 2003 specifically related to the change in the Federal government’s payment
methodology for treasury management services from compensating balances, reflected in net
interest income, to fees.
(MORE)
10. U.S. Bancorp Reports Third Quarter 2004 Results
October 19, 2004
Page 10
Noninterest income was higher in the third quarter of 2004 than the second quarter of 2004 by
$282.3 million (22.7 percent), primarily due to a net increase in gains (losses) on the sale of
securities of $259.0 million. Credit and debit card revenue, corporate payment products revenue
and ATM processing services increased quarter-over-quarter by $5.5 million (3.5 percent), $5.8
million (5.6 percent) and $.3 million (.7 percent), respectively, driven by seasonally higher
transaction volumes and sales. Merchant processing services revenue rose by $22.4 million (13.6
percent) over the second quarter of 2004 due to the expansion of the European merchant acquiring
business, in addition to seasonality and higher same store sales. Deposit service charges were
higher in the third quarter by $5.3 million (2.6 percent) than the second quarter, primarily due to an
increase in transaction-related fees. Other income was $17.6 million (16.4 percent) higher quarter-
over-quarter, reflecting a residual value insurance recovery during the third quarter. Trust and
investment management fees were lower in the third quarter of 2004 than the second quarter of
2004 by $11.5 million (4.6 percent) partially due to the seasonality of second quarter tax
preparation fees. Treasury management fees decreased by $3.6 million (3.0 percent) quarter-over-
quarter, primarily due to lower federal tax receipts processing relative to the second quarter.
Mortgage banking revenue was lower in the third quarter of 2004 than the second quarter of 2004
by $12.7 million (11.6 percent), primarily due to lower origination and sales revenue, partially
offset by an increase in loan servicing revenue. Investment products fees and commissions
declined by $5.1 million (12.1 percent) due to seasonally lower sales.
(MORE)
11. U.S. Bancorp Reports Third Quarter 2004 Results
October 19, 2004
Page 11
Table 7
NONINTEREST EXPENSE
($ in millions) Percent Percent
Change Change
3Q 2Q 3Q 3Q04 vs 3Q04 vs YTD YTD Percent
2004 2004 2003 2Q04 3Q03 2004 2003 Change
Compensation $564.6 $572.6 $543.8 (1.4) 3.8 $1,673.0 $1,637.4 2.2
Employee benefits 100.0 91.2 75.8 9.6 31.9 291.4 247.1 17.9
Net occupancy and equipment 159.2 153.4 161.3 3.8 (1.3) 468.3 482.1 (2.9)
Professional services 37.2 34.7 39.9 7.2 (6.8) 104.3 99.2 5.1
Marketing and business development 60.6 48.7 48.6 24.4 24.7 144.6 129.5 11.7
Technology and communications 109.8 102.4 102.1 7.2 7.5 313.9 311.1 0.9
Postage, printing and supplies 61.4 60.5 61.6 1.5 (0.3) 183.5 183.8 (0.2)
Other intangibles 210.2 (47.6) 10.8 nm nm 388.7 558.2 (30.4)
Merger and restructuring-related charges -- -- 10.2 nm nm -- 38.6 nm
Other 216.0 216.7 199.2 (0.3) 8.4 638.8 567.5 12.6
Total noninterest expense $1,519.0 $1,232.6 $1,253.3 23.2 21.2 $4,206.5 $4,254.5 (1.1)
Noninterest Expense
Third quarter noninterest expense totaled $1,519.0 million, an increase of $265.7 million (21.2
percent) from the same quarter of 2003 and a $286.4 million (23.2 percent) increase over the
second quarter of 2004. The increase in expense year-over-year was primarily driven by the
unfavorable change in MSR intangible valuations of $195.2 million and operating expenses related
to the expansion of the Company’s merchant acquiring business in Europe. The expense growth
also reflected increases in compensation, employee benefits, marketing and business development,
and technology and communications and certain business integration costs. Compensation
expense was higher year-over-year due to an increase in salaries and performance-based incentives
from a year ago. Employee benefits increased year-over-year by $24.2 million (31.9 percent),
primarily as a result of a $14.7 million increase in pension expense and higher payroll taxes.
Marketing and business development expense was higher by $12.0 million (24.7 percent),
reflecting the increase and timing of marketing campaigns, while technology and communications
expense rose by $7.7 million (7.5 percent), primarily due to outsourcing certain institutional trust
participant record-keeping functions and capital expenditures for imaging and other electronic
payments initiatives.
(MORE)
12. U.S. Bancorp Reports Third Quarter 2004 Results
October 19, 2004
Page 12
Noninterest expense in the third quarter of 2004 was higher than the second quarter of 2004 by
$286.4 million (23.2 percent). The increase in noninterest expense over the second quarter of 2004
was primarily due to changes in MSR intangible valuations of $257.8 million, as well as increases
in employee benefits, net occupancy and equipment, professional services, marketing and business
development, technology and communications, and postage, printing and supplies. Employee
benefit costs primarily reflect higher pension expense. Net occupancy and equipment costs reflect
changes in rental costs, utilities and maintenance costs. Changes in marketing and business
development reflect the timing of brand advertising programs and marketing campaigns while
technology costs reflect capital investments and higher network costs. Other expense, excluding
the impact of the expanded European merchant acquiring business, was slightly lower in the third
quarter of 2004, primarily due to charge-back expense associated with the Company’s airline
merchant portfolio that was recorded in the second quarter of 2004.
(MORE)
13. U.S. Bancorp Reports Third Quarter 2004 Results
October 19, 2004
Page 13
Table 8
ALLOWANCE FOR CREDIT LOSSES
($ in millions) 3Q 2Q 1Q 4Q 3Q
2004 2004 2004 2003 2003
Balance, beginning of period $2,369.7 $2,369.7 $2,368.6 $2,367.7 $2,367.6
Net charge-offs
Commercial 2.7 35.7 53.6 100.9 123.9
Lease financing 18.2 18.9 21.3 14.9 19.2
Total commercial 20.9 54.6 74.9 115.8 143.1
Commercial mortgages 2.7 1.8 4.6 10.0 5.9
Construction and development 2.5 0.7 4.7 2.9 4.6
Total commercial real estate 5.2 2.5 9.3 12.9 10.5
Residential mortgages 6.7 7.3 7.3 7.2 7.3
Credit card 64.3 62.7 63.4 62.3 59.3
Retail leasing 9.6 9.8 11.0 11.3 12.2
Home equity and second mortgages 18.7 20.2 19.5 20.4 23.2
Other retail 39.7 47.4 48.5 55.2 54.3
Total retail 132.3 140.1 142.4 149.2 149.0
Total net charge-offs 165.1 204.5 233.9 285.1 309.9
Provision for credit losses 165.1 204.5 235.0 286.0 310.0
Balance, end of period $2,369.7 $2,369.7 $2,369.7 $2,368.6 $2,367.7
Components
Allowance for loan losses $2,184.0 $2,189.7 $2,185.6 $2,183.6 $2,184.0
Liability for unfunded credit commitments* 185.7 180.0 184.1 185.0 183.7
Total allowance for credit losses $2,369.7 $2,369.7 $2,369.7 $2,368.6 $2,367.7
Gross charge-offs $259.5 $274.3 $304.8 $352.3 $373.6
Gross recoveries $94.4 $69.8 $70.9 $67.2 $63.7
Net charge-offs to average loans (%) 0.53 0.68 0.79 0.95 1.02
Allowance as a percentage of:
Period-end loans 1.90 1.93 1.98 2.00 1.98
Nonperforming loans 337 299 258 232 202
Nonperforming assets 295 260 226 206 180
* During the first quarter of 2004, the Company reclassified the portion of its allowance for credit losses related to commercial
off-balance sheet loan commitments and letters of credit to a separate liability account. Amounts for periods presented in 2003,
represent estimates.
Credit Quality
The allowance for credit losses was $2,369.7 million at September 30, 2004, equal to the
allowance for credit losses at June 30, 2004, and essentially equal to the allowance for credit losses
(MORE)
14. U.S. Bancorp Reports Third Quarter 2004 Results
October 19, 2004
Page 14
of $2,367.7 million at September 30, 2003. The ratio of the allowance for credit losses to period-
end loans was 1.90 percent at September 30, 2004, compared with 1.93 percent at June 30, 2004,
and 1.98 percent at September 30, 2003. The ratio of the allowance for credit losses to
nonperforming loans was 337 percent at September 30, 2004, compared with 299 percent at June
30, 2004, and 202 percent at September 30, 2003. Total net charge-offs in the third quarter of 2004
were $165.1 million, compared with the second quarter of 2004 net charge-offs of $204.5 million
and the third quarter of 2003 net charge-offs of $309.9 million.
Commercial and commercial real estate loan net charge-offs were $26.1 million for the third
quarter of 2004, or .16 percent of average loans outstanding, compared with $57.1 million, or .35
percent of average loans outstanding, in the second quarter of 2004 and $153.6 million, or .88
percent of average loans outstanding, in the third quarter of 2003. The decline in net charge-offs
continues to be broad-based across most industries within the commercial loan portfolio and was
favorably influenced by higher levels of commercial loan recoveries in the third quarter of 2004.
Commercial loan recoveries are expected to return to more normal levels in future periods.
Retail loan net charge-offs of $132.3 million in the third quarter of 2004 were $7.8 million
(5.6 percent) lower than the second quarter of 2004 and $16.7 million (11.2 percent) lower than the
third quarter of 2003. Retail loan net charge-offs as a percent of average loans outstanding were
1.26 percent in the third quarter of 2004, compared with 1.39 percent and 1.54 percent in the
second quarter of 2004 and third quarter of 2003, respectively. Lower levels of retail loan net
charge-offs principally reflected the Company’s improvement in ongoing collection efforts and risk
management.
(MORE)
15. U.S. Bancorp Reports Third Quarter 2004 Results
October 19, 2004
Page 15
Table 9
CREDIT RATIOS
(Percent) 3Q 2Q 1Q 4Q 3Q
2004 2004 2004 2003 2003
Net charge-offs ratios*
0.03 0.42 0.64 1.14 1.33
Commercial
1.49 1.57 1.75 1.19 1.52
Lease financing
0.21 0.56 0.78 1.15 1.35
Total commercial
0.05 0.04 0.09 0.20 0.12
Commercial mortgages
0.14 0.04 0.29 0.16 0.25
Construction and development
0.08 0.04 0.14 0.19 0.15
Total commercial real estate
0.18 0.21 0.22 0.21 0.24
Residential mortgages
4.16 4.21 4.34 4.33 4.20
Credit card
0.56 0.61 0.71 0.76 0.83
Retail leasing
0.52 0.59 0.59 0.62 0.70
Home equity and second mortgages
1.09 1.32 1.38 1.57 1.55
Other retail
1.26 1.39 1.45 1.53 1.54
Total retail
0.53 0.68 0.79 0.95 1.02
Total net charge-offs
Delinquent loan ratios - 90 days or more past due excluding nonperforming loans**
0.05 0.05 0.06 0.06 0.11
Commercial
0.01 0.01 0.01 0.02 0.01
Commercial real estate
0.46 0.50 0.56 0.61 0.63
Residential mortgages
0.47 0.48 0.54 0.56 0.57
Retail
0.23 0.24 0.27 0.28 0.29
Total loans
Delinquent loan ratios - 90 days or more past due including nonperforming loans**
1.14 1.37 1.67 1.97 2.31
Commercial
0.75 0.76 0.85 0.82 0.75
Commercial real estate
0.77 0.79 0.87 0.91 0.98
Residential mortgages
0.51 0.52 0.59 0.62 0.63
Retail
0.80 0.88 1.03 1.14 1.27
Total loans
* annualized and calculated on average loan balances
** ratios are expressed as a percent of ending loan balances
The overall level of net charge-offs in the third quarter of 2004 reflected the Company’s
ongoing efforts to reduce the overall risk profile of the organization and the higher level of
commercial loan recoveries during the third quarter of 2004. Net charge-offs are expected to
increase modestly as commercial loan recoveries return to more normal levels in future periods.
(MORE)
16. U.S. Bancorp Reports Third Quarter 2004 Results
October 19, 2004
Page 16
Table 10
ASSET QUALITY
($ in millions)
Sep 30 Jun 30 Mar 31 Dec 31 Sep 30
2004 2004 2004 2003 2003
Nonperforming loans
Commercial $347.7 $415.7 $510.7 $623.5 $793.9
Lease financing 91.3 111.0 115.6 113.3 111.6
Total commercial 439.0 526.7 626.3 736.8 905.5
Commercial mortgages 165.7 163.8 184.9 177.6 161.5
Construction and development 35.3 41.3 43.6 39.9 40.2
Commercial real estate 201.0 205.1 228.5 217.5 201.7
Residential mortgages 45.3 41.7 42.1 40.5 46.1
Retail 17.2 18.4 20.4 25.2 21.6
Total nonperforming loans 702.5 791.9 917.3 1,020.0 1,174.9
Other real estate 68.7 70.0 76.0 72.6 70.4
Other nonperforming assets 33.4 49.0 53.3 55.5 73.0
Total nonperforming assets* $804.6 $910.9 $1,046.6 $1,148.1 $1,318.3
Accruing loans 90 days or more past due $291.8 $293.2 $319.2 $329.4 $352.4
Nonperforming assets to loans
plus ORE (%) 0.64 0.74 0.87 0.97 1.10
*does not include accruing loans 90 days or more past due
Nonperforming assets at September 30, 2004, totaled $804.6 million, compared with
$910.9 million at June 30, 2004, and $1,318.3 million at September 30, 2003. The ratio of
nonperforming assets to loans and other real estate was .64 percent at September 30, 2004,
compared with .74 percent at June 30, 2004, and 1.10 percent at September 30, 2003. While
nonperforming assets are expected to continue to decline slightly during the next few quarters, the
ongoing level of nonperforming assets is expected to stabilize at those lower levels.
(MORE)
17. U.S. Bancorp Reports Third Quarter 2004 Results
October 19, 2004
Page 17
Table 11
CAPITAL POSITION
($ in millions) Sep 30 Jun 30 Mar 31 Dec 31 Sep 30
2004 2004 2004 2003 2003
Total shareholders' equity $19,600 $18,675 $19,452 $19,242 $19,771
Tier 1 capital 14,589 14,294 14,499 14,623 14,589
Total risk-based capital 21,428 21,255 21,559 21,710 21,859
Common equity to assets 10.2 % 9.8 % 10.1 % 10.2 % 10.5 %
Tangible common equity to assets 6.4 6.3 6.4 6.5 6.5
Tier 1 capital ratio 8.7 8.7 8.9 9.1 9.0
Total risk-based capital ratio 12.7 12.9 13.3 13.6 13.5
Leverage ratio 7.9 7.8 8.0 8.0 8.0
Total shareholders’ equity was $19.6 billion at September 30, 2004, compared with $19.8
billion at September 30, 2003. The decrease was primarily the result of corporate earnings offset
by share buybacks and dividends, including the special dividend of $685 million related to the
December 31, 2003, spin-off of Piper Jaffray Companies.
Tangible common equity to assets was 6.4 percent at September 30, 2004, compared with
6.3 percent at June 30, 2004, and 6.5 percent at September 30, 2003. The Tier 1 capital ratio was
8.7 percent at September 30, 2004, and at June 30, 2004, compared with 9.0 percent at September
30, 2003. The total risk-based capital ratio was 12.7 percent at September 30, 2004, compared
with 12.9 percent at June 30, 2004, and 13.5 percent at September 30, 2003. The leverage ratio
was 7.9 percent at September 30, 2004, compared with 7.8 percent at June 30, 2004, and 8.0
percent at September 30, 2003. All regulatory ratios continue to be in excess of stated “well
capitalized” requirements.
(MORE)
18. U.S. Bancorp Reports Third Quarter 2004 Results
October 19, 2004
Page 18
Table 12
COMMON SHARES
(Millions) 3Q 2Q 1Q 4Q 3Q
2004 2004 2004 2003 2003
Beginning shares outstanding 1,884.1 1,901.2 1,922.9 1,927.4 1,924.5
Shares issued for stock option and stock purchase
plans, acquisitions and other corporate purposes 6.2 3.7 12.1 10.5 2.9
Shares repurchased (19.5) (20.8) (33.8) (15.0) --
Ending shares outstanding 1,870.8 1,884.1 1,901.2 1,922.9 1,927.4
On December 16, 2003, the board of directors of U.S. Bancorp approved an authorization
to repurchase 150 million shares of outstanding common stock during the following 24 months.
During the third quarter of 2004, the Company repurchased 19.5 million shares of common stock.
As of September 30, 2004, there were approximately 68 million shares remaining to be
repurchased under the current authorization.
(MORE)
19. U.S. Bancorp Reports Third Quarter 2004 Results
October 19, 2004
Page 19
Table 13
LINE OF BUSINESS FINANCIAL PERFORMANCE*
($ in millions)
Operating Earnings** Percent Change 3Q 2004
3Q 2Q 3Q 3Q04 vs 3Q04 vs YTD YTD Percent Earnings
Business Line 2004 2004 2003 2Q04 3Q03 2004 2003 Change Composition
Wholesale Banking $278.0 $266.3 $213.2 4.4 30.4 $795.1 $637.3 24.8 26 %
Consumer Banking 409.5 388.5 355.2 5.4 15.3 1,073.1 999.3 7.4 39
Private Client, Trust
and Asset Management 110.8 109.4 99.3 1.3 11.6 330.0 284.7 15.9 10
Payment Services 185.0 177.7 153.6 4.1 20.4 524.5 432.5 21.3 17
Treasury and Corporate Support 82.2 95.0 126.1 (13.5) (34.8) 388.1 411.4 (5.7) 8
Consolidated Company $1,065.5 $1,036.9 $947.4 2.8 12.5 $3,110.8 $2,765.2 12.5 100 %
* preliminary data
** earnings before merger and restructuring-related items and discontinued operations
Lines of Business
Within the Company, financial performance is measured by major lines of business which
include Wholesale Banking, Consumer Banking, Private Client, Trust and Asset Management,
Payment Services, and Treasury and Corporate Support. These operating segments are
components of the Company about which financial information is available and is evaluated
regularly in deciding how to allocate resources and assess performance. Noninterest expenses
incurred by centrally managed operations or business lines that directly support another business
line’s operations are charged to the applicable business line based on its utilization of those
services primarily measured by the volume of customer activities. These allocated expenses are
reported as net shared services expense. Designations, assignments and allocations may change
from time to time as management systems are enhanced, methods of evaluating performance or
product lines change or business segments are realigned to better respond to our diverse customer
base. During 2004, certain organization and methodology changes were made and, accordingly,
prior period results have been restated and presented on a comparable basis.
Wholesale Banking offers lending, depository, treasury management and other financial
services to middle market, large corporate and public sector clients. Wholesale Banking
contributed $278.0 million of the Company’s operating earnings in the third quarter of 2004, a 30.4
(MORE)
20. U.S. Bancorp Reports Third Quarter 2004 Results
October 19, 2004
Page 20
percent increase over the same period of 2003 and a 4.4 percent increase over the second quarter of
2004. The increase in Wholesale Banking’s third quarter 2004 contribution over the third quarter
of 2003 was primarily the result of favorable variances in the provision for credit losses and total
noninterest expense (6.7 percent), partially offset by a decrease in total net revenue (4.3 percent).
The decline in total net revenue from the third quarter of 2003 reflected unfavorable variances in
both net interest income (4.4 percent) and noninterest income (4.6 percent). The decrease in net
interest income was primarily due to a decline in average total loans outstanding (6.5 percent) and
average noninterest bearing deposits (13.3 percent) and savings products (32.6 percent) due, in
part, to lower deposits associated with government banking and mortgage banking activities. The
decline in noninterest income was primarily the result of unfavorable variances in treasury
management fees and commercial products revenue. Treasury management fees were lower (9.1
percent) year-over-year due to a reduction in fees from the Federal government relative to the same
quarter of 2003, while the unfavorable variance in commercial products revenue (2.9 percent) was
primarily due to lower capital markets activity and other non-yield-related loan fees. Wholesale
Banking’s favorable variance in total noninterest expense year-over-year was primarily the result
of a decline in net shared services (9.0 percent), which is primarily driven by customer transaction
volume and account activities. The decrease in the provision for credit losses year-over-year was
the result of the favorable change from net charge-offs of $104.4 million in the third quarter of
2003 to net recoveries of $12.7 million in the current quarter. The increase in Wholesale Banking’s
contribution to operating earnings in the third quarter of 2004 over the second quarter of 2004 was
the net result of favorable variances in the provision for credit losses and total noninterest expense
(2.5 percent), partially offset by lower total net revenue (1.2 percent). Total net revenue was
slightly lower on a linked quarter basis, with essentially flat net interest income, but lower
noninterest income (3.8 percent). The unfavorable variance quarter-over-quarter in noninterest
income was primarily attributed to lower treasury management fees, the result of lower Federal tax
receipt processing activity relative to the second quarter of 2004. The decrease in noninterest
expense was principally due to lower net shared services and professional services expense. Net
recoveries for the third quarter of 2004 drove the favorable variance in provision for credit losses
over the prior quarter.
Consumer Banking delivers products and services to the broad consumer market and small
businesses through banking offices, telemarketing, on-line services, direct mail and automated
(MORE)
21. U.S. Bancorp Reports Third Quarter 2004 Results
October 19, 2004
Page 21
teller machines (“ATMs”). It encompasses community banking, metropolitan banking, branch
ATM banking, small business banking, including lending guaranteed by the Small Business
Administration, small-ticket leasing, consumer lending, mortgage banking, workplace banking,
student banking, 24-hour banking, and investment product and insurance sales. Consumer
Banking contributed $409.5 million of the Company’s operating earnings in the third quarter of
2004, a 15.3 percent increase over the same period of 2003 and a 5.4 percent increase over the
second quarter of 2004. While the retail banking business segment grew operating earnings by
26.2 percent and 10.5 percent over the third quarter of 2003 and the second quarter of 2004,
respectively, the contribution of the mortgage banking business declined from both of the previous
reporting periods. The decrease in the mortgage banking business’s contribution from the third
quarter of 2003 was the net result of a decline in net interest income and an increase in noninterest
expense, excluding the change in MSR valuation. The increase in noninterest expense, excluding
the change in MSR valuation, was primarily due to an increase in other intangible amortization, the
result of the growing servicing portfolio. In the third quarter of 2004, as in the third quarter of
2003, net gains (losses) on securities in the mortgage banking business line were offset by the
change in MSR valuation. The mortgage banking business line’s contribution declined in the third
quarter of 2004 from the second quarter of 2004, primarily due to lower net interest income and
noninterest income and higher operating expense.
For the Consumer Banking business, as a whole, the favorable variance in gains (losses) on
the sale of securities was offset with the unfavorable variance in MSR valuation year-over-year.
Excluding net gains (losses) on the sale of securities, total net revenue was higher than the same
quarter of the 2003 by 5.2 percent, primarily due to an increase in noninterest income (18.0
percent). Consumer Banking’s results also benefited from a reduction in the provision for credit
losses (16.5 percent), while total noninterest expense, excluding the change in MSR valuations,
was essentially flat from the third quarter of 2003. Net interest income was slightly lower year-
over-year (.3 percent), the result of increases in average loans outstanding (8.7 percent), offset by
declines in the average balance of loans held for sale and in the business line’s net interest margin.
Noninterest income improved in the third quarter of 2004 over the same period of 2003, primarily
due to growth in deposit service charges (11.1 percent), commercial products revenue (45.7
percent), mortgage banking revenue (7.7 percent), investment products fees and commissions (4.0
percent) and other revenue. Other revenue was higher due to a residual value insurance recovery
(MORE)
22. U.S. Bancorp Reports Third Quarter 2004 Results
October 19, 2004
Page 22
during the third quarter of 2004 and a favorable change in lease residual gains (losses). Total
noninterest expense, excluding the change in MSR valuation, in the third quarter of 2004 was
essentially flat to the third quarter of 2003, with higher compensation and employee benefits (2.1
percent), net occupancy and equipment (1.3 percent), and other intangibles (9.7 percent), offset by
lower net shared services (7.9 percent) and other expense (1.6 percent). A reduction in net charge-
offs year-over-year drove the positive variance in the business line’s provision for credit losses.
The increase in Consumer Banking’s contribution in the third quarter of 2004 over the second
quarter of 2004 was primarily the result of favorable variances in total net revenue, excluding net
gains (losses) on the sale of securities (2.1 percent), and a reduction in the provision for credit
losses (5.7 percent). Offsetting these favorable variances was slightly higher noninterest expense,
excluding the change in MSR valuation (.2 percent). The growth in noninterest income, excluding
net gains (losses) on the sale of securities, quarter-over-quarter was driven by deposit service
charges (2.7 percent), treasury management fees (5.0 percent) and other revenue (26.7 percent).
The unfavorable variance in noninterest expense, excluding the change in MSR valuation, quarter-
over-quarter was primarily the result of slightly higher compensation and employee benefits and
other expense.
Private Client, Trust and Asset Management provides trust, private banking, financial
advisory, investment management and mutual fund and alternative investment product services
through five businesses: Private Client Group, Corporate Trust, Asset Management, Institutional
Trust and Custody, and Fund Services, LLC. Private Client, Trust and Asset Management
contributed $110.8 million of the Company’s operating earnings in the third quarter of 2004, 11.6
percent higher than the same period of 2003 and 1.3 percent higher than the second quarter of
2004. The favorable variance in the business line’s contribution in the third quarter of 2004 over
the third quarter of 2003 was the result of favorable variances in net interest income (18.8 percent),
total noninterest expense (1.7 percent) and the provision for credit losses. Higher average loans
outstanding (3.8 percent) and average total deposits (14.5 percent) favorably impacted net interest
income year-over-year. Noninterest income was slightly lower than the same quarter of 2003 (.7
percent). The increase in the business line’s contribution (1.3 percent) in the third quarter of 2004
over the second quarter of 2004 was primarily the result of slightly lower total noninterest expense
(.9 percent) and a favorable variance in the provision for credit losses, offset by lower total net
revenue (2.0 percent). Although net interest income rose (7.8 percent) quarter-over-quarter,
(MORE)
23. U.S. Bancorp Reports Third Quarter 2004 Results
October 19, 2004
Page 23
noninterest income fell by 5.4 percent from the second quarter of 2004 to the third quarter of 2004.
The increase in net interest income was primarily driven by an increase in average loans
outstanding (1.3 percent), while noninterest income declined partially due to seasonally lower tax
preparation fees relative to the second quarter of 2004.
Payment Services includes consumer and business credit cards, debit cards, corporate and
purchasing card services, consumer lines of credit, ATM processing, and merchant processing.
Payment Services contributed $185.0 million of the Company’s operating earnings in the third
quarter of 2004, a 20.4 percent increase over the same period of 2003, and a 4.1 percent increase
over the second quarter of 2004. The increase in Payment Services’ contribution in the third
quarter of 2004 over the same period of 2003 was the result of higher total net revenue (13.6
percent) and a lower provision for credit losses (8.9 percent), partially offset by an increase in total
noninterest expense (16.0 percent). The increase in total net revenue year-over-year was primarily
due to growth in noninterest income (21.2 percent), partially offset by lower net interest income
(7.4 percent), which primarily reflected higher corporate card rebates and a reduction in late fees
relative to the prior year’s quarter. The increase in noninterest income was principally the result of
growth in credit and debit card revenue (19.4 percent), corporate payment products revenue (13.4
percent), ATM processing service revenue (13.5 percent) and merchant processing services
revenue (28.2 percent). Although credit and debit card revenue was negatively impacted in the
third quarter of 2004 by the VISA debit card settlement and higher customer loyalty rewards
expense, increases in transaction volumes and other rate changes more than offset these
detrimental changes. The increase in merchant processing revenue included approximately $26
million associated with the expansion of the Company’s merchant acquiring business in Europe.
The growth in total noninterest expense year-over-year primarily reflected an increase in
processing expense related to the business line’s revenue growth, including approximately $23
million associated with the European merchant acquiring business. The increase in Payment
Services’ contribution in the third quarter of 2004 over the second quarter of 2004 was primarily
due to seasonally strong total net revenue (4.8 percent) and lower provision for credit losses (5.5
percent), offset by an increase in total noninterest expense (9.7 percent), the result of the increase
in processing-related expense and the expansion of the merchant acquiring business in Europe.
Treasury and Corporate Support includes the Company’s investment portfolios, funding,
capital management and asset securitization activities, interest rate risk management, the net effect
(MORE)
24. U.S. Bancorp Reports Third Quarter 2004 Results
October 19, 2004
Page 24
of transfer pricing related to average balances and the residual aggregate of expenses associated
with business activities managed on a corporate basis, including enterprise-wide operations and
administrative support functions. Operational expenses incurred by Treasury and Corporate
Support on behalf of the other business lines are allocated back primarily based on customer
transaction volume and account activities to the appropriate business unit and are identified as net
shared services expense. Treasury and Corporate Support recorded operating earnings of $82.2
million in the third quarter of 2004, compared with operating earnings of $126.1 million in the
third quarter of 2003 and $95.0 million in the second quarter of 2004. The decrease in operating
earnings in the current quarter from the third quarter of 2003 was largely due to lower total net
revenue (7.5 percent) and higher total noninterest expense (39.6 percent). Lower total net revenue
reflected the Company’s asset/liability management decisions to invest in lower-yield floating-rate
securities, higher-cost fixed funding and repositioning of the balance sheet for changes in the
interest rate environment. The increase in total noninterest expense year-over-year reflected higher
compensation and employee benefits, specifically performance-based incentives and pension
expense, as well as an unfavorable variance in net shared services. The unfavorable variance in
operating earnings in the third quarter of 2004 from the second quarter of 2004 was the result of
lower total net revenue (5.8 percent) and higher total noninterest expense (5.0 percent). Total net
revenue declined quarter-over-quarter, primarily due to the continuing asset/liability management
decisions of the Company, while the increase in noninterest expense reflected higher net
occupancy and equipment costs and other expense.
Additional schedules containing more detailed information about the Company’s business line
results are available on the web at usbank.com or by calling Investor Relations at 612-303-0781.
(MORE)
25. U.S. Bancorp Reports Third Quarter 2004 Results
October 19, 2004
Page 25
CHAIRMAN, PRESIDENT AND CHIEF EXECUTIVE OFFICER, JERRY A.
GRUNDHOFER, AND VICE CHAIRMAN AND CHIEF FINANCIAL OFFICER, DAVID
M. MOFFETT, WILL HOST A CONFERENCE CALL TO REVIEW THE FINANCIAL
RESULTS ON TUESDAY, October 19, 2004, AT 1:00 p.m. (CDT). To access the conference
call, please dial 800-223-9488 and ask for the U.S. Bancorp earnings conference call. Participants
calling from outside the United States, please call 785-832-1508. For those unable to participate
during the live call, a recording of the call will be available approximately one hour after the
conference call ends on Tuesday, October 19, 2004, and will run through Tuesday, October 26,
2004, at 11:00 p.m. (CDT). To access the recorded message dial 888-276-5316. If calling from
outside the United States, please dial 402-220-2333. After October 26th, a recording of the call
will continue to be available by webcast on the U.S. Bancorp web site at usbank.com.
Minneapolis-based U.S. Bancorp (“USB”), with $193 billion in assets, is the 6th largest
financial services holding company in the United States. The company operates 2,346 banking
offices and 4,621 ATMs, and provides a comprehensive line of banking, brokerage, insurance,
investment, mortgage, trust and payment services products to consumers, businesses and
institutions. U.S. Bancorp is the parent company of U.S. Bank. Visit U.S. Bancorp on the web at
usbank.com.
(MORE)
26. U.S. Bancorp Reports Third Quarter 2004 Results
October 19, 2004
Page 26
Forward-Looking Statements
This press release contains forward-looking statements. Statements that are not historical
or current facts, including statements about beliefs and expectations, are forward-looking
statements. These statements often include the words “may,” “could,” “would,” “should,”
“believes,” “expects,” “anticipates,” “estimates,” “intends,” “plans,” “targets,” “potentially,”
“probably,” “projects,” “outlook” or similar expressions. These forward-looking statements cover,
among other things, anticipated future revenue and expenses and the future prospects of the
Company. Forward-looking statements involve inherent risks and uncertainties, and important
factors could cause actual results to differ materially from those anticipated, including the
following, in addition to those contained in the Company's reports on file with the SEC: (i) general
economic or industry conditions could be less favorable than expected, resulting in a deterioration
in credit quality, a change in the allowance for credit losses, or a reduced demand for credit or fee-
based products and services; (ii) changes in the domestic interest rate environment could reduce
net interest income and could increase credit losses; (iii) inflation, changes in securities market
conditions and monetary fluctuations could adversely affect the value or credit quality of the
Company's assets, or the availability and terms of funding necessary to meet the Company's
liquidity needs; (iv) changes in the extensive laws, regulations and policies governing financial
services companies could alter the Company's business environment or affect operations; (v) the
potential need to adapt to industry changes in information technology systems, on which the
Company is highly dependent, could present operational issues or require significant capital
spending; (vi) competitive pressures could intensify and affect the Company's profitability,
including as a result of continued industry consolidation, the increased availability of financial
services from non-banks, technological developments, or bank regulatory reform; (vii) changes in
consumer spending and savings habits could adversely affect the Company’s results of operations;
(viii) changes in the financial performance and condition of the Company’s borrowers could
negatively affect repayment of such borrowers’ loans; (ix) acquisitions may not produce revenue
enhancements or cost savings at levels or within time frames originally anticipated, or may result
in unforeseen integration difficulties; (x) capital investments in the Company's businesses may not
produce expected growth in earnings anticipated at the time of the expenditure; and (xi) acts or
threats of terrorism, and/or political and military actions taken by the U.S. or other governments in
response to acts or threats of terrorism or otherwise could adversely affect general economic or
industry conditions. Forward-looking statements speak only as of the date they are made, and the
Company undertakes no obligation to update them in light of new information or future events.
###
(MORE)
27. U.S. Bancorp
Consolidated Statement of Income
Three Months Ended Nine Months Ended
(Dollars and Shares in Millions, Except Per Share Data) September 30, September 30,
(Unaudited) 2004 2003 2004 2003
Interest Income
Loans $1,802.8 $1,818.3 $5,289.8 $5,476.0
Loans held for sale 21.1 59.5 68.3 170.9
Investment securities
Taxable 448.8 403.6 1,351.5 1,222.1
Non-taxable 4.4 6.7 14.4 23.1
Other interest income 25.7 23.2 73.1 78.2
Total interest income 2,302.8 2,311.3 6,797.1 6,970.3
Interest Expense
Deposits 221.4 256.4 653.7 851.5
Short-term borrowings 74.5 44.9 183.3 123.3
Long-term debt 205.3 167.9 566.0 536.2
Junior subordinated debentures 27.0 23.6 75.3 79.5
Total interest expense 528.2 492.8 1,478.3 1,590.5
Net interest income 1,774.6 1,818.5 5,318.8 5,379.8
Provision for credit losses 165.1 310.0 604.6 968.0
Net interest income after provision for credit losses 1,609.5 1,508.5 4,714.2 4,411.8
Noninterest Income
Credit and debit card revenue 164.3 137.6 464.9 407.3
Corporate payment products revenue 108.5 95.7 306.0 272.6
ATM processing services 45.2 41.3 132.3 125.6
Merchant processing services 187.5 146.3 493.7 415.4
Trust and investment management fees 240.2 239.8 740.5 707.3
Deposit service charges 207.4 187.0 594.7 529.2
Treasury management fees 117.9 126.2 356.9 350.0
Commercial products revenue 106.7 97.8 324.5 302.0
Mortgage banking revenue 97.2 89.5 301.3 275.2
Investment products fees and commissions 37.1 35.5 118.6 108.7
Securities gains (losses), net 87.3 (108.9) (84.4) 244.9
Other 124.7 89.6 335.0 278.2
Total noninterest income 1,524.0 1,177.4 4,084.0 4,016.4
Noninterest Expense
Compensation 564.6 543.8 1,673.0 1,637.4
Employee benefits 100.0 75.8 291.4 247.1
Net occupancy and equipment 159.2 161.3 468.3 482.1
Professional services 37.2 39.9 104.3 99.2
Marketing and business development 60.6 48.6 144.6 129.5
Technology and communications 109.8 102.1 313.9 311.1
Postage, printing and supplies 61.4 61.6 183.5 183.8
Other intangibles 210.2 10.8 388.7 558.2
Merger and restructuring-related charges -- 10.2 -- 38.6
Other 216.0 199.2 638.8 567.5
Total noninterest expense 1,519.0 1,253.3 4,206.5 4,254.5
Income from continuing operations before income taxes 1,614.5 1,432.6 4,591.7 4,173.7
Applicable income taxes 549.0 491.9 1,480.9 1,433.9
Income from continuing operations 1,065.5 940.7 3,110.8 2,739.8
Income from discontinued operations (after-tax) -- 10.2 -- 15.8
Net income $1,065.5 $950.9 $3,110.8 $2,755.6
Earnings Per Share
Income from continuing operations $.57 $.49 $1.64 $1.43
Discontinued operations -- -- -- --
Net income $.57 $.49 $1.64 $1.43
Diluted Earnings Per Share
Income from continuing operations $.56 $.48 $1.62 $1.42
Discontinued operations -- .01 -- .01
Net income $.56 $.49 $1.62 $1.43
Dividends declared per share $.240 $.205 $.720 $.615
Average common shares outstanding 1,877.0 1,926.0 1,894.6 1,922.4
Average diluted common shares outstanding 1,903.7 1,939.8 1,919.4 1,932.4
Page 27
28. U.S. Bancorp
Consolidated Ending Balance Sheet
September 30, December 31, September 30,
(Dollars in Millions) 2004 2003 2003
Assets (Unaudited) (Unaudited)
Cash and due from banks $6,969 $8,630 $9,187
Investment securities
Held-to-maturity 120 152 180
Available-for-sale 39,534 43,182 34,835
Loans held for sale 1,372 1,433 3,640
Loans
Commercial 40,151 38,526 41,170
Commercial real estate 27,414 27,242 27,242
Residential mortgages 14,741 13,457 12,976
Retail 42,520 39,010 38,494
Total loans 124,826 118,235 119,882
Less allowance for loan losses (2,184) (2,184) (2,184)
Net loans 122,642 116,051 117,698
Premises and equipment 1,894 1,957 2,028
Customers' liability on acceptances 146 121 143
Goodwill 6,226 6,025 6,329
Other intangible assets 2,419 2,124 2,138
Other assets 11,522 9,796 12,841
Total assets $192,844 $189,471 $189,019
Liabilities and Shareholders' Equity
Deposits
Noninterest-bearing $31,585 $32,470 $32,441
Interest-bearing 70,011 74,749 74,419
Time deposits greater than $100,000 13,971 11,833 8,183
Total deposits 115,567 119,052 115,043
Short-term borrowings 12,648 10,850 12,864
Long-term debt 35,328 31,215 31,603
Junior subordinated debentures 2,676 2,601 2,605
Acceptances outstanding 146 121 143
Other liabilities 6,879 6,390 6,990
Total liabilities 173,244 170,229 169,248
Shareholders' equity
Common stock 20 20 20
Capital surplus 5,868 5,851 5,853
Retained earnings 16,260 14,508 14,677
Less treasury stock (2,710) (1,205) (1,031)
Other comprehensive income 162 68 252
Total shareholders' equity 19,600 19,242 19,771
Total liabilities and shareholders' equity $192,844 $189,471 $189,019
Page 28
30. U.S. Bancorp
Income Statement Highlights
Financial Results and Ratios on an Operating Basis
(Excluding Merger and Restructuring-Related Items and Discontinued Operations)
Percent Change
Three Months Ended v. September 30, 2004
(Dollars and Shares in Millions, Except Per Share Data) September 30, June 30, September 30, June 30, September 30,
(Unaudited) 2004 2004 2003 2004 2003
Net interest income (taxable-equivalent basis) $1,781.7 $1,779.4 $1,825.5 .1 % (2.4) %
Noninterest income 1,524.0 1,241.7 1,177.4 22.7 29.4
Total net revenue 3,305.7 3,021.1 3,002.9 9.4 10.1
Noninterest expense 1,519.0 1,232.6 1,243.1 23.2 22.2
Operating earnings before provision and income taxes 1,786.7 1,788.5 1,759.8 (.1) 1.5
Provision for credit losses 165.1 204.5 310.0 (19.3) (46.7)
Operating earnings before income taxes 1,621.6 1,584.0 1,449.8 2.4 11.8
Taxable-equivalent adjustment 7.1 7.0 7.0 1.4 1.4
Applicable income taxes 549.0 540.1 495.4 1.6 10.8
Operating earnings 1,065.5 1,036.9 947.4 2.8 12.5
Merger and restructuring-related items (after-tax) -- -- (6.7) -- *
Discontinued operations (after-tax) -- -- 10.2 -- *
Net income in accordance with GAAP $1,065.5 $1,036.9 $950.9 2.8 12.1
Diluted Earnings Per Share
Operating earnings $.56 $.54 $.49 3.7 14.3
Net income .56 .54 .49 3.7 14.3
Financial Ratios on an Operating Basis
Net interest margin** 4.22 % 4.28 % 4.43 %
Interest yield on average loans** 5.86 5.79 6.03
Rate paid on interest-bearing liabilities 1.55 1.38 1.49
Return on average assets 2.21 2.19 1.98
Return on average equity 21.9 21.9 19.4
Efficiency ratio*** 47.2 38.6 39.9
Tangible efficiency ratio**** 40.7 40.1 39.6
* Not meaningful
** On a taxable-equivalent basis
*** Computed as noninterest expense divided by the sum of net interest income on a taxable-equivalent basis and noninterest income
excluding securities gains (losses), net
**** Computed as noninterest expense divided by the sum of net interest income on a taxable-equivalent basis and noninterest income
excluding securities gains (losses), net and intangible amortization
Page 30
31. U.S. Bancorp
Income Statement Highlights
Financial Results and Ratios on an Operating Basis
(Excluding Merger and Restructuring-Related Items and Discontinued Operations)
Nine Months Ended
(Dollars and Shares in Millions, Except Per Share Data) September 30, September 30, Percent
(Unaudited) 2004 2003 Change
Net interest income (taxable-equivalent basis) $5,340.1 $5,400.8 (1.1) %
Noninterest income 4,084.0 4,016.4 1.7
Total net revenue 9,424.1 9,417.2 .1
Noninterest expense 4,206.5 4,215.9 (.2)
Operating earnings before provision and income taxes 5,217.6 5,201.3 .3
Provision for credit losses 604.6 968.0 (37.5)
Operating earnings before income taxes 4,613.0 4,233.3 9.0
Taxable-equivalent adjustment 21.3 21.0 1.4
Applicable income taxes 1,480.9 1,447.1 2.3
Operating earnings 3,110.8 2,765.2 12.5
Merger and restructuring-related items (after-tax) -- (25.4) *
Discontinued operations (after-tax) -- 15.8 *
Net income in accordance with GAAP $3,110.8 $2,755.6 12.9
Diluted Earnings Per Share
Operating earnings $1.62 $1.43 13.3
Net income 1.62 1.43 13.3
Financial Ratios on an Operating Basis
Net interest margin** 4.26 % 4.51 %
Interest yield on average loans** 5.86 6.21
Rate paid on interest-bearing liabilities 1.46 1.66
Return on average assets 2.18 1.98
Return on average equity 21.5 19.3
Efficiency ratio*** 44.2 46.0
Tangible efficiency ratio**** 40.2 39.9
* Not meaningful
** On a taxable-equivalent basis
*** Computed as noninterest expense divided by the sum of net interest income on a taxable-equivalent basis and noninterest income
excluding securities gains (losses), net
**** Computed as noninterest expense divided by the sum of net interest income on a taxable-equivalent basis and noninterest income
excluding securities gains (losses), net and intangible amortization
Page 31